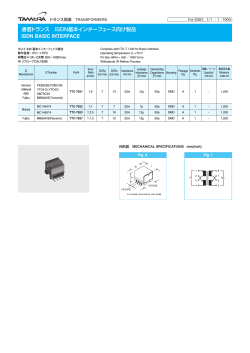
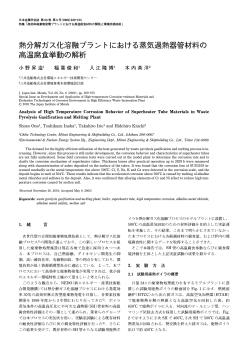
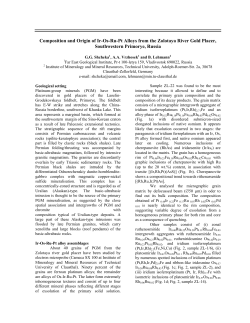
日本電子株式会社
日本電子株式会社
日本電子株式会社
JEOL
MSMS
Data
Sheet
JEOL
Data
Sheet
Mass Spectrometry Application Group
応用研究センター
Mass
Spectrometry
Business Unit
分析機器
応用研究グループ
MS
事業ユニット
MS アプリケーショングループ
〒
196-8558
東京都昭島市武蔵野
3-1-2
お問い合わせ:分析機器販促グループ
JEOL Ltd.
お問い合わせ:分析機器販促グループ
Tel JEOL
: (042) 542-2242,
Fax
:
(042)
542-3132
Tel : (042)
528-3340
site:
www.jeol.com
Tel : Global
(042) 528-3340
www.jeol.co.jp
MS
MSTips
Tips
(SP: 02/’09)
No.No.
XX No.163
(P , 03/’10)
No. 040
JMS-S3000 Application Data
Measurement of synthetic polymer with JMS-S3000“SpiralTOF”
~Polystyrene~
Polystyrene(PS)1000 and 2400 were measured with JMS-S3000
by spiral mode. The [M+H]+ peaks of the fragments of PS1000 and
C
H
PS2400 whose basic unit has 104u mass number were observed.
H
C
n
2
(Fig.1) The mass spectrum of PS1000 and its expansion image
around m/z 1000 were shown in Fig. 2. The MS resolution at m/z
1101 was approximately 50,000 (FWHM). The mass difference
between 8, 9 and 10-mers had very good match with the theoretical
Fig.1 Constitutional repeating unit
mass number (104.0626) calculated from the elemental composition
(C8H8=104.0626)
of the repeating unit(C8H8). The mass spectrum of PS24000 and
the expansion image of isotopic pattern of 23-mer were shown in Fig
(b)
104.0625
104.0626
(9mer)
(10mer)
(8mer)
1101.5461
1103.5482
997.4836
1205.6086
999.4853
1207.6112
3. The observed isotopic pattern of 23-mer has very good agreement
with simulated one (R 60,000).
a
4
u
pea
o e Spec t 03
u 5 80,
eg t
35 39,
ea
6093,
9533
(a)
Intensit y
Intensity
x10
2.0
1000
0.0
500
1000
1500
2000
2500
1100
3000
m/ z
m/z
Fig.2 Mass spectrum of PS1000(a) and of 8-10mer(b)
Simulation of 23mer
C180H186Ag
R=60000
(b)
(b)
(b)
x10
Profile Spec
Maximum
peak:trum
m/ z 2561.4284, Height
5
1200
m/ z
244716, Area
2068988, R
61558
(a)
Intensit y
2.0
2557
2558
2559
2560
2561
2562
2563
2564
m/ z
P-C11-00-001_PS2400.tas DataSet: 0323_MH_HL_PS Spot: C11 Acquired: 2010-03-23 15:32
2560
m/z
1.0
2565
2566
2565
2567
2568
2569
Isotope distribution of 23mer
0.0
1000
2000
3000
m/ z
4000
2557
2558
2559
2560
2561
2560
2562
2563
m/ z
m/z
2564
2565
2566
2565
2567
2568
2569
Fig.3 Mass spectrum of PS2400(a) and of 23mer with simulation(b)
Copyright © 2010 JEOL Ltd.
© Copyright 2026 ExpyDoc