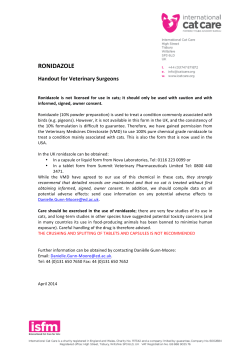
Industry Response
Link V. Welborn, DVM, DABVP
1
Industry Response
A Practice Owner’s Perspective
Link V. Welborn, DVM, DABVP
2
formulas
Q = f ( P; Y, n, Z, X, …)
εp ≡
∆Q
Q
∆P
P
∆Q P
∆Q P
=
×
=
×
∆P Q
Q ∆P
∂Q P
εp ≡
.
∂P Q
εY ≡
∆Q
Q
∆Y
Y
∆Q Y
∆Q Y
=
×
=
×
Q ∆Y ∆Y Q
∂Q Y
εY =
∂Y Q
3
$140,000.00
$130,000.00
$120,000.00
$110,000.00
Debt and Income:
New Graduates
Real Mean Debt
$100,000.00
$90,000.00
$80,000.00
Indexed Real Mean Income (RWI)
$70,000.00
$60,000.00
$50,000.00
$40,000.00
4
Debt Double Whammy
• Unintended consequences of
graduate/professional loan programs
• Can borrow full out-of-pocket cost of graduate
study (tuition, fees, books & living costs)
– For some students, extent of debt is not tangible
– Enabled universities to transfer more of the cost of
education to students when funds from other sources
decreased
5
Return on Educational Investment for Veterinarians
Food
Animal
Average
Industry/
Commercial
Uniform
Services
College/
University
-$71,462
$427,608
$286,108
$126,973
-0.4
3.5%
2.4%
1.1%
-2.1%
-3.5%
-3.8%
Break-Even Age
MALE
post-65
35
38
46
post-65
post-65
post-65
Net Present Value
$41,480
$694,563
$509,396
$301,152
0.4%
4.8%
3.5%
2.1%
-1.5%
-3.1%
-3.4%
58
33
35
39
post-65
post-65
post-65
Mixed
Equine
FEMALE
Net Present Value
Return on
Investment
Return on
Investment
Break-Even Age
-$281,993 -$463,350 -$502,357
-$234,019 -$471,343 -$522,386
6
Future of Applicant Pool?
• VMCAS applicants survey: 7% indicated they
would pay $750,000 or more to attend
veterinary school
• Some surely will make a different choice when
ROI information is publicized
– Median debt of 2014 medical school graduates=
$180,000
– M.B.A. graduates, adjusted for inflation, owed
roughly the same in 2012 as in 2004
7
BLS Highest paying occupations:
20 occupations with the highest median annual pay in 2012
Physicians, some
dentists
This wage is equal to or greater than $187,200
2012 MEDIAN
PAY
Psychiatrists
$173,330
Family practitioners
$172,020
$154,650
Pediatricians
$148,160
Nurse anesthetists
$145,240
Dentists, general
$130,280
Petroleum engineers
Architectural and
$124,870
engineering
managers
$122,530
Air traffic controllers
Computer and
$120,950
information systems
managers
$119,480
Marketing manager
Veterinarian
$84,460
Veterinary
$30,290
Technicians
Page 38
Table 12. Professional income of veterinarians in private practice by ownership status, 2011a
Mean ($)
Owner
Associate
Median ($)
Owner
Associate
Food Animal
Exclusive
Food Animal
Predominant
Mixed
Animal
Companion
Animal
Predominant
Companion
Animal
Exclusive
Equine
Other
Total Private
Practice
159,803
114,690
124,051
136,681
166,926
143,959
96,824
$149,394
89,854
82,162
79,858
92,987
96,605
80,528
97,429
$94,683
136,000
100,000
100,000
112,000
136,000
112,000
76,000
$124,000
76,000
76,000
76,000
76,000
88,000
76,000
88,000
$88,000
10,973
5,541
4,750
6,919
8,780
9,168
12,562
3,516
(95)
(117)
(285)
(161)
(234)
(196)
(17)
(1,105)
6,352
3,308
2,881
5,725
1,773
3,057
11,541
1,262
(48)
(37)
(160)
(85)
(448)
(148)
(14)
(940)
Standard Error ($)
/ Usable
Responses
Owner
2013 AVMA Report on Veterinary Compensation
AmericanVeterinary Medical Association
Associate
a
Weighted estimates based on the AVMA membership.
Page 110
Table 74. Professional income of veterinarians by specialty board certification, 2011a
DVM Only
Mean
($)
112,529
Anesthesiologists
138,916
Behaviorists
Median
($)
100,000
130,000
n
Standard Error
($)
1,505
Usable
Responses
2,511
11,746
14
n
n
n
Clinical Pharmacology
n
n
n
n
Dental College
n
n
n
n
Dermatology
158,375
$142,000
26,577
8
Emergency and Critical Care
137,636
$124,000
19,786
11
Internal Medicine
139,008
$124,000
7,704
65
Lab Animal Medicine
Microbiologists
178,520
146,729
172,000
130,000
6,015
14,530
109
12
n
n
n
Ophthalmologists
Nutrition
160,000
n
$148,000
24,166
9
Pathologists
158,333
148,000
6,212
91
AVMA Report on Veterinary Compensation American
Veterinary Medical Association
Poultry
132,000
124,000
9,845
15
Preventative Medicine
121,366
112,000
3,978
118
Radiology
202,310
$184,000
33,606
13
n
n
n
163,239
$148,000
11,440
61
Theriogenologists
140,300
112,000
15,619
20
Toxicology
153,682
136,000
13,623
9
Sports Medicine
Surgeons
n
Veterinary Practitioners (ABVP)
162,829
$124,000
22,684
49
Zoological Medicine
117,000
100,000
12,486
12
a
Weighted estimates based on the AVMA
membership.
n
Insufficient number of usable responses.
Future for Veterinary Colleges?
• Applicant/seat ratio could fall below 1:1 within 5 years given
current conditions, & could threaten the viability of some
colleges
• Current demand exceeds the supply for seats
– Future supply likely to exceed the demand
• No relationship between education costs & salary
• No significant difference in incomes between colleges
• Most consumers & employers don’t seem to differentiate
between graduates from different veterinary schools
• Will veterinary colleges with lower tuition begin to overtly
market their value proposition to prospective students?
• Will new disruptive models of veterinary education develop?
11
Lost Economic Opportunity
$4500 per capita Gap
7.5% Reduction
In Per Capita
GDP
6 year gap = $5.1 trillion
12
Demand for Veterinarians 2000-2014
$250,000
Real Annual Income ($2014)
$200,000
$150,000
2006
2000
$100,000
2014
$50,000
$0
0%
10%
20%
30%
40%
50%
60%
70%
Percent of Veterinarians
80%
90%
100%
13
Times Have Changed
• During the recession, incomes of practice
owners dropped, but associate’s incomes
didn’t
• However, base salaries for new associates
were adjusted down
• Lower base salaries for associates today allow
practice owners to take less risk in hiring
which is positive for veterinary employment
14
PA R T N E R S F O R H E A L T H Y P E T S
R eversing the Decline
TA B L E 1. C ommon Reasons W hy Pet Owners Don’t Use Professional Veterinary Care*
% who “completely agree” or “somewhat agree”
Survey category and question
Perceived need for preventive care
Routine veterinary checkups are
unnecessary
Would only go to a veterinarian if pet is sick
or injured
Cost
Costs of routine visits are higher than
expected
Would probably switch veterinarians if I found
one that was less expensive
Stress of visiting a veterinarian
Pet dislikes going to the veterinarian
Just thinking about taking my pet to the
veterinarian is stressful
Reliance on the Internet
Internet is the first option when the pet is
sick or injured
2010 Survey
2014 Survey
Trend†
24%
22%
-4%
33%
32%
-3%
53%
59%
+11%‡
26%
32%
+27%‡
45%
30%
51%
38%
+13%‡
+27%‡
39%
48%
+23%‡
* Results of Bayer Veterinary Care Usage Studies, 2010 and 2014.
†Relative percentage increase or decrease.
‡ Statistically significant (p<0.05).
Cost of Care has a Perception Problem
• Most independent primary care practices:
– inherited their fee structure
• More sophisticated practices:
– compilations of inherited fee structures
• 1999 KPMG Megastudy & NCVEI- one message stuck:
increase fees- average of 5% per year last 10 years
• Price & Income Elasticities would be very beneficial
• We must leverage technology to extract and normalize
data from practices.
• Win-Win: provide more care with increased revenues
& profits
• Regardless, communication of value is key
PET POPULATION GROWTH IS FASTER THAN PROJECTED
GROWTH IN SMALL ANIMAL VETERINARIAN SUPPLY
Cumulative growth over time starting from 2014
% Growth from 2014
20%
18.8%
18%
16%
14%
12%
9.7%
10%
8%
6%
4%
2%
0%
2014 2015 2016 2017 2018 2019 2020 2021 2022 2023 2024 2025
Pet Population
Source: AVMA
Small Animal Veterinarian Supply
*Assumes growth is consistent with observed growth rates from 1991-2011
Need to better understand the implications of
generational and cultural attitudes toward veterinary
care among future pet owners.
© 2014 Banfield All Rights Reserved
17
UNDEREMPLOYED OR OVERWORKED?
20% of veterinarians report
wanting to work an average
of 12.7 hours LESS per week
~ 79,649
over-utilized
hours per
week
1991 Veterinarians
14.3% of veterinarians
report wanting to work 12.2
hours MORE per week
© 2014 Banfield All Rights Reserved
18
18
2014 Capacity Survey Results
Excess Capacity by Practice Type
Food Animal
2/3 of veterinarians
<1% improvement
Companion Animal
Equine
2014
Mixed
2012
Other Private Practice
13%
U.S. Total, Private Practice
17%
0%
10%
20%
19
Pressure on Practices
Providing care that is perceived to
be expensive & many consumers
can’t afford
Challenges recruiting & retaining
staff due to opportunities
outside the profession
Clinical
Practice
Indivisibility of labor
(worsened by extended
hours), equipment & facilities
Worsening educational debt
will increase stress for associates
working more hours than they
wish
Good News
• CBO projects increases in median household
incomes and consumer spending
• Pet and livestock numbers are projected to grow
• Growth in # of veterinary graduates will decrease
• Overall excess capacity seems to be improving
• Veterinary compensation is increasing
• Increasing knowledge about veterinary
economics will be a consistent trend
21
Break Time
22
© Copyright 2026 ExpyDoc