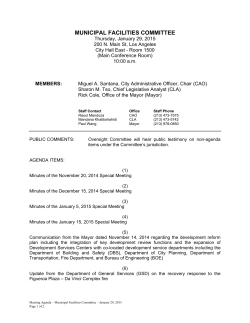
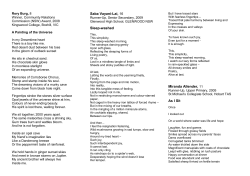
FIRSTENERGY | Global Energy Conference
September 2014
GRAN TIERRA ENERGY INC. (GTE)
ANALYST: Darren B. Engels, CA, CFA
Price 09/05/2014:
C$7.05
OUTPERFORM| 12m Target Price: C$11.50
ASSOCIATE: A. Mark Jackson, CFA
Corporate Profile
GTE - Putumayo
Basin-- Core
Core Position
GTE - Putumayo
Basin
Position
(September 2014)
Gran Tierra Energy holds interests in a total of 34 blocks
in Colombia, Peru, and Brazil, totalling approximately 10
mm acres. The Company has 1P reserves of 51 mmboe, 2P
reserves of 127 mmboe, and 3P reserves of 200 mmboe
(post the disposition of the Argentinian business unit). A
significant uptick to YE13 reserves was witnessed due to
the contribution of the Bretana Field in Peru that added 62
mmbbl of 2P reserves and 114 mmbbl of 3P reserves.
Andes Mountains
OTA Pipeline
Operational Update
The Company’s Colombian operations are predominantly
focused in the Putumayo Basin. The main producing
asset of the Company is the Costayaco Field on the Chaza
Block, while the neighbouring Moqueta Field is becoming
increasingly significant with production expected to ramp up
in late 2014e and 2015e, once the global development permit
is received.
Investment Summary
We have assigned Gran Tierra an Outperform ranking
and a target price of C$11.50 per share, which is based
on our RENAV estimate. The stock is trading well below
our Core NAV estimate of C$8.22 per share. Investors are
not ascribing full value to the Company’s 2P reserves and
zero value to the possible reserves and risked exploration
potential. This provides tremendous downside support for
an investment in Gran Tierra, which is about to embark
on a very meaningful exploration drilling program for the
remainder of 2014e.
54
Gran Tierra Energy Inc. (TSX: GTE)
25
20
15
10
5
Jul-14
Jan-14
Jul-13
Jan-13
Jul-12
Jan-12
0
Source: Bloomberg
Source: Bloomberg
Management and Board Members
•
Dana Coffield - President & Chief Executive Officer
•
James Rozon - Chief Financial Officer
•
Duncan Nightingale - Chief Operations Officer
•
Adrian Coral - President, Gran Tierra Energy Colombia
•
Jeffrey Scott - Chairman
Trading Volume (mm)
$10.00
$9.00
$8.00
$7.00
$6.00
$5.00
$4.00
$3.00
$2.00
$1.00
$0.00
Jul-11
Brazil remains a potential source of longer term upside.
The Company is undertaking an exploration program that
is focused on understanding the unconventional potential
of the basin. Production from the conventional Tie Field
remains restricted due to flaring.
Source: FirstEnergy Capital, Gran Tierra Energy Inc. September
Presentation 2014
Source: FirstEnergy Capital Corp., Gran Tierra Energy Inc. September presentation 2014
Jan-11
Development activities in Peru continue with the longterm production test of the Bretana discovery expected to
commence in November 2014e at approximately 2,500 bbl/d.
The Bretana Sur appraisal well is scheduled for 4Q14e,
which if successful, has the potential to reclassify 52 mmbbl
of possible reserves into the 2P reserve category.
Ecuador
Closing Price
Gran Tierra is expected to spud the Corunta-1A exploration
well in late September 2014e, after the Costayaco-19
well. The original well was a long-reach deviated well that
encountered drilling problems. This prospect lies between
Gran Tierra’s two main fields. The Company will also drill
three other exploration wells in Colombia prior to year-end
2014. The upcoming exploration campaign has the potential
to be very impactful to the Company. We conservatively value
the Colombian exploration portfolio at C$1.40 per share
unrisked (C$0.49 per share risked).
25 km
FIRSTENERGY | Global Energy Conference
September 2014
GRAN TIERRA ENERGY INC. (GTE)
Year-end December 31
2012a
Production and Sales Volumes
Crude oil and liquids - bbl/d
Natural gas - mmcf/d
Total production - boe/d
Sales volumes - boe/d
Crude oil and liquids weight - %
Netbacks
Realized price - US$/boe
Royalties - US$/boe
Operating and transport costs - US$/boe
Operating netback - US$/boe
G&A expense - US$/boe
Taxes - US$/boe
Cash flow netback - US$/boe
Government take - %
2013a
2014e
2015e
22,824
4.8
23,616
16,897
97%
28,347
4.5
29,099
22,266
97%
27,475
3.9
28,122
20,824
98%
29,399
1.4
29,634
24,246
99%
88.39
20.86
14.45
53.08
5.42
8.24
37.55
33%
89.27
21.43
14.03
53.80
4.19
15.54
33.23
41%
81.43
19.19
10.88
51.96
4.50
11.57
35.75
38%
87.90
15.98
15.85
56.06
4.27
12.52
39.08
32%
325
1.15
353
1.24
367
1.27
423
1.46
Financials
Cash flow - US$mm
CFPS - US$/diluted share
2012a
2013a
2014e
2015e
-1%
-1%
1%
22%
18%
8%
-5%
-5%
3%
5%
1%
15%
23.31
25.21
18.97
19.54
20.54
22.57
PDP Recycle Ratio
1P Recycle Ratio
2P Recycle Ratio
1.6
1.5
2.0
1.7
1.6
1.5
ROE - %
ROCE - %
8%
8%
9%
9%
11%
11%
12%
12%
5.50
7.75
7.05
7.05
4.8
15.6
6.3
17.5
5.6
12.6
4.8
10.4
4.1
9.4
5.3
8.2
4.5
7.7
4.1
6.9
56,749
128,954
64,625
99,984
59,057
101,047
58,153
97,720
EV per boe - US$/PDP boe
EV per boe - US$/1P boe
EV per boe - US$/2P boe
36.06
25.40
18.20
44.21
33.92
13.99
41.71
32.61
13.07
41.71
32.61
13.07
EV per boe - US$/1P boe with FDC
EV per boe - US$/2P boe with FDC
31.43
23.32
39.12
26.52
36.65
25.31
5.96
92%
7.69
101%
8.22
86%
8.22
86%
RENAV (Atax, 12%) - $/share
Price / RENAV
7.50
73%
11.52
67%
11.38
62%
11.38
62%
ENAV (Atax, 12%) - $/share
Price / ENAV
N/A
N/A
14.93
52%
14.14
50%
111.68
94.18
1.00
108.74
98.02
0.97
107.56
100.08
0.91
Performance
Production per share growth
Production per debt adjusted share growth
Cash flow per share growth
Cash flow per debt adjusted share growth
PDP FD&A (all-in) - US$/boe
1P FD&A (all-in) - US$/boe
2P FD&A (all-in) - US$/boe
Valuation
Closing price - $/share
P/CF
P/E
Net income - US$ mm
EPS - US$/diluted share
100
0.35
126
0.44
162
0.56
196
0.68
E&D Capex - US$mm
A&D Capex - US$mm
Total Capex - US$mm
Capex - E&D / cash flow
312
-1
312
96%
367
-60
308
104%
482
-43
439
131%
520
0
520
123%
Line of credit - US$mm
Entry debt to cash flow
Net debt / LOC
200
N/A
-1.1
200
N/A
-1.2
200
N/A
-1.0
200
N/A
-0.7
Dividends and Sustainability
Dividends - US$mm
Dividends - $/share
Dividend yield - %
0
0.00
0%
0
0.00
0%
0
0.00
0%
0
0.00
0%
Free cash flow - US$mm
Cash use / cash flow
13
96%
45
87%
-72
120%
-97
123%
Capital Structure
Basic shares - mm
Diluted shares - mm
Year-end December 31
281
282
283
288
285
289
285
289
Market cap - US$mm
1,563
Enterprise value - US$mm
1,340
Net debt - US$mm
-223
Total debt - US$mm
0
Debt to total capitalization
0%
Source: FirstEnergy Capital Corp. and Company Reports
2,126
1,881
-246
0
0%
1,871
1,661
-210
0
0%
1,858
1,723
-134
0
0%
EV/DACF
Target EV/DACF
EV per boe/d
Target EV per boe/d
Net Asset Value
CNAV (Atax, 12%) - $/share
Price / CNAV
Commodity Prices
Brent - US$/bbl
WTI - US$/bbl
Exchange rate - US$/C$
103.75
98.25
0.91
Gran Tierra Energy
Core NAV and Risked NAV
Core NAV
Financial
Cash balance
Working capital
Long-term debt
Net debt
$mm $/share
242
0.84
230
0.79
0
0.00
-230
0.79
Reserves
Colombia
Proved plus probable
Peru
Proved plus probable
Brazil
Proved plus probable
Core NAV
$mm $/share
mmboe
$/boe
60
24.29
1,453
5.02
62
8.57
527
1.82
6
127
28.73
18.70
169
2,379
0.58
8.22
Risked Exploration Upside
Drill
Date
Colombia
Costayaco Field possible reserves
Moqueta Field possible reserves
WI %
Resource Potential
Gross
Net
Net
Unrisked Unrisked
Risked
COS % (mmbbl) (mmbbl) (mmbbl)
NPV
$/bbl
$mm $/share
100%
100%
100%
100%
100%
100%
6
9
15
6
9
15
6
9
15
17.94
17.94
17.94
100
169
269
0.34
0.59
0.93
3Q14e
3Q14e
4Q14e
4Q14e
100%
100%
100%
55%
91%
40%
30%
30%
30%
34%
10
5
5
5
25
10
5
5
3
23
4
2
2
1
8
17.94
17.94
17.94
17.94
17.94
72
27
27
15
140
0.25
0.09
0.09
0.05
0.48
4Q14e
2015e
100%
100%
100%
75%
20%
57%
52
25
78
52
25
78
39
5
44
6.03
6.03
6.03
237
30
267
0.82
0.10
0.92
100%
100%
35%
35%
30
30
30
30
11
11
22.60
22.60
237
237
0.82
0.82
98%
53%
148
145
Colombia
Corunta-1A
Eslabon Sur Shallow-1
Eslabon Sur Deep-1
Cabanas-1
Peru
Block 95, Bretana Sur - Possible
Block 95, Envidia-1
Brazil
2015e exploration
Risked Exploration Upside
Risked NAV
78
11.77
914
3.16
205
16.07
3,293
11.38
Source: FirstEnergy Capital Corp. and Company Reports
55
© Copyright 2024 ExpyDoc