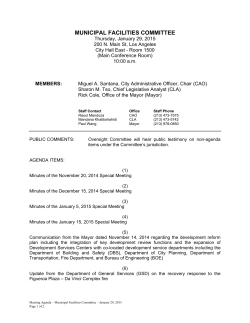
INVESTOR UPDATE JANUARY 2015 1 LONG RUN PROFILE Long Run Exploration is a Calgary‐based intermediate oil and natural gas company focused on light oil development and exploration in western Canada. Northern Gas 2,900 Boe/d ALBERTA BRITISH COLUMBIA Peace River Area Montney 13,850 Boe/d SASKATCHEWAN Deep Basin Area Cardium 11,150 Boe/d • TSX: LRE • Shares Outstanding: 193.5 million Redwater Area Viking 8,200 Boe/d • Dividend: $0.0175/ share/ month • 2015 Production Guidance: 35,000 – 36,000 Boe/d (44% oil + NGLs) 2 CORPORATE STRATEGY • Provide long‐term value to shareholders through a sustainable dividend model • Focus on operational efficiency and capital discipline • Balance production between natural gas and oil • Maintain balanced portfolio combining natural gas and oil; development, enhanced recovery and exploration • Utilize horizontal drilling and completion techniques to improve pool recovery and enhance project economics 3 BUSINESS PLAN Key inputs to a sustainable business model Long‐term focus Extensive drilling inventory Target total payout ratio of 100% or less Enhanced oil recovery ~1,000 booked locations Low basic payout of 20% for 2015 SUSTAINABLE MODEL STRONG ASSET BASE Initiated in both Peace River and Redwater areas Corporate decline of 28% Expected to further reduce over next 12 months Proactive hedging strategy ACTIVE FINANCIAL ~40% of oil & ~40% of natural gas production hedged for 2015 MANAGEMENT Focused capital discipline Improve balance sheet through focused high‐grade development program and selective dispositions BALANCED PORTFOLIO Balanced production mix 44% oil and NGLs for 2015 Strong capital efficiencies All‐in capital efficiency of $26,000/Boe 4 PRODUCTION PROFILE Completed Deep Basin property acquisition (May 2014) 40,000 35,000 Completed Crocotta Energy Inc. acquisition (August 2014) Production (Boe/d) 30,000 25,000 20,000 15,000 10,000 5,000 0 Q1 2014 Peace River Montney Property Redwater Viking Property Q2 2014 Deep Basin Cardium Property Q3 2014 Northern Gas Q4 2014 Estimate (1) Minor Properties Established new Deep Basin Cardium core area in 2014 through the Deep Basin property acquisition in May and the Crocotta Energy Inc. acquisition in August. (1) Based on 2014 Guidance updated November 5, 2014 5 2015 CORPORATE GUIDANCE 2015 Guidance(1) Production average (Boe/d) % oil and NGLs Funds flow from operations ($ million)(2) • Based on WTI US$70/Bbl average for 2015, with an average of ~$60/Bbl in Q1 35,000 – 36,000 44 $200 ‐ $210 Net capital expenditures ($ million)(3) $165 Dividends ($ million)(4) $40 Dividend per share (annual) $0.21 Basic payout ratio(2)(5) 20% Total sustainability ratio(2)(5) 100% • Funds flow includes average operating costs of $13.00/Boe and general and administrative costs of $2.75/Boe • Target of 1,000 ‐ 4,000 Boe/d of divestitures to improve balance sheet (not included in Guidance) • Dividend reinvestment plan (“DRIP”) participation excluded from forecasts 1) 2015 Guidance as released on December 15, 2014 is based on the following assumptions: WTI US$70.00/Bbl; AECO $3.50/GJ; FX USD/CDN 1.145. 2) See “Non‐GAAP Measures” section. 3) Net capital expenditures are calculated as capital expenditures net of acquisitions and divestitures. No acquisitions or divestitures are currently included in our budget. 4) Excluding impact of the DRIP. 5) Based on mid‐range of funds flow guidance, excluding impact of the DRIP. 6 DEVELOPMENT PLAN FOR 2015 Capital Expenditures (by area) Capital Expenditures ≤15 wells ≤25 wells Well Capital $ Millions $115 Plant & Facilities $20 G&G, Land, HS&E $30 TOTAL $165 Deep Basin Cardium Property Peace River Montney Property Redwater Viking Property G&G, Land, HS&E 7 DEVELOPMENT PLAN FOR 2015 Property Overview Peace River Montney Deep Basin Pine Creek Cardium $2.1 $3.0 $3.4 $1.2 $20,000 $17,200 $12,800 $34,300 IP 30 (Boe/d)(2) 190 334 413 72 % liquids 63 58 20 90 IP 365 (Boe/d) (2) 105 175 265 35 % liquids 63 40 20 90 190 (63% liquids) 225 (33% liquids) 365 (20% liquids) 40 (90% liquids) On‐stream cost ($MM)(1) 12‐month capital efficiency (Boe/d) Estimated ultimate recovery (MBoe)(2) Deep Basin Kakwa Cardium Redwater Viking 1) Estimated on‐stream costs are based on internal historical averages 2) Estimated initial well rates and ultimate recovery are based on internal type curve forecasts 8 DEVELOPMENT PLAN FOR 2015 By Property $100 Capital Expenditures Net operating income(1) $ Million $75 $50 $25 ≤25 wells ≤15 wells $0 Peace River Montney Property Deep Basin Cardium Property Redwater Viking Property Northern Gas Minor Properties 1) Net operating income is calculated as revenues minus royalties, transportation costs and operating expenses 9 RISK MANAGEMENT 2015 Natural Gas Hedges $100 60% 50% 60% $4.00 50% $3.80 $90 40% 30% $80 $/Bbl 40% $3.60 30% $3.40 20% 20% $70 10% 0% $60 Q1 Q2 % of Production Hedged Q3 Q4 Average Floor Price 10% $3.20 0% $3.00 Q1 Q2 % of Production Hedged Q3 $/GJ 2015 Oil Hedges Q4 Average Floor Price • Long Run’s on‐going risk management philosophy is to hedge approximately 35% to 50% of our annual production volumes to mitigate commodity price volatility • ~40% of oil and natural gas hedged for 2015 • Average hedge price floor of US$93.44/Bbl for oil, and $3.61/GJ for natural gas for 2015 10 2015 FORECAST SENSITIVITIES Annual Base Assumption +/‐ Impact ($ Million) on 2015 Forecast Sensitivity WTI (USD/Bbl) $70.00 +/‐ $1.00 = $3.6 AECO (CAD/GJ) $3.50 +/‐ $0.10 = $3.0 Edmonton par (CAD) $71.25 +/‐ $1.00 = $3.6 USD/CDN FX 1.145 +/‐ $0.01 = $3.0 Interest Rate 5.00% +/‐ 0.25% = $1.9 11 CAPITAL STRUCTURE Share Capital: • 193.5 million common shares outstanding Debt Structure (at September 30, 2014) Credit Facility $632M Unused Credit Capacity $63M Convertible Debentures $75M Credit Facilities: • Long Run’s lending facilities total $695 million • Financial requirements under the credit facilities relate to bank debt and total debt to trailing 12 month EBITDA and interest coverage(1) Convertible Debentures: • Issued $75 million of unsecured subordinated debentures in January 2014 • Bear interest of 6.40% annually • Mature on January 31, 2019 and are convertible into common shares at a price of $7.40 per share 1) Further details on the calculations of the covenants can be found in the Company’s credit facility agreement filed on SEDAR at www.sedar.com on May 5, 2014, June 6, 2014 and August 25, 2014 under the Company’s profile. 12 DIVIDEND REINVESTMENT PLAN • Long Run is implementing a Dividend Reinvestment Plan (“DRIP”) • Proceeds from the DRIP will be used to support the capital program – No DRIP participation is currently included in our 2015 guidance • Anticipate that the DRIP will be in place for the February 2015 dividend to be paid in March 2015 • Further information to be provided to shareholders at the end of January 13 PEACE RIVER MONTNEY Normandville/Girouxville • Montney horizontal oil development • 950m vertical depth • October 2014 estimated production of 11,100 Boe/d (60% oil and NGLs) • Medium gravity oil (28o API) • Significant owned and operated infrastructure in place • Enhanced oil recovery commenced Normandville Normandville Oil Battery • 5,000 bopd • 15 mmcf/d 12,000 Donnelly Gas Plant • 35 mmcf/d Girouxville LRE Land • 5,000 bopd • 15 mmcf/d LRE HZ Montney Oil Wells Average Production (Boe/d) Girouxville Oil Battery Production 10,000 8,000 6,000 4,000 61% 2,000 0 62% 57% 35% 2010 45% 2011 Oil 2012 2013 Natural Gas 2014 (8 months) 14 ENHANCED OIL RECOVERY (EOR) Peace River Montney Property • Good waterflood candidate for pressure support: Normandville • Large oil in place reservoir • Good rock permeability of 10 ‐ 20 md • EOR project at Normandville currently encompasses five sections • Includes 16 horizontal producers, eight horizontal injection wells and one vertical injection well • EOR project at Girouxville is planned to cover 1.5 sections • Includes six horizontal producers and four horizontal injection wells • Potential to improve recovery by an additional 5 ‐ 15% depending on waterflood pattern/success Girouxville LRE Land Phase 1 LRE HZ Montney Oil Wells Potential EOR Expansion 15 DEEP BASIN CARDIUM Pine Creek/Edson 13‐09 LRE Battery/Compressor Station • 6,500 boe/d (100%) • Cardium horizontal light oil development • 1,800m ‐ 1,900m vertical depth • Bluesky horizontal liquids‐rich natural gas development • 2,400m vertical depth • October 2014 estimated production of 7,200 Boe/d (30% oil and NGLs) • Significant owned and operated infrastructure in place Pine Creek 13‐19 LRE Multiwell Oil Battery • 1,200 bbl/d • 10.5 mmcf/d (97% WI) Average Production (Boe/d) 10,000 01‐13 LRE Gas Plant • 30 mmcf/d (97%) 16‐14 LRE Compressor Station • 20 mmcf/d (100%) Edson Talisman Gas Plant • 400 mmcf/d (2.7% LRE WI) LRE Land Production 8,000 6,000 4,000 2,000 34% 32% 2012 2013 34% LRE Wells Recent LRE HZ Wells 0 30% 28% 2010 2011 Oil + NGLs Natural Gas 2014 (8 months) 16 DEEP BASIN CARDIUM Kakwa/Wapiti • Cardium horizontal liquids‐rich natural gas • 1,000m ‐ 1,600m vertical depth • October 2014 estimated production of 3,950 Boe/d (30% liquids) • NGL content of 40‐50 Bbl/Mmcf • First four wells have been successfully completed with initial results exceeding type curve expectations Wapiti Production Kakwa LRE Land LRE Wells Recent LRE HZ Wells Average Production (Boe/d) 6,000 4,000 2,000 28% 29% 28% 28% 2011 2012 2013 2014 (8 months) 31% 0 2010 Oil + NGLs Natural Gas 17 REDWATER VIKING 07‐21 Redwater North Oil Battery • 5,000 bbls/d • 4.0 mmcf/d T58 Redwater 05‐17 Redwater North Compressor Station • 4.5 mmcf/d 06‐11 Eastgate Gas Plant • 1.0 mmcf/d T56 05‐04 Redwater Central Oil Battery • 3,000 bbls/d • 1.0 mmcf/d 15‐07 Bruderheim North Oil Battery • 2,000 bbls/d • 500 mcf/d 15‐24 Bruderheim South Oil Battery • 3,000 bbls/d • 2.0 mmcf/d 6,000 Production 5,000 R21 LRE Land R19W4 LRE Viking HZ Oil Wells Average Production (Boe/d) 03‐31 Redwater Central Oil Battery • 2,000 bbls/d • 1.0 mmcf/d • Viking horizontal oil development • 700m vertical depth • October 2014 estimated production of 4,700 Boe/d (85% liquids) • Light oil (38o API) • Key infrastructure in place • EOR commenced 4,000 3,000 89% 2,000 88% 86% 87% 1,000 79% 0 2010 2011 Oil 2012 Natural Gas 2013 2014 (8 months) 18 ENHANCED OIL RECOVERY Redwater Viking Property • Good waterflood candidate for pressure support: • Large oil in place reservoir • Good rock permeability of 10 ‐ 20 md • Relatively uniform vertical and lateral rock properties Redwater • Initial pilot EOR project encompasses 0.5 sections in the north part of the field • Includes three horizontal injection wells and five producer wells • Second EOR pilot in the south part of the trend began in December 2014 and covers 0.625 sections • Includes two horizontal injection wells, six horizontal producer wells and six vertical producers LRE Land LRE Viking HZ Oil Wells Potential EOR Expansion Phase 1 • Potential to improve recovery by an additional 10 ‐ 12% depending on waterflood pattern/success 19 NORTHERN GAS Boyer • Bluesky natural gas • 200m ‐ 500m vertical depth • October 2014 estimated production of 2,900 Boe/d (100% natural gas) • Shallow decline (8%/year) • 690,000 net acres • Current drilling density less than 1.5 wells per section under vertical development. Potential exists for horizontal development • 70 MMcf/d of additional operated processing capacity available Average Production (Boe/d) 5,000 LRE Land Production 4,000 3,000 2,000 1,000 LRE Wells 0 2010 2011 2012 Natural Gas 2013 2014 (8 months) 20 LONG RUN KEY VALUE DRIVERS • Deliver a focused capital program targeting total corporate sustainability ratio of 100% or less • Continue to exploit our balanced portfolio of properties through development, enhanced recovery and exploration • Provide long‐term value to shareholders through capital discipline and operational execution 21 SUPPLEMENTAL INFORMATION 22 ENHANCED OIL RECOVERY (EOR) Waterflood Current Waterflood Pilots • Major oil projects under early stage waterflood Area Formation Pilot Start Date Expansion Start Date # of Injectors Normandville Montney May 1, 2013 December 8, 2014 9 This initial phase of EOR covers five sections Girouxville Montney October 24, 2013 January 2015 4 This initial phase of EOR covers 1.5 sections Redwater Viking December 9, 2013 December 8, 2014 5 Comments Expansion consists of a second pilot in the southern portion of the Redwater field • Cost effective reserve additions • Increases recovery • Lowers finding & development costs • Uses existing land base • Moderates production declines • Stabilizes production rates • Source of free funds flow 23 Natural Gas Crude Oil RISK MANAGEMENT Costless Collars Volume Pricing January 1, 2015 – December 31, 2015 2,500 Bbl/day WTI US $95.00 ‐ $97.50/ Bbl Fixed Price Volume Pricing January 1, 2015 – April 30, 2015 1,000 Bbl/d WTI US $85.00/Bbl January 1, 2015 – April 30, 2015 1,000 Bbl/d WTI US $90.00/Bbl Calls Volume Pricing January 1, 2015 – December 31, 2015 500 Bbl/d WTI US $85.00/Bbl Costless Collars Volume Pricing January 1, 2015– March 31, 2015 13,000 GJ/day CDN $3.50‐$3.75/GJ January 1, 2015 – December 31, 2015 5,000 GJ/day CDN $4.00‐$4.50/GJ January 1, 2015 – December 31, 2015 5,000 GJ/day CDN $4.00‐$4.51/GJ January 1, 2015 – December 31, 2015 20,000 GJ/day CDN $3.50‐$4.00/GJ January 1, 2015 – December 31, 2015 11,000 GJ/day CDN $3.50‐$4.35/GJ • Financial hedges mitigate risk associated with commodity price volatility • Improves predictability of funds flow • Current oil production hedges: • ~50% hedged for Q1 2015 • ~40% hedged for full year 2015 • Current natural gas production hedges: • ~45% hedged Q1 2015 • ~40% hedged for full year 2015 24 NETBACKS BY AREA Peace River Area Deep Basin Area Redwater Area 13,850 11,150 8,200 2,900 38,250 % Liquids 55% 30% 60% ‐ 45% Oil Quality 28° API 42° API 38° API ‐ 32° API October 2014 Estimated Production Northern Gas Total (Boe/d) September Field Netback ($/Boe)(1) Price ($/Mcf) $ 54.82 $ 34.18 $ 63.41 $ 23.00 $ 3.83 $49.81 (6.72) (4.29) (7.52) (0.71) (0.12) (5.96) Operating Costs (15.44) (6.68) (12.16) (7.36) (1.23) (12.83) Transportation (2.70) (1.22) (1.74) (2.24) (0.37) (1.94) $ 29.96 $ 21.99 $ 41.99 $ 12.69 $ 2.11 $ 29.08(1)(2) Royalty 1) See “Netbacks” under the Advisories 2) Excluding realized financial hedging gains/losses 25 TAX POOLS Tax Pools Annual Deduction $ Millions Up to approximately 25% $370 Canadian Oil & Gas Property Expense (COGPE) Up to 10% $440 Canadian Development Expense (CDE) Up to 30% $630 Up to 100% $150 Deducted against taxable income $250 Undepreciated Capital Cost (UCC) Canadian Exploration Expense (CEE) Non‐Capital Loss Carry Forward Estimated Total Corporate Tax Pools (at September 30, 2014) $1,840 26 BANK SYNDICATE Bank of Nova Scotia National Bank of Canada The Toronto‐Dominion Bank HSBC Bank Canada Wells Fargo Bank, N.A., Canadian Branch Canadian Imperial Bank of Commerce Alberta Treasury Branches Union Bank, Canada Branch United Overseas Bank Limited Bank of Montreal Business Development Bank of Canada 27 CORPORATE INFORMATION TSX:LRE Contacts Bill Andrew Chair & CEO (403) 261‐6012 Dale Miller President & COO (403) 261‐6012 Corine Bushfield Senior Vice President & CFO (403) 261‐6012 Dale Orton Senior Vice President, Development (403) 261‐6012 Lauren Kimak Investor Relations (403) 716‐3222 1‐888‐598‐1330 Main: Toll‐Free Investor Line: Email: Web: 403‐261‐6012 1‐888‐598‐1330 [email protected] www.longrunexploration.com 28 ADVISORIES Forward Looking Statements: This document contains forward‐looking statements and forward‐looking information (collectively "forward‐looking information") within the meaning of applicable securities laws relating to the Company's plans and other aspects of Long Run's anticipated future operations, management focus, objectives, corporate strategies and business plan, financial, operating and production results and opportunities including 2015 guidance including average production, commodity mix, funds flow from operations, total dividends and dividends per share (annual), basic payout ratio and total sustainability ratio; and assumptions relating to such guidance, including 2015 average operating costs and general and administrative costs; expectation that corporate decline rate will reduce during 2015; plans to divest up to 4,000 Boe/d; plans to institute a dividend reinvestment plan and the timing thereof; estimated results of development plan for 2015, including anticipated initial production rates, commodity mix, 12‐month capital efficiencies, and estimated ultimate recovery; 2015 forecast sensitivities; and timing of the commencement of various enhanced oil recovery operations and the anticipated impact on operations. Forward‐looking information typically uses words such as "anticipate", "believe", "project", "expect", "goal", "plan", "intend" or similar words suggesting future outcomes, statements that actions, events or conditions "may", "would", "could" or "will" be taken or occur in the future. The forward‐looking information is based on certain key expectations and assumptions made by Long Run's management, including expectations and assumptions concerning prevailing commodity prices, exchange rates, interest rates, applicable royalty rates and tax laws; future production rates and estimates of operating costs; performance of existing and future wells; reserve and resource volumes; anticipated timing and results of capital expenditures; the success obtained in drilling new wells; the sufficiency of budgeted capital expenditures in carrying out planned activities; the timing, location and extent of future drilling operations; the state of the economy and the exploration and production business; results of operations; performance; business prospects and opportunities; the availability and cost of financing, labor and services; the impact of increasing competition; ability to market oil and natural gas successfully; and Long Run's ability to access capital. Although the Company believes that the expectations and assumptions on which such forward‐looking information is based are reasonable, undue reliance should not be placed on the forward‐looking information because Long Run can give no assurance that they will prove to be correct. Since forward‐looking information addresses future events and conditions, by its very nature they involve inherent risks and uncertainties. The Company's actual results, performance or achievement could differ materially from those expressed in, or implied by, the forward‐looking information and, accordingly, no assurance can be given that any of the events anticipated by the forward‐looking information will transpire or occur, or if any of them do so, what benefits that the Company will derive there from. Management has included the above summary of assumptions and risks related to forward‐looking information provided in this corporate presentation in order to provide shareholders and potential investors with a more complete perspective on Long Run's future operations and such information may not be appropriate for other purposes. Readers are cautioned that the foregoing lists of risks and factors are not exhaustive. Additional information on these and other factors that could affect our operations or financial results are included in reports on file with applicable securities regulatory authorities and may be accessed through the SEDAR website (www.sedar.com). Included herein are estimates of Long Run's 2015 funds flow from operations, total dividends and total dividends per share, basic payout ratio and total sustainability ratio based on assumptions provided herein and other assumptions utilized in arriving at Long Run's capital budget. To the extent such estimates constitute a financial outlook, they were approved by management on December 15, 2014 and are included herein to provide readers with an understanding of the effects of the anticipated funds available to Long Run to fund its capital expenditures, dividends and the effects thereof and readers are cautioned that the information may not be appropriate for other purposes. 29 ADVISORIES Statements relating to "reserves" are also deemed to be forward looking statements, as they involve the implied assessment, based on certain estimates and assumptions, that the reserves described exist in the quantities predicted or estimated and that the reserves can be profitably produced in the future. Actual reserve values may be greater than or less than the estimates provided herein. These forward‐looking statements are made as of the date of this document and Long Run disclaims any intent or obligation to update publicly any forward‐ looking information, whether as a result of new information, future events or results or otherwise, other than as required by applicable securities laws. BOE: "Boe" means barrel of oil equivalent on the basis of 6 mcf of natural gas to 1 bbl of oil. Boe's may be misleading, particularly if used in isolation. A boe conversion ratio of 6 mcf: 1 bbl is based on an energy equivalency conversion method primarily applicable at the burner tip and does not represent a value equivalency at the wellhead. Given the value ratio based on the current price of crude oil as compared to natural gas is significantly different from the energy equivalency of 6 Mcf: 1 Bbl, utilizing a conversion ratio at 6 mcf: 1 Bbl may be misleading as an indication of value. Initial Production Rates and Type Curves: Initial production rates disclosed herein may not necessarily be indicative of long‐term performance or ultimate recovery. Type curves presented herein are not necessarily reflective of the performance of future wells. Dividends: The payment and the amount of dividends declared in any month is subject to the discretion of the board of directors of the Company and will depend on the board of director's assessment of Long Run's outlook for growth, capital expenditure requirements, funds from operation, potential acquisition opportunities, debt position and other conditions that the board of directors may consider relevant at such future time. The amount of future cash dividends, if any, may also vary depending on a variety of factors, including fluctuations in commodity prices. Non‐GAAP Measures: This document contains terms commonly used in the oil and gas industry, such as funds flow from operations, basic payout ratio and total sustainability ratio. These terms are not defined by International Financial Reporting Standards (IFRS) and should not be considered an alternative to, or more meaningful than, cash provided by operating activities or net earnings as determined in accordance with IFRS as an indicator of Long Run's performance. These measures are commonly used in the oil and gas industry and by Long Run to provide shareholders and potential investors with additional information regarding the Company’s liquidity and its ability to generate funds to finance its operations. Long Run's determination of these measures may not be comparable to that reported by other companies. Funds flow from operations is calculated as cash flow from operating activities before changes in non‐ cash working capital and abandonment expenditures. Basic payout ratio is calculated by dividing dividends by funds flow from operations. Total sustainability ratio is defined as net capital expenditures plus dividends divided by funds flow from operations. Long Run has provided information on how these measures are calculated in the Management’s Discussion and Analysis for the three and nine months ended September 30, 2014 dated November 5, 2014, which is available under the Company’s SEDAR profile at www.sedar.com. 30
© Copyright 2026 ExpyDoc