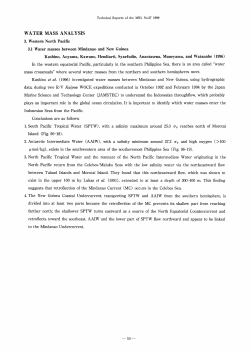
Presented at the DLSU Research Congress 2014
De La Salle University, Manila, Philippines
March 6-8, 2014
Design Considerations for a Visualization and Simulation Tool for
CBMS Data
Nelson Marcos1,*, Gerardo Largoza2, Briane Paul Samson3,
Johnn Jelvin S. Base4, Lawrence Patrick C. Calulo5, Bervyn S. Co6, Charles Geoffrey R. Lo7
College of Computer Studies, De La Salle University
2 School of Economics, De La Salle University
3 College of Computer Studies, De La Salle University
4,5,6,7 College of Computer Studies, De La Salle University
*[email protected]
1
Abstract: A visualization and simulation tool for a community-based dataset from
Angelo King Institute (AKI) called Community-Based Monitoring System (CBMS) is
designed. Currently, there is no local visualization and simulation tool for CBMS
data. The data in the CBMS dataset is mainly categorized into eight indicators
considered to be the basic needs of a local government unit. These are health,
nutrition, housing, water and sanitation, education, income, employment, and peace
and order. This research is useful for government officials, and local communities in
creating or formulating policies. This tool is developed to give policymakers and
program implementors necessary information to study the effect of macroeconomic
reforms and different kinds of policy shocks. The application is designed to be webbased. It allows users to extract data from the CBMS dataset, to visualize the data
with the use of maps (over Google Maps) and charts to provide a more accessible
summary of the conditions inside a community, and simulate the effects on the data
given parameters that can be adjusted to have a view of what might be the outcome
of a given scenario for both economical researcher and non-economical researcher to
give them a better view of data. Through the results based on economic computations
performed on the data, this can help the government units in deciding what policies
to implement in a certain community. By implementing agile development
methodology, initial design and prototype of the application has been done. The
prototype allows users to select fields and ranges of values to visualize and simulate.
Careful design and presentation of information is necessary so that it is easy to
comprehend. A menu of simulation parameters will be built into the software. These
parameters will be curated based on the most recent and relevant to the data
available, and may be updated.
Key Words: visualization, simulation, big data, statistics, economics
1
WCF-006
Presented at the DLSU Research Congress 2014
De La Salle University, Manila, Philippines
March 6-8, 2014
1. INTRODUCTION
Visualization and simulation has now
showed its importance especially with regards to
data analytics and processing datasets. Considering
the capabilities of current technology, visualizing and
simulating big data has evolved from the traditional
Command Line Interface (CLI) to the modern
Graphical User Interface (GUI). Visualizing data and
converting it into graphics while being able to
manipulate and simulate it can aid data analytics in
a fast and productive way.
There are ways to visualize and simulate
data such as using software like IBM Cognos, a Webbased suite by IBM (2012). Another demonstration of
visualizing and simulating big data in the field of
economics is Outline (Bier et al., 2013a). It aims to
provide a platform for open policymaking by allowing
users to interact with a simulation of the US
economy and observe the effects of creating and
modifying policies (Bier et al., 2013b).
The main goal of the research is to visualize
and simulate generic datasets based on the needs of
researchers
or
end-users,
primarily
using
Community-Based Monitoring System (CBMS).
CBMS is the first way of collecting and processing
information about the development and current
status of the households (Reyes and Valencia, 2009)
in the Philippines. In cities or provinces, CBMS is
used as a tool to gauge the poverty level (Reyes and
Valencia, 2009).
CBMS also aims to provide assistance to its
members in order for them to develop. This tool is
developed to give policymakers the necessary
information to study the effect of macroeconomic
reforms and different kinds of policy shocks (DILG
Region VI, 2010).
The data that can be generated by CBMS is
categorized into 8 indicators, which are considered to
be the basic needs of a local government unit. These
criteria are: health, nutrition, housing, water and
sanitation, education, income, employment, and
peace and order. Other information may include, but
are not limited to, migration of families,
community/political participation and access to
government programs.
With the availability of the CBMS, it is no
surprise that other research efforts have been
conducted in the field of poverty reduction. One such
example is Tan (2010), which discusses the use of
regression modeling and spatial analysis in order to
simulate strategies on reducing poverty in a
community. CBMS and the Statistical Package for
the Social Sciences (SPSS) were used. SPSS was used
to generate poverty models. CBMS data were then
fed to these models.
CBMS is only a method for collecting and
processing current household data and its
development (Reyes and Valencia, 2009). Because of
the unavailability of a modern way of processing and
viewing of these data, the motive of the research is to
provide a visualization and simulation application of
this dataset.
2. METHODOLOGY
The
project
started
with
several
brainstorming and consultations among the team
members. The DLSU College of Computer Studies
(CCS) proponents also consulted the DLSU School of
Economics (SOE) and the DLSU Angelo King
Institute Community-Based Monitoring System (AKI
CBMS) to provide proper direction to the project.
Studies of related literature were conducted in
parallel to the consultations to further solidify the
ideas presented and discussed in the meetings.
From the consultations and meetings,
requirements specification for the system was
established. In this phase, the exact requirements of
the software as well as the target users for the
system were determined.
Initial data gathering from DLSU AKI
CBMS was done since poverty-related data is needed
in the project. The survey questionnaire used by
DLSU AKI CBMS shows that the system will be
dealing with big data.
Initial design of the system was created.
Initial prototyping was also done. An agile
methodology, specifically, Scrum, is used in
developing the system, to allow for the rapid
integration of expert feedback received during
consultations and meetings.
3. INITIAL DESIGN
The system is designed to be composed of
three major modules, each providing one category of
functionality required by the system. This is shown
2
WCF-006
Presented at the DLSU Research Congress 2014
De La Salle University, Manila, Philippines
March 6-8, 2014
For the dataset management module, the
prototyping of five major functionalities are
presented here.
First is field editing. Fields can be edited to
have an informative name and unit of measurement.
These make fields more distinguishable during data
extraction. A sample screen shot is shown in Fig. 2.
Second is filtering. Datasets can be filtered
by specifying one or more conditions or criteria that
the can specificy. Only the records or data set values
that satisfy these conditions are displayed. A sample
screen shot is shown in Fig. 3.
in Fig. 1. The three major modules are: dataset
management module, visualization module, and
simulation module.
The dataset management module handles
the import, storage, and querying of datasets to be
used in the system. This module is primarily based
on a server, with a comparatively small management
interface in the client side. In this module, a user can
upload datasets, view datasets, assign labels to a
field in the dataset, filter datasets, among others.
Fig. 1. System Modules
The visualization module is responsible for
the display of datasets as visualizations. Through
this module, the user can select from a list of
datasets, visualize data in chart form, visualize data
in map form, among others.
The simulation module works alongside the
visualization module, and works with it to perform
calculations on the records of a dataset. Through this
module, the user can view a list of available
simulations, run simulations, and see simulation
results as visualizations.
4. INTIAL RESULTS
Initial prototyping of the system has been
done and results are presented in this section.
Fig. 2. Field Editing
Fig. 3. Filtering
Third is the provision of layers. Layers are a
way of organizing multiple fields of a dataset based
on their meaning, purpose, or other factors decided
by the user, and act as folders grouping fields
together. For convenience, all fields in a dataset may
be selected in bulk, placing all of its data for viewing
3
WCF-006
Presented at the DLSU Research Congress 2014
De La Salle University, Manila, Philippines
March 6-8, 2014
in the data extraction screen's table. A sample screen
shot is shown in Fig. 4.
Fig. 4. Layer Provisions
Fourth is pagination. The system is expected
to work with large datasets. Such data, which can
have sizes exceeding thousands of records, will be
cumbersome to view as a whole. Pagination allows
datasets to be viewed in small increments. A sample
screen shot is shown in Fig. 5.
Fig. 5. Pagination
Fifth is uploading. The system can read
datasets regardless of the number of fields, their
type, or their ordering. This functionality does not
require user intervention at upload time. The system
is capable of storing and retrieving these for display
on its own. A sample screen shot is shown in Fig. 6.
Fig. 6. Uploading datasets
The succeeding screenshots presents the
initial prototyping of the visualization module. Fig. 7
4
WCF-006
Presented at the DLSU Research Congress 2014
De La Salle University, Manila, Philippines
March 6-8, 2014
to Fig. 10 show the various non-map visualizations
that the system can automatically generate given a
user selected field. These are the bar chart,
histogram, line chart, and pie chart.
Fig. 7. Sample Bar Chart
Fig. 8. Sample Histogram
Fig. 9. Sample Line Chart
of blue. Another example is bar charts are normally
used for discrete data or categories while histogram
are better used for continuous data. For pie charts,
only a maximum of 8 divisions or slices is
recommended.
When a user selects a field, the non-map
visualizations are placed as cards on a panel as
shown in Fig 11. The user can zoom into a selected
chart as shown in Fig. 12.
Fig. 10. Sample Pie Chart
Guidelines and standards in producing
charts were applied and implemented in the system
to properly produce the charts. For example, the
standard color normally used for graphs are shades
Fig.
11.
5
WCF-006
Presented at the DLSU Research Congress 2014
De La Salle University, Manila, Philippines
March 6-8, 2014
Sample Chart Panel
Fig. 13 and Fig. 14 show two different layers
of maps namely education layer and water and
sanitation layer.
Fig. 13. Education Layer Map
Fig. 14. Water and Sanitation Layer Map
Fig. 15 shows another sample map screen
shot where the size of the circles representing
households varies depending on the number of
children in the household.
Fig. 15. Map Showing Varying Household Sizes
A sample screen shot for the simulation
module is shown in Fig. 16. Here, the user can
change the values of the parameters and see the
effects on the map.
Fig. 12. Sample Panel with a Zoomed Chart
Aside from chart-based visualizations, the
user is provided with map-based visualizations.
Google Maps is used for the geographic map,
allowing users to zoom in or out, and pan around the
map, as one would expect with Google's mapping
tool.
User interactions for selecting datasets and
fields are handled, as well as rendering with Google
Maps.
6
WCF-006
Presented at the DLSU Research Congress 2014
De La Salle University, Manila, Philippines
March 6-8, 2014
IBM (2012). IBM { Cognos Software. Retrieved
October 3, 2013 from http://www-01.ibm.com/software/ph/analytics/cognos/.
Kosslyn, S. (1994). Elements of Graph Design (2nd
Ed). New york City, USA: W. H. Freeman and
Company.
Fig. 16. Sample Simulation Screen Shot
5. CONCLUSION
An initial prototype has been made.
However, continuous consultations with DLSU AKI
CMBS and SOE will be done to refine the prototype
and consider other factors in the design of the
visualization and simulation modules which are the
major parts of the system. The system also has to be
populated with large data sets to ensure that the
system will be able to handle such big data.
6. ACKNOWLEDGMENTS
Krug, S. (2000). Don’t Make Me Think: A Common
Sense Approach to Web Usability (2nd Ed). USA:
New Riders Publishing.
Reyes, C. M. and Valencia, L. E. (2009). Poverty
Reduction Strategy and Poverty Monitoring:
Philippine Case Study. Retrieved February 14,
2010 from
http://siteresources.worldbank.org/INTPAME/Re
sources/Country
studies/philippinespovmonitoringcasestudy.pdf.
Tan, K. (2010). Simulating Poverty Reduction
Strategy with the use of Regression Modeling
and Spatial Analysis (Master's thesis).
The proponents would like to acknowledge
the assistance of the DLSU AKI CBMS for
providing assistance in terms of data sets and
references, and DLSU URCO for providing funding
for the project.
7. REFERENCES
Bier et al. (2013a). Outline | The Platform for Digital
Government. Retrieved June 25, 2013 from
http://outline.com/.
Bier et al. (2013b). Outline: The Platform for Digital
Government has Arrived. Speech given at
Boston, MA.
DILG Region VI (2010). Community-Based
Monitoring System (CBMS). Retrieved June 25,
2013 from
http://www.lgrrc6.org.ph/index.php?option=com
content&view=article&id=113&Itemid=2.
7
WCF-006
© Copyright 2026 ExpyDoc