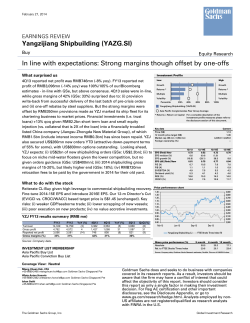
February 26, 2014
Issue No: 14/08
Global Economics Weekly
Economics Research
Ninety years of perspective on corporate credit spreads
Are credit spreads too low?
Dominic Wilson
After five years of spread tightening, concerns have begun to arise about
potential overheating in credit markets. But how can we tell if credit
spreads are too low?
(212) 902-5924 [email protected]
Goldman, Sachs & Co.
Kamakshya Trivedi
+44(20)7051-4005 [email protected]
Goldman Sachs International
We look at 90 years of data
We combine data from several sources to estimate a time series of 10-year
US BBB-rated industrial corporate bond spreads starting in 1920. Today’s
spreads are somewhat above their historical median, meaning that spreads
have spent more than half of the last 90 years below their current level. We
also use data on corporate bond defaults since 1866 and leverage metrics
since 1929 to construct estimates of historical credit loss rates, and we
decompose spread levels into expected losses and the credit risk premium.
We find that the credit risk premium is also still above its historical median.
Noah Weisberger
(212) 357-6261 [email protected]
Goldman, Sachs & Co.
Aleksandar Timcenko
(212) 357-7628 [email protected]
Goldman, Sachs & Co.
Jose Ursua
(212) 357-2234 [email protected]
Goldman, Sachs & Co.
And we still expect spreads to grind tighter
Our macroeconomic outlook calls for some acceleration in growth, with
low inflation and low volatility. We expect this environment to produce low
levels of defaults and continuing compression in the credit risk premium.
We therefore expect corporate credit spreads to continue their grind tighter
in both the US and Europe, and for both investment grade and high yield.
Jesse Edgerton
(212) 357-5522 [email protected]
Goldman, Sachs & Co.
George Cole
+44(20)7552-3779 [email protected]
Goldman Sachs International
Current corporate spread levels are above their median since 1920
Julian Richers
Estimated 10-year BBB Industrial spread to Treasury
(212) 855-0684 [email protected]
Goldman, Sachs & Co.
8
Estimated 10-yr BBB Industrials spread
75th percentile
Median
6
25th percentile
All-time tight
4
2
0
1920
1932
1944
1956
1968
1980
1992
2004
Source: Moody’s, S&P, Haver Analytics, Goldman Sachs Global Investment Research.
Investors should consider this report as only a single factor in making their investment decision. For Reg AC certification
and other important disclosures, see the Disclosure Appendix, or go to www.gs.com/research/hedge.html.
The Goldman Sachs Group, Inc.
Global Investment Research
February 26, 2014
Global Economics Weekly
Ninety years of perspective on corporate credit spreads
Since the peak of the Great Financial Crisis, corporate credit spreads have fallen
dramatically. The option-adjusted spread on the Merrill Lynch US High Yield Index has
fallen from a peak of more than 20 percentage points (2000 basis points) just over five
years ago to under 400 basis points today. Spreads in the US and European iBoxx
investment grade indexes have fallen from around 500 basis points during the crisis to 125
basis points today. These new low levels of spreads have created concerns in some
quarters about overheating in credit markets.
But how can we tell whether spreads are too low? Should we expect them to rise from
here? In this Weekly, we examine data back to 1920 to provide a long historical perspective
on the risk premium embedded in corporate credit spreads. We conclude that history
suggests that risk premia can indeed compress further from here, and we reiterate our
baseline forecasts for a further grind tighter in spreads as the economy improves.
The history of spreads
To put current spread levels in historical perspective, we combine data from several
sources to construct a series of corporate spreads that holds constant rating and maturity,
but dates back to 1920, before most index data begin. We use Moody's long-dated Baa
yields, S&P 10- and 15-year BBB industrial yields, 10-year US Treasury yields and the shape
of the yield curve to estimate a time series of 10-year BBB US industrial spreads. Our
method has its shortcomings, but we think it provides a useful perspective on spreads over
the broad sweep of history.
Exhibit 1 suggests that today’s spreads are still somewhat above their median level since
1920. That is, over the past 90 years, spreads on corporate bonds of comparable rating and
maturity have spent about half of the time above their current level and half the time below.
Notably, spreads spent most of the decades from the 1940s to the 1960s far below their
current levels. Although spreads have been higher in recent decades, they stayed well
below current levels for several years at a time in the late 1970s, early 1980s, late 1990s and
mid-2000s. Thus, a casual look at the spread data suggests that there is room for spreads
to fall further and remain there for some time.
Exhibit 1: Current corporate spread levels are above their median since 1920
Estimated 10-year BBB Industrial spread to Treasury
8
Estimated 10-yr BBB Industrials spread
75th percentile
Median
6
25th percentile
All-time tight
4
2
0
1920
1932
1944
1956
1968
1980
1992
2004
Source: Moody’s, S&P, Haver Analytics, Goldman Sachs Global Investment Research.
Goldman Sachs Global Investment Research
2
February 26, 2014
Global Economics Weekly
A sceptic could argue, however, that the recent low spread episodes featured bubbly
financial markets that sowed the seeds of their own demise in the dotcom bust and Great
Financial Crisis. If markets have learned that these spread levels were too low, perhaps we
are unlikely to see them return. To evaluate these arguments more carefully, we
decompose spreads into two components—expected credit losses and the credit risk
premium—and discuss each piece in more detail.
From spreads to credit risk premia
Corporate credit spreads must compensate bondholders for the expected level of credit
losses they will suffer from corporate defaults. Roughly, if a risk-free government bond
maturing in one year promises a yield of 2%, a corporate bond with a 2% probability of
default and a 50% expected loss-given-default must promise a yield of at least 3% (2 +
2*0.5) for an investor to expect the same return from both bonds.
In fact, corporate bonds pay considerably higher yields than necessary to compensate
merely for the expected level of losses, because spreads also embed compensation for risks
that corporate investors take. For example, we recently discussed the illiquidity premium,
which compensates investors for taking the risks associated with holding less liquid bonds
that they may not be able to sell easily in times of distress (see “Liquidity premia have
compressed, but opportunity remains”, The Credit Line, February 5, 2014).
But the most prominent risk faced by corporate bond investors is default risk. Risk-averse
investors would rather have the ‘sure thing’ of a riskless 2% return on the government
bond than the expected—but still risky—2% return on the corporate bond in the example
above. Thus, the corporate bond must promise a yield of more than 3% for investors to be
willing to take this risk. We call the spread paid by corporate bonds over and above the
expected loss rate the ‘credit risk premium’. (Note that what we call the credit risk premium
here also includes any other corporate-specific premia, such as a liquidity premium.)
We normally use the last few decades of spread and default data to forecast losses and
estimate a credit risk premium broken out by rating bucket (see “Tracking risk premia in
credit markets”, Global Economics Paper No. 222, November 1, 2013). But a crude estimate
of the credit risk premium can be constructed by simply subtracting an annualised loss
forecast from the credit spread. Suppose our example corporate bond promised a yield of
5%, or a spread of 3 percentage points over the government bond yielding 2%. Because we
expect losses on the corporate bond of 1%, we can roughly decompose the spread into 1
percentage point of expected loss and 2 percentage points of credit risk premium.
Defaults, leverage and the business cycle
Armed with this simple framework, we combine our spread data from Exhibit 1 with
forecasts of expected losses to construct a crude measure of the credit risk premium over a
much longer history than we can normally study. To predict the losses expected at each
point in history, we use the long history default, leverage and business cycle data that we
assembled in a recent Credit Line, “Corporate default rates: Lessons from history”,
(February 19, 2014).
Exhibit 2 presents data on corporate bond default rates dating back to 1866. These data
were assembled by academic researchers in a 2011 paper (see Giesecke, Longstaff,
Schaefer and Strebulaev, “Corporate bond default risk: a 150-year perspective,” Journal of
Financial Economics, November 2011.) Their figures attempt to measure a par-valueweighted annual default rate for all US nonfinancial corporate bonds, combining both
investment grade and high yield issuers.
Goldman Sachs Global Investment Research
3
February 26, 2014
Global Economics Weekly
Exhibit 2: Average corporate default rates have varied widely across historical eras
Par-value-weighted annual default rate for US nonfinancial corporate bond issuers (investment
grade and high yield combined)
18%
16%
14%
12%
1866 to 1899
Avg: 4.0%
10%
8%
1900 to 1930 Avg:
1.1%
6%
1931 to 1940
Avg: 2.7%
1985 to 2012
Avg: 0.7%
1941 to 1984
Avg: 0.1%
4%
2%
0%
1866
1886
1906
1926
1946
1966
1986
2006
Source: Giesecke, Longstaff, Schaefer, and Strebulaev (2011), Goldman Sachs Global Investment Research.
Of course, data from 1866 can play only a limited role in informing our views for 2014 and
beyond. Nonetheless, we think there is value in the big-picture perspective provided by
these data. In particular, they emphasise the point that the definition of ‘normal’ default
rates has changed dramatically over time.
For example, the banking and railroad crises of the late 1800s kept defaults at a striking 4%
average annual rate, before a relative lull at 1.1% in the early 1900s. During the 1930s, the
Great Depression drove average defaults back up. Then, for a 44-year period from 1941 to
1984, corporate bond default rates were stuck virtually at zero. Beginning in the mid-1980s,
the rise of the modern high yield market helped bring average default rates to around 0.7%.
Exhibit 3: Business cycles drive defaults, except in the
early post-war period
Exhibit 4: The post-war zero-default period was a time of
very low leverage
Default rate from Giesecke et al. (2011) and real GDP growth
Default rate from Giesecke et al. (2011) and prior-year
aggregate nonfinancial corporate interest coverage ratio
8%
%
Real GDP growth (RHS)
25
20
7%
15
6%
5%
10
5%
4%
5
4%
3%
0
3%
2%
-5
2%
1%
-10
1%
7%
6%
Default rate (LHS)
60
8%
Default rate (LHS)
Ratio
EBITDA/Interest ratio (RHS)
50
40
30
20
10
-15
0%
1902 1913 1924 1935 1946 1957 1968 1979 1990 2001 2012
0%
0
1930 1939 1948 1957 1966 1975 1984 1993 2002 2011
Source: Giesecke et al. (2011), Bureau of Economic Analysis, Goldman Sachs
Global Investment Research.
Source: Giesecke et al. (2011), Bureau of Economic Analysis, Goldman Sachs
Global Investment Research.
Goldman Sachs Global Investment Research
4
February 26, 2014
Global Economics Weekly
To predict the expected credit losses that we will assume in estimating the credit risk
premium, we build a model that predicts defaults based on their underlying drivers. We
typically focus on two drivers of defaults—the business cycle and credit quality. Exhibit 3
provides a longer perspective on the relationship between defaults and the business cycle
by plotting the default rate data from Exhibit 2 against the growth rate of real GDP in the
National Income and Product Accounts (NIPA) since 1902. The two series are clearly related.
The economic downturns in 1904, 1908, 1914, the 1930s, 1991, 2001 and 2009 are all
accompanied by a spike in the default rate. However, there were also many downturns in
the 1941-1984 period, some of them severe, which failed to induce any notable defaults.
We suspect that the underlying credit quality of bond issuers explains most of the
difference between the 1941-1984 period and the rest of the data. (Additional features of
the legal and institutional environment, such as changes in bankruptcy law, might also
have played a role; see Giesecke et al. (2011) for more). Exhibit 4 graphs the default rate
series against an aggregate interest coverage ratio constructed from the NIPA since 1929.
The ratio intends to approximate the ratio of EBITDA to net interest payments for the same
set of US nonfinancial corporations covered by the default rate data, although it is not
limited to bond issuers. The exhibit plots the default rate in a given year against the
interest coverage ratio measured in the prior year.
There is a clear inverse relationship between defaults and this coverage ratio. The ratio was
below 10 during the high-default eras of the 1930s and most of the past 30 years, whereas
it rose to much higher levels during the no-default era between 1940 and 1970. We have
also constructed balance-sheet-based leverage metrics such as debt/assets and
liabilities/assets that further corroborate the claim that leverage has risen substantially
between the 1940s and today.
Exhibit 5: When leverage was at its lowest, defaults stayed near zero, even during
recessions; with leverage now at higher levels, the business cycle drives defaults
Relationship between defaults and nominal GDP growth, broken out by leverage buckets
3.5%
Highest leverage years, R2=0.55
Corporate default rate
3.0%
Higher leverage years, R2=0.38
2002
Lower leverage years, R2=0.18
2.5%
Lowest leverage years, R2=0.00
2009
2.0%
2001
1.5%
1990
1.0%
0.5%
0.0%
-4
0
4
8
Nominal GDP growth rate
12
16
Source: Giesecke et al. (2011), Bureau of Economic Analysis, Goldman Sachs Global Investment Research.
Goldman Sachs Global Investment Research
5
February 26, 2014
Global Economics Weekly
Exhibit 5 combines the business cycle and leverage data to quantify their relative roles in
driving defaults in the post-war era. We divide the post-war data into four buckets based on
the interest coverage ratio shown in Exhibit 4, and then estimate the relationship between
defaults and the business cycle within these leverage bins. That is, the grey dots in Exhibit
5 represent all of the years in the sample that fall in the highest leverage (lowest interest
coverage) quarter of the sample, and the grey line estimates the relationship between
defaults and the business cycle within this sample of high-leverage years. The lightest blue
dots and line do the same for the lowest-leverage years, and the other two lines for the
buckets in between.
The message from Exhibit 5 is clear: leverage matters a great deal in determining both the
level of defaults and their interaction with the business cycle. That is, the level of the
higher-leverage lines is higher than that of the lower-leverage lines, for all but the very
fastest, double-digit GDP growth rates. The slope of the higher-leverage lines is also much
steeper. When leverage is low, as it was in the 1940s, the business cycle has little effect on
defaults, because they are essentially pinned at zero. However, when leverage is
historically high, as it has been for the past few decades, defaults become increasingly
sensitive to GDP growth.
We draw two primary conclusions from the results on defaults in Exhibit 5. First, the early
post-war era of near-zero defaults is unlikely to return. That era was characterised by what
now look like extremely low levels of leverage that we are unlikely to see again. Second,
our existing forecast for a low (but not zero) level of defaults looks quite reasonable given
current levels of leverage and our economic outlook.
Calculating the credit risk premium
Returning to our pursuit of historical estimates of the credit risk premium, we build the
insights from the framework in Exhibit 5 into a regression model that predicts future credit
losses using ex-ante information. That is, the model predicts losses using only data that
might reasonably have been anticipated at the time that credit spreads were determined
(although we do use data from the entire historical period to estimate the parameters of
the model). We use a crude assumption of a 50% loss-given-default rate to transform our
default data into estimated losses, and we predict expected 10-year loss rates for
comparison to our 10-year spread series.
Exhibit 6: Expected losses explain only a small portion of
spreads
Exhibit 7: The credit risk premium is also somewhat
above its historical median
10-year BBB Industrial spread and expected 10-year forward
loss rate
Difference between 10-year BBB Industrial spread and
expected 10-year forward loss rate
0.07
8%
Estimated 10-yr BBB Industrial spread
7%
Credit Risk Premium
0.06
Predicted forward 10-yr cumulative loss rate
6%
75th percentile
Median
0.05
25th percentile
5%
0.04
4%
3%
0.03
2%
0.02
1%
0.01
0%
Goldman Sachs Global Investment Research
2014
2008
2002
1996
1990
1984
1978
1972
1966
1960
1954
1948
1942
1936
2014
2008
2002
1996
1990
1984
1978
1972
1966
1960
1954
1948
1942
1936
1930
Source: Moody’s, S&P, Haver Analytics, Bureau of Economic Analysis,
Goldman Sachs Global Investment Research.
1930
0
-1%
Source: Moody’s, S&P, Haver Analytics, Bureau of Economic Analysis,
Goldman Sachs Global Investment Research.
6
February 26, 2014
Global Economics Weekly
Exhibit 6 graphs these expected loss rates against our estimate of the credit spread from
Exhibit 1. The gap between the spread and the loss forecast is our crude measure of the
credit risk premium embedded in spreads at each point in history. Of course, this measure
of the credit risk premium comes with many caveats, not least that the spread series and
loss forecast are based on somewhat different sets of firms (the spread comes from BBB
industrial bond issuers and the loss forecast from all bond issuers). Nonetheless, we find it
useful for understanding changes in the credit risk premium over long periods.
Credit spreads and the expected loss rate are clearly correlated over time. They are both at
high levels during the Depression era, at low levels in the post-war years and relatively
elevated in the last three decades. That said, the risk premium is always a substantial
component of the total spread. That is, expected losses are always much lower than spreads.
The risk premium also drives the vast majority of higher-frequency fluctuations in the
spread—that is, spreads are much more volatile than expected losses. This fact partly
reflects the inherent difficulty in constructing a true real-time measure of expected losses
(for example, when spreads spiked on the eve of the crisis in late 2008, one could argue
that the probability of catastrophic losses on corporate credit actually seemed quite high).
But it also reflects a common feature of a wide variety of asset markets—that prices
fluctuate far more than fundamentals.
Exhibit 7 graphs the implied credit risk premium from Exhibit 6. Many of our impressions
from the raw spread data in Exhibit 1 carry through to this credit risk premium. Although
the credit risk premium has fallen dramatically from its crisis peaks, it remains near its
historical median and has spent long stretches far below its current level.
We expect spreads to continue their grind tighter
So where should the credit risk premium be? There is no theoretical ‘right answer’ to the
question of how much compensation investors should receive for holding corporate credit
risk. After all, the price of risk is determined by supply and demand like any other price. But
we look to history for guidance on how risk premia typically vary with the business cycle.
Exhibit 7 suggests that the credit risk premium tends to fall during times of economic
growth and low volatility, as disaster and other risks become less prominent (see “The
evolution of disaster risk in 2014”, Global Economics Weekly, January 15, 2014).
Exhibit 8: Our forecasts call for a modest grind tighter in corporate spreads this year
GS forecasts. IG spreads are 5-year iBoxx index and HY are BAML OAS.
Spread forecasts (bps)
USD
EUR
25-Feb-14
2014Q1
2014Q2
2014Q3
2014Q4
79
Investment Grade
94
88
85
82
IG Financial
101
91
85
80
74
IG Non-Financial
87
86
85
84
82
High Yield (OAS)
384
381
379
377
370
BB
262
261
261
260
255
B
366
365
364
364
357
CCC
731
720
713
705
691
Investment Grade
122
120
116
114
111
IG Financial
131
125
120
116
113
IG Non-Financial
115
115
113
112
109
Source: iBoxx, BAML, Goldman Sachs Global Investment Research.
Goldman Sachs Global Investment Research
7
February 26, 2014
Global Economics Weekly
We envisage an environment like this going forward. Our forecast calls for US real GDP to
grow by 2.9% over the course of 2014 (Q4/Q4). Low levels of inflation imply nominal GDP
growth of 4.2% over the same period, with some acceleration in the coming years. Given
current levels of leverage, our framework above suggests that these growth rates should
drive low (but not zero) default rates going forward. We also expect a return to the ‘Great
Moderation’ of macroeconomic fluctuations in developed economies, accompanied by
subdued volatility in financial markets (“Spooky markets no more? (Mostly) low volatility
ahead”, Global Markets Daily, October 31, 2013). We expect these forces to drive a further
downward drift in the credit risk premium.
All together, these ingredients lead us to continue to forecast a modest grind tighter in
credit spreads over the coming year. Exhibit 8 shows that we expect high yield OAS to fall
to 370bp by year-end from 384 today, and investment grade 5-year spreads to fall to 79bp
in the US and 111bp in Europe, from 94 and 122 today.
Jesse Edgerton
Goldman Sachs Global Investment Research
8
February 26, 2014
Global Economics Weekly
Global economic forecasts
Real GDP, %ch yoy
Consumer Prices, %ch yoy
2014
G3
USA
Euro area
Japan
Advanced Economies
Australia
Canada
France
Germany
Italy
New Zealand
Norway
Spain
Sweden
Switzerland
UK
Asia
China
Hong Kong
India
Indonesia
Malaysia
Philippines
Singapore
South Korea
Taiwan
Thailand
CEEMEA
Czech Republic
Hungary
Poland
Russia
South Africa
Turkey
Latin America
Argentina
Brazil
Chile
Mexico
Venezuela
Regional Aggregates
BRICS
G7
EU27
G20
Asia ex Japan
Central and Eastern Europe
Latin America
Emerging Markets
Advanced Economies
World
2015
2016
2017
2.9
1.2
1.0
3.2
1.5
1.2
3.0
1.7
1.5
3.0
1.6
1.4
2.0
2.6
0.9
2.0
0.6
3.1
1.8
0.9
2.5
2.2
2.9
2.6
2.7
1.1
2.1
1.0
2.1
2.0
1.2
3.4
2.1
2.7
3.6
2.0
1.4
2.2
1.2
2.4
1.7
1.7
2.9
1.9
3.0
3.9
1.9
1.8
1.6
1.3
2.3
1.7
1.7
2.7
1.7
3.0
7.6
3.7
5.0
5.5
4.5
6.3
3.8
3.7
3.8
2.3
7.8
4.4
6.2
6.0
5.2
6.5
4.2
3.8
3.9
4.7
7.6
3.7
6.6
6.0
5.0
6.3
4.0
4.0
3.8
5.0
7.4
4.0
6.9
6.0
5.0
6.3
4.0
3.8
3.8
5.1
1.7
1.8
2.9
3.0
2.4
2.0
2.4
1.9
3.2
3.6
2.9
1.8
2.6
2.2
3.4
3.6
3.6
5.8
2.4
1.9
3.2
3.7
3.5
5.0
1.7
2.1
3.5
3.3
-1.3
1.3
2.9
4.5
3.8
0.5
3.4
3.3
4.5
3.6
1.8
5.3
3.6
4.5
3.6
2.7
6.0
2.3
1.6
3.6
6.2
2.5
2.5
5.2
2.3
3.5
6.5
2.5
1.8
4.0
6.7
2.8
3.2
5.8
2.5
4.0
6.6
2.5
2.1
4.2
6.7
3.0
3.6
6.0
2.5
4.1
6.6
2.4
1.9
4.2
6.7
2.8
3.9
6.1
2.5
4.1
G3
USA
Euro area
Japan
Advanced Economies
Australia
Canada
France
Germany
Italy
New Zealand
Norway
Spain
Sweden
Switzerland
UK
Asia
China
Hong Kong
India
Indonesia
Malaysia
Philippines
Singapore
South Korea
Taiwan
Thailand
CEEMEA
Czech Republic
Hungary
Poland
Russia
South Africa
Turkey
Latin America
Argentina
Brazil
Chile
Mexico
Venezuela
Regional Aggregates
BRICS
G7
EU27
G20
Asia ex Japan
Central and Eastern Europe
Latin America
Emerging Markets
Advanced Economies
World
2014
2015
2016
2017
1.6
0.9
2.6
1.9
1.5
1.7
2.1
1.8
2.1
2.2
1.9
1.0
3.2
1.5
1.0
1.4
0.9
2.0
1.7
0.3
0.6
0.5
1.7
2.6
1.8
1.3
2.5
1.3
2.2
1.5
0.6
1.7
1.3
1.7
2.8
2.0
1.6
2.9
1.4
2.2
1.8
0.8
2.3
1.6
1.8
2.4
2.0
1.6
2.9
1.5
1.9
2.0
1.0
2.4
1.9
1.9
3.0
3.3
6.5
6.8
3.0
3.8
3.3
2.2
1.4
2.6
3.0
3.3
6.1
5.5
2.6
3.5
3.5
2.6
1.8
2.9
3.0
3.1
5.8
5.5
2.5
3.5
3.2
2.7
1.8
3.0
3.0
3.1
5.2
5.5
2.5
3.5
2.8
2.2
1.7
2.8
0.6
1.3
1.5
5.5
5.9
7.7
1.9
2.9
1.8
5.1
5.8
6.8
2.0
3.0
2.3
4.7
5.6
6.1
2.0
3.3
2.4
4.4
5.7
6.5
14.8
5.8
3.3
4.2
61.4
17.7
5.9
2.9
3.5
50.9
16.8
5.5
3.0
3.1
28.3
13.7
5.1
3.0
3.0
20.8
4.3
1.7
1.0
2.9
3.8
1.2
10.7
5.7
1.6
3.3
4.2
1.8
1.6
3.0
3.7
2.0
8.7
5.1
1.8
3.3
4.0
2.1
1.9
3.1
3.6
2.3
6.6
4.5
2.1
3.2
3.8
2.0
2.0
2.9
3.5
2.5
5.6
4.2
2.0
3.0
Source: Goldman Sachs Global Investment Research
For India we use WPI not CPI. For a list of the members within groups, please refer to ERWIN.
For our latest Bond, Currency and GSDEER forecasts, please refer to the Goldman Sachs 360 website: (https://360.gs.com/gs/portal/research/econ/econmarkets/).
Goldman Sachs Global Investment Research
9
February 26, 2014
Global Economics Weekly
Global macro and markets charts
PMI-implied global growth
8
GLI momentum vs. global industrial production*
2
% qoq
annl
6
%mom
1
4
0
2
-1
0
-2
Global PMI ModelImplied Growth
-2
-4
Global Actual
Sequential Growth
-3
-6
GLI Momentum
Global Industrial Production*, 3mma
GS Forecast
-4
-8
03
04
05
06
07
08
09
10
11
12
13
14
15
00
01
02
03
04
05
06
07
08
09
10
11
13
See Global Economics Weekly 12/18 for methodology
Source: OECD, Goldman Sachs Global Investment Research
* Includes OECD countries plus BRICs, Indonesia and South Africa
See Global Economics Paper 199 for methodology
Source: OECD, Goldman Sachs Global Investment Research
GLI ‘Swirlogram’
China, Europe and US risk factors
0.06%
Recovery
0.04%
Jul-13
Jun-13
Apr-13
0.02%
GLI Acceleration
Expansion
May-13
14
110
Index
105
Aug-13
100
0.00%
Europe Risk
95
-0.02%
Mar-13
Jan-14
-0.04%
Oct-13
Feb-14
-0.06%
-0.08%
-0.1%
0.0%
Slowdown
0.1%
0.2%
GLI Growth
0.3%
US Risks
90
Nov-13
Dec-13
Contraction
China Risk
Sep-13
0.4%
0.5%
85
80
Jan-13 Mar-13 May-13 Jul-13
Sep-13 Nov-13 Jan-14
See Global Economics Paper 214 for methodology
Source: OECD, Goldman Sachs Global Investment Research
See Global Economics Weekly 12/15 for methodology
Source: Goldman Sachs Global Investment Research
US equity risk premium
US equity credit premium
6.5
5
%
6.1
%
4
5.7
US ERP, calculated daily
5.3
US ERP, 200 Day Moving Average
3
4.9
4.5
2
4.1
1
3.7
1985-1998
average
Credit
relatively
expensive
0
3.3
2.9
-1
2.5
-2
2.1
1.7
04
05
06
07
08
09
10
11
12
See Global Economics Weekly 02/35 for methodology
Source: Goldman Sachs Global Investment Research
Goldman Sachs Global Investment Research
13
14
-3
2 standard deviations
band
82 84 86 88 90 92 94 96 98 00 02 04 06 08 10 12 14
See Global Economics Weekly 03/25 for methodology
Source: Goldman Sachs Global Investment Research
10
February 26, 2014
Global Economics Weekly
The world in a nutshell
THE GLOBAL ECONOMY
OUTLOOK
KEY ISSUES
UNITED STATES
We expect annual growth to accelerate to 2.9% in 2014
after 1.9% in 2013. Growth should then remain above
trend in 2015 and 2016. On an annualised sequential basis,
we expect growth of 1.8% in the first quarter of 2014 and
3.0%-3.5% for the rest of the year.
We expect the US to lead the reacceleration in global
growth in 2014. The rationale is a sharp reduction in fiscal
drag, which should allow the continued recovery in
underlying private-sector spending to translate into a
stronger growth picture. In particular, we expect positive
impulses from personal consumption and business fixed
investment to add significantly to growth in 2014.
JAPAN
We expect real GDP growth 0f 1.0% in 2014 and 1.2% in
2015. On a sequential basis, we expect volatile growth
over the coming quarters as forthcoming consumption tax
hikes in 2014 and 2015 will affect personal consumption
expenditures. We expect positive private demand
dynamics to continue but worry about increased fiscal
drag.
Structurally, Japan is poised to reach above-trend growth
rates in step with an improvement in the global economy.
The new leadership at the BoJ has led to a regime shift in
Japanese monetary policy, with much more aggressive,
Fed-style easing capabilities. While this potentially offers
a way out of more than a decade of deflation, reaching
the 2% inflation target remains a tall order.
EUROPE
For the Euro area as a whole, we expect a return to
positive growth of 1.2% in 2014, followed by 1.5% in 2015.
The growth outlook at the country level looks friendlier
than in 2013 but it still shows a divergent trajectory, with
growth in Italy, Spain and France around or less than 1%
and in Germany at 2%. At the same time, private-sector
headwinds remain as banking lending standards have
continued to tighten.
We expect the Euro area to continue pulling out of
recession, driven by modest improvements across all
major components of domestic demand. Still, the list of
necessary adjustments in the periphery remains long,
ranging from cleaning up the banking system and labour
market reform to increasing competitiveness.
NON-JAPAN ASIA
For Asia ex-Japan, we expect growth of 6.2% and 6.7% in
2014 and 2015, respectively. We expect the economies in
the region to benefit from the stronger DM recovery in
2014, but with significant differentiation across countries.
In China, we expect real GDP growth of 7.6% in 2014, and
7.8% in 2015. Although growth is slightly below trend, the
recent tightening in financial conditions sends the signal
that policymakers are willing to tolerate somewhat lower
growth in order to tackle structural problems and foster
more sustainable medium-term growth.
LATIN AMERICA
We forecast that real GDP growth in Latin America will be
2.5% in 2014 and 3.2% in 2015. Against a more favourable
global backdrop, the divergence between those economies
with more challenging (Brazil) and more stable (Mexico)
policy outlooks is likely to increase.
In Brazil, we expect real GDP growth of 2.1% in 2014, and
2.9% in 2015. Despite two consecutive years of sub-par
growth, inflation has been sticky above the inflation target
of 4.5%. BRL weakness will likely force the Copom to
continue to hike policy rates.
CENTRAL &
EASTERN EUROPE,
MIDDLE EAST AND
AFRICA
With growth across the region forecast at 2.9% in 2014 and
3.2% in 2015, we expect CEEMEA to continue to recover.
Helped by improvements in external demand conditions,
large output gaps provide fertile ground for recovery from
the 2012 soft patch, although current account deficit
countries in particular will continue to face stiff challenges.
The EM differentiation theme is again visible across the
region. While we forecast strong and steady growth in
Israel and Russia, we see a similar recovery in Turkey as
less sustainable. Growth in South Africa and Ukraine will
likely be dragged down by idiosyncratic political and
economic risks.
CENTRAL BANK WATCH
CURRENT SITUATION
NEXT
MEETINGS
EXPECTATION
UNITED STATES:
FOMC
The Fed funds rate is at 0%-0.25%. The Fed
initiated a new round of asset purchases and
extended its rate guidance on September 13, 2012.
Mar. 19
Apr. 30
We expect the Fed to keep the funds rate near 0%
through 2015, and to continue asset purchases until
3Q2014, albeit at a reduced pace.
JAPAN: BoJ
Monetary Policy
Board
The overnight call rate is at 0%-0.1%. The BoJ
significantly extended asset purchases, as well as
the related maturity horizon, on April 4, 2013.
Mar. 11
Apr. 8
We expect the BoJ to keep the policy rate near 0%
and to expand its monetary easing efforts through
ongoing asset purchases.
EURO AREA: ECB
Governing Council
The refi/deposit rates are at 0.25%/0.00%. The ECB
announced the OMT programme for conditional
purchases of Euro area sovereign bonds in Sept.
2012 and cut the refi rate by 25bp on Nov. 7, 2013.
The BoE policy rate is currently at 0.5%. The BoE
announced threshold-based forward guidance for
the path of the policy rate on August 7, 2013.
Mar. 6
Apr. 3
We expect the ECB to cut the MRO and deposit rate
by 15bp at its April meeting.
Mar. 6
Apr. 12
We expect the BoE to keep the policy rate unchanged
until mid- 2015.
UK: BoE Monetary
Policy Committee
Goldman Sachs Global Investment Research
11
February 26, 2014
Global Economics Weekly
Disclosure Appendix
Reg AC
I, Jesse Edgerton, hereby certify that all of the views expressed in this report accurately reflect my personal views about the subject company or
companies and its or their securities. I also certify that no part of my compensation was, is or will be, directly or indirectly, related to the specific
recommendations or views expressed in this report.
We, Dominic Wilson, Kamakshya Trivedi, Noah Weisberger, Aleksandar Timcenko, Jose Ursua, George Cole and Julian Richers, hereby certify that all
of the views expressed in this report accurately reflect our personal views, which have not been influenced by considerations of the firm's business
or client relationships.
Disclosures
Global product; distributing entities
The Global Investment Research Division of Goldman Sachs produces and distributes research products for clients of Goldman Sachs on a global
basis. Analysts based in Goldman Sachs offices around the world produce equity research on industries and companies, and research on
macroeconomics, currencies, commodities and portfolio strategy. This research is disseminated in Australia by Goldman Sachs Australia Pty Ltd
(ABN 21 006 797 897); in Brazil by Goldman Sachs do Brasil Corretora de Títulos e Valores Mobiliários S.A.; in Canada by either Goldman Sachs
Canada Inc. or Goldman, Sachs & Co.; in Hong Kong by Goldman Sachs (Asia) L.L.C.; in India by Goldman Sachs (India) Securities Private Ltd.; in
Japan by Goldman Sachs Japan Co., Ltd.; in the Republic of Korea by Goldman Sachs (Asia) L.L.C., Seoul Branch; in New Zealand by Goldman Sachs
New Zealand Limited; in Russia by OOO Goldman Sachs; in Singapore by Goldman Sachs (Singapore) Pte. (Company Number: 198602165W); and in
the United States of America by Goldman, Sachs & Co. Goldman Sachs International has approved this research in connection with its distribution in
the United Kingdom and European Union.
European Union: Goldman Sachs International authorised by the Prudential Regulation Authority and regulated by the Financial Conduct Authority
and the Prudential Regulation Authority, has approved this research in connection with its distribution in the European Union and United Kingdom;
Goldman Sachs AG and Goldman Sachs International Zweigniederlassung Frankfurt, regulated by the Bundesanstalt für
Finanzdienstleistungsaufsicht, may also distribute research in Germany.
General disclosures
This research is for our clients only. Other than disclosures relating to Goldman Sachs, this research is based on current public information that we
consider reliable, but we do not represent it is accurate or complete, and it should not be relied on as such. We seek to update our research as
appropriate, but various regulations may prevent us from doing so. Other than certain industry reports published on a periodic basis, the large
majority of reports are published at irregular intervals as appropriate in the analyst's judgment.
Goldman Sachs conducts a global full-service, integrated investment banking, investment management, and brokerage business. We have
investment banking and other business relationships with a substantial percentage of the companies covered by our Global Investment Research
Division. Goldman, Sachs & Co., the United States broker dealer, is a member of SIPC (http://www.sipc.org).
Our salespeople, traders, and other professionals may provide oral or written market commentary or trading strategies to our clients and our
proprietary trading desks that reflect opinions that are contrary to the opinions expressed in this research. Our asset management area, our
proprietary trading desks and investing businesses may make investment decisions that are inconsistent with the recommendations or views
expressed in this research.
The analysts named in this report may have from time to time discussed with our clients, including Goldman Sachs salespersons and traders, or may
discuss in this report, trading strategies that reference catalysts or events that may have a near-term impact on the market price of the equity
securities discussed in this report, which impact may be directionally counter to the analyst's published price target expectations for such stocks. Any
such trading strategies are distinct from and do not affect the analyst's fundamental equity rating for such stocks, which rating reflects a stock's
return potential relative to its coverage group as described herein.
We and our affiliates, officers, directors, and employees, excluding equity and credit analysts, will from time to time have long or short positions in,
act as principal in, and buy or sell, the securities or derivatives, if any, referred to in this research.
This research is not an offer to sell or the solicitation of an offer to buy any security in any jurisdiction where such an offer or solicitation would be
illegal. It does not constitute a personal recommendation or take into account the particular investment objectives, financial situations, or needs of
individual clients. Clients should consider whether any advice or recommendation in this research is suitable for their particular circumstances and, if
appropriate, seek professional advice, including tax advice. The price and value of investments referred to in this research and the income from them
may fluctuate. Past performance is not a guide to future performance, future returns are not guaranteed, and a loss of original capital may occur.
Fluctuations in exchange rates could have adverse effects on the value or price of, or income derived from, certain investments.
Certain transactions, including those involving futures, options, and other derivatives, give rise to substantial risk and are not suitable for all investors.
Investors should review current options disclosure documents which are available from Goldman Sachs sales representatives or at
http://www.theocc.com/about/publications/character-risks.jsp. Transaction costs may be significant in option strategies calling for multiple purchase
and sales of options such as spreads. Supporting documentation will be supplied upon request.
All research reports are disseminated and available to all clients simultaneously through electronic publication to our internal client websites. Not all
research content is redistributed to our clients or available to third-party aggregators, nor is Goldman Sachs responsible for the redistribution of our
research by third party aggregators. For research or data available on a particular security, please contact your sales representative or go to
http://360.gs.com.
Disclosure information is also available at http://www.gs.com/research/hedge.html or from Research Compliance, 200 West Street, New York, NY
10282.
© 2014 Goldman Sachs.
No part of this material may be (i) copied, photocopied or duplicated in any form by any means or (ii) redistributed without the prior
written consent of The Goldman Sachs Group, Inc.
Goldman Sachs Global Investment Research
12
© Copyright 2026 ExpyDoc