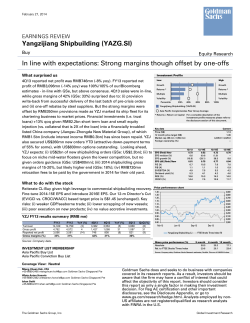
March 5, 2014 Issue No: 14/09 Global Economics Weekly Economics Research Small lessons from big crises Lessons from the “Big Three” crises Dominic Wilson Concerns about possible financial crises in the EM world have intensified. So far, the challenges have not risen to that level. We look back at the ‘Big Three’ crisis of the past 20 years (the Asian/EM crises of the late 1990s, the global financial crisis and the Euro area sovereign crisis) to identify the ingredients that past crises suggest may be needed for risks to escalate (212) 902-5924 [email protected] Goldman, Sachs & Co. Kamakshya Trivedi +44(20)7051-4005 [email protected] Goldman Sachs International Noah Weisberger (212) 357-6261 [email protected] Goldman, Sachs & Co. Four common elements in past episodes These crises had their origins in a period of easy financial conditions which fueled leverage and private sector imbalances. Four steps seem to have been particularly important in intensifying these fault-lines into something more critical: asset pressure on levered balance sheets; feedback loops that exacerbated the initial pressure; maturity mismatch in areas that are not backstopped; and limits to the lenders of last resort. These steps provide pointers as to the conditions under which stresses in EMs, including China, might accelerate Aleksandar Timcenko (212) 357-7628 [email protected] Goldman, Sachs & Co. Jose Ursua (212) 357-2234 [email protected] Goldman, Sachs & Co. George Cole +44(20)7552-3779 [email protected] Goldman Sachs International Julian Richers (212) 855-0684 [email protected] Goldman, Sachs & Co. Four common elements in “Big Three” crisis escalation 1990s EM/Asian Crises US Mortgage Crisis Euro Area Debt Crisis Levered Asset Exposure Feedback Loops Maturity Mismatch Limits to Lender of Last Resort Foreign currency liabilities Pressure on banks and corporates with FX liabilities Short-term FX borrowing in excess of FX reserves EM Central Banks lack enough FX reserves to satisfy liquity needs Dependence on wholesale funding, SIVs and money market mutual funds Shadow banking system without access to liquidity support Short-dated sovereign borrowing and crossborder bank financing National central banks unable to backstop own sovereign/banks without ECB approval Mortgage, housing "Levered losses" lead assets (and to bank balance structured sheet shrinkage mortgage/credit) Greek/peripheral sovereign debt Bank holdings of sovereign debt/uncertainty around sovereign backstop for banks Source: Goldman Sachs Global Investment Research. Investors should consider this report as only a single factor in making their investment decision. For Reg AC certification and other important disclosures, see the Disclosure Appendix, or go to www.gs.com/research/hedge.html. The Goldman Sachs Group, Inc. Global Investment Research March 5, 2014 Global Economics Weekly Small lessons from big crises Over the last two decades, the world economy often seems to have been stumbling through a rolling succession of crises. Hot on the heels of the global financial crisis, the sovereign crisis in the Euro area arrived. And now, as the tremors in Europe have been receding, concern about possible financial crises in the EM world, including in China, has once again intensified. So far, the challenges in the EM world have not risen to that level. But there is intense focus on the issue of how pressures there could deteriorate into something more serious or spread to other parts of the global economy. In the process, comparisons are frequently – but often imprecisely – drawn to prior crises. We have discussed the nature of the fragilities in EM and the risks of transmission to EM over the last few months. We attack the issue here from a slightly different angle, looking back at what we can learn at a high level from the ‘Big Three’ crisis episodes of the past 20 years: the Asian/EM crises of the late 1990s; the global financial crisis of 2007-09; and the Euro area sovereign crisis that began in 2010. Our goal is to identify the ingredients that past crises suggest may be needed for risks to escalate. In generalising across very different episodes, there is a high risk of oversimplification. But there is still value in using these past experiences to think about how to identify and monitor current vulnerabilities. Four features appear to have been particularly important in each case (Exhibit 1). First, there was pressure on an asset that was important to levered balance sheets. Second, there were clear feedback loops that meant that initial pressure led to further stress. Third, there was significant maturity mismatch beyond bank deposits that helped fuel liquidity crises. Fourth, lenders of last resort were unable or unwilling to substitute quickly for that lost liquidity in ways that might have prevented a self-fulfilling ‘run’. Taken together, these three crises also highlight the unique role played by banking systems – given their leverage and maturity mismatch – in amplifying stress. These features provide some pointers as to the conditions under which stresses in other areas might accelerate. In particular, a simple checklist would aim to identify: Any troubling asset exposures on levered balance sheets. The kinds of feedback loops that may arise if stresses begin. Maturity mismatches, particularly beyond conventional bank deposits. The likely responses and constraints on potential lenders of last resort. Exhibit 1: Four common elements in “Big Three” crisis escalation 1990s EM/Asian Crises US Mortgage Crisis Euro Area Debt Crisis Levered Asset Exposure Feedback Loops Maturity Mismatch Limits to Lender of Last Resort Foreign currency liabilities Pressure on banks and corporates with FX liabilities Short-term FX borrowing in excess of FX reserves EM Central Banks lack enough FX reserves to satisfy liquity needs Dependence on wholesale funding, SIVs and money market mutual funds Shadow banking system without access to liquidity support Short-dated sovereign borrowing and crossborder bank financing National central banks unable to backstop own sovereign/banks without ECB approval Mortgage, housing "Levered losses" lead assets (and to bank balance structured sheet shrinkage mortgage/credit) Greek/peripheral sovereign debt Bank holdings of sovereign debt/uncertainty around sovereign backstop for banks Source: Goldman Sachs Global Investment Research. Goldman Sachs Global Investment Research 2 March 5, 2014 Global Economics Weekly A key difficulty that prior crises also highlight in assembling this checklist is that it is much harder ex ante to identify the sources of leverage, balance sheet exposure and policy commitments, than it is ex post. Common elements in the ‘Big Three’ crises IMF Managing Director Michel Camdessus famously referred to the 1994-95 Mexico financial crisis as the “first financial crisis of the 21st century”. In doing so, he drew attention to the extraordinary shifts in capital flows and balance sheet problems that resulted. The series of crises that have followed over the last 20 years have continued to highlight those issues. The Big Three crises – in EM in the late 1990s, the global financial crisis and the Euro area crisis – stand out in terms of the sharpness of growth collapses in the affected areas, the scale of the damage to local banking systems and the degree to which they appeared to threaten the global financial system (Exhibit 2). When investors now worry about significant crisis risk, one or other of these templates is usually lying in the background. However, since the global financial crisis in particular, there has been a tendency to see a crisis behind every tremor. So it is useful to define the conditions that turn a ‘run of the mill’ economic challenge or financial imbalance into a much more serious problem for growth or financial markets. There are huge differences across those three episodes, in terms of their origins, their impact and the breadth of their transmission. But there are also some important commonalities. The build-up to these crises shared some common themes. In each case, a prolonged period of easy financial conditions fuelled a build-up in leverage that eventually unwound painfully for borrowers. The period of easy financing generally encouraged a loosening of lending standards and new forms of financing that often sprang up outside the traditional regulatory net. The build-up in leverage led to real economic imbalances (Exhibit 3). More than any single macro indicator, current account deficits (and significant current account deterioration) were key symptoms of the growing cross-border imbalances in each case and the deterioration in private financial positions. Those elements have generally already been visible in the run-up to the latest round of problems in the emerging markets. So the question is more about what happens next. Exhibit 2: Significant recessions in each of the countries at the centre of the “Big Three” crises 0 Trough in GDP growth (%, yoy) -2 -2 -4 2011 2012 Source: Haver Analytics, Goldman Sachs Global Investment Research. Goldman Sachs Global Investment Research 1996 2006 2008 Current Account Balance (% of GDP) Indonesia Spain Greece UK US Korea Russia Thailand -16 Indonesia -18 -14 Greece -16 2008 Portugal 1998 Spain -12 -14 Ireland -10 -12 Italy -8 -10 UK -6 -8 US -6 Thailand -4 Malaysia 0 Korea 2 Exhibit 3: Current account deficits, amid easy financing conditions, a pre-cursor in each crisis Source: Haver Analytics, Goldman Sachs Global Investment Research. 3 March 5, 2014 Global Economics Weekly Beyond these similarities in the origins of the crises, there were also similarities in the ways in which those initial pressures intensified. Without attempting to be comprehensive, we argue that four common elements were particularly important in explaining how the Big Three crises moved into the critical phase. 1. Asset pressure on levered balance sheets The first common element was initial pressure on an asset that was widely held on levered balance sheets. In the Asian financial crisis, it was (in the first instance) local currencies that came under pressure for devaluation, although subsequent pressure on commodity prices ultimately saw the problem spread to a much larger range of EM economies. In the run-up to the global financial prices, US mortgages embedded excessively optimistic expectations of home prices. In the Euro area, Greek sovereign debt – and then the debt of other peripheral economies – came under scrutiny on the back of doubts about fiscal sustainability. In each case, the asset exposures that were built up were generally perceived as ‘safe’ and in some cases implicitly guaranteed by governments. Asian borrowers viewed their government’s commitment to currency pegs as solid. US mortgage default risk, assessed through the prism of past experience, was regarded as extremely low. And there was a widespread assumption that peripheral sovereign debt was implicitly backstopped by the stronger Euro area members (Exhibit 4). These assumptions fuelled the willingness to take on leverage against these assets and also generally led to low (and sometimes no) capital provisioning against them. As these assets were important for levered institutions, even small shifts in their prices quickly led to balance sheet pressure. In the EM crises, banks and corporates had taken on significant foreign currency exposure through offshore funding. Alongside high financial and corporate leverage, small shifts in currencies led to sharply increased liabilities. In the global financial crisis, many households had increased leverage in ways that left them unusually vulnerable to house price declines. Banks had increased leverage while accumulating assets that were heavily influenced by home price values, some of which – through structuring – often embedded further leverage. And conventional banking system leverage was itself unusually high. In the Euro area crisis, alongside high bank leverage, peripheral sovereign bonds were also a major asset held on bank balance sheets, so small shifts in their value had large effects on perceived capital positions. Exhibit 4: Crises involved pressures on assets important to levered balance sheets Exhibit 5: Without leverage, equity value collapse after the dot-com bubble was much less damaging 12 -80 8 ppt USD trn Real Estate -70 10 -60 Dot-com Mortgage crisis ppt Equities 7 6 8 6 2007 2010 4 2 -50 5 -40 4 -30 3 -20 2 -10 1 0 EA Periphery Net Gov't Debt US Mortgage Debt 0 0 Max Drop in asset value (as share of GDP) Source: Haver Analytics, Goldman Sachs Global Investment Research. Goldman Sachs Global Investment Research Max Change in unemployment rate Source: Haver Analytics, Goldman Sachs Global Investment Research. 4 March 5, 2014 Global Economics Weekly While banks were the most obvious form of levered actor, these exposures were not always held directly on bank balance sheets. In the Asian crises, exposure to foreign currency weakness was sometimes in highly leveraged corporates and in non-bank intermediaries. The main systemic threat to the developed markets in the fall of 1998 came not through bank leverage but through the leverage built up in LTCM, a hedge fund. And in the US mortgage crisis, leverage in funds and financing vehicles that were off bank balance sheets played an important role. The distribution of leverage was also important. The case of large conglomerates in Korea, or LTCM in 1998, illustrated that the presence of concentrated leverage in a smaller portion of the economy or financial sector could lead to problems even if aggregate measures were more benign. But ultimately, these exposures ended up – directly or indirectly – causing stress for bank balance sheets. A counter-example underscores the critical role by leverage in determining the degree of economic stress from asset price declines. In the tech bubble, a large hit to asset values (close to 60% of GDP in the US) had much smaller economic consequences because financing took the form of equity rather than debt (Exhibit 5). The IMF has shown that equity busts tend to be less damaging than housing busts historically, partly for this reason (see Chapter II “When Bubbles Burst”, IMF, 2003, World Economic Outlook). With leverage, shifts in asset prices in the Big Three crises quickly impaired capital positions and put pressure on local banks and the broader system of credit provision. 2. Feedback loops that exacerbate the initial pressures The second common feature was that significant feedback loops exacerbated the initial movements in asset prices. In the case of the Asian/EM crises, this was largely because the balance sheet stress on financials and corporates that had borrowed in foreign currency made their creditors keener to retrench. In the US mortgage crisis, the story of ‘levered losses’ (by which banks sought to shrink their balance sheets further as capital positions were threatened) precipitated further selling pressures (Exhibit 6). And in the Euro area crisis, concerns about sovereigns led to pressure on banks, whose balance sheet constraints then led to further pressure on sovereigns (Exhibit 7). The presence of significant private sector and current account imbalances meant that these pressures on debtors had larger than usual consequences for demand. Exhibit 6: In US mortgage crisis, capital pressures led to credit restraint and asset sales No Refis Available Distressed Housing Supply Negative Equity Less Homebuilding Deeper Recession Source: Goldman Sachs Global Investment Research. Goldman Sachs Global Investment Research Bank Solvency Concerns Lower Tax Receipts Expected Bailout Costs Weaker Housing Market Negative Wealth Effect Credit Losses Reduced Loan Supply Fiscal Crisis More Mortgage Defaults Bank Solvency Concerns More Banking/ Financial Strains Exhibit 7: In Euro area crisis, sovereign stress hurt banks, which added pressure back on sovereigns Fiscal Auster ity Loan Losses Banking Crisis Higher Unemployment Economic Crisis Reduced Loan Supply Source: Goldman Sachs Global Investment Research. 5 March 5, 2014 Global Economics Weekly The main feedback loops again highlight the special role played by banks and balance sheet channels. The work of former Fed Chair Ben Bernanke – among others – has highlighted the special role played by banks in screening and monitoring borrowers, and the ways in which pressure on balance sheets and collateral makes it harder for borrowers to access credit. Both can act as accelerators for initial asset market stresses and lead to sharper pressures to shrink spending. At the same time, monetary policy tends to be less effective in stimulating spending in downturns where those credit channels are clogged. Put simply, once economic problems become banking sector problems, the risks to activity tend to rise. Uncertainty about exposures and how they would be treated also played a central role in exacerbating initial problems. The difficulty of gauging ‘true’ balance sheet exposures and liquidity conditions amplified uncertainty about banking sector risk. In the EM crises, information on the foreign currency exposures of corporates and banks was not easily available; in the US, the complexity of the underlying structured products made it harder to value mortgage and credit exposures; and in the Euro area the circular nexus between banks and the sovereigns that guaranteed them led to uncertainty about how to treat capital positions. 3. Maturity mismatch in areas outside bank deposits The third common element came from significant maturity mismatch. The liquidity risk inherent in rolling over short-term financing played a key – and perhaps the key – role in all of the Big Three crises. Even where worries about solvency and capital exposure may have been overstated, concerns about maturity mismatch represented a genuine source of fragility. Maturity mismatch, and the vulnerabilities it generates, is at the heart of modern banking given the use of short-term deposits to fund longer-dated loans. The problem with shortterm financing is that it involves a coordination problem. Since those providing short-term financing may not be paid back easily if they all demand repayment together, any sense that other creditors may refuse to roll over financing may provide an incentive to do the same. Even without an underlying solvency problem, a liquidity crisis can then in principle ensue. Deposit insurance and the central banks’ role of lender of last resort were designed precisely to mitigate the risk of self-fulfilling liquidity crises and explain why classic ‘bank runs’ are much rarer than they were a century or more ago. Given those schemes and the stickiness of depositors, other forms of short-term funding proved to be the critical source of vulnerability in the Big Three crises. Precisely because the liquidity problems lay in areas that were outside the conventional insurance and lender of last resort system, existing mechanisms were not sufficient to prevent them. In the Asian crisis, reliance on short-term foreign currency borrowing (in excess of available reserves) was the principle vulnerability and the difficulty of rolling that over once currency pegs broke was a major trigger for the acceleration of the crisis (Exhibit 8). Nonbank intermediaries – Thai finance companies and Korean merchant banks – were often on the front line of problems, highlighting the role played by financial innovation and disintermediation of traditional banks. In the global financial crisis, central roles were played by the dependence on wholesale funding (Exhibit 9), the maturity mismatches in SIVs and eventually the ‘run’ on money market mutual funds, which in turn supported the US commercial paper market – all of which lay outside the conventional remit of government or central bank guarantees. In the Euro area crisis, dependence on short-term cross-border bank financing – and reliance of peripheral sovereigns on short-dated Goldman Sachs Global Investment Research 6 March 5, 2014 Global Economics Weekly Exhibit 8: Short-term foreign currency debt exceeded reserves in the 1990s crises, though less so now Exhibit 9: US reliance on non-deposit funding increased vulnerability to “rollover” risk in 2008-09 12 80 Reserves / Short-term external debt Deposits (% of total Liabilities) 78 10 76 8 74 6 72 70 4 68 66 2 64 BRL CNY RUB COP THB INR MYR KRW MYR '96 IDR CLP MXN HUF ILS ZAR CZK BRL '98 PLN TRY THB '96 UAH IDR '96 KRW '96 MXN '94 0 Source: Haver Analytics, Goldman Sachs Global Investment Research. US Banks 62 60 80 82 84 86 88 90 92 94 96 98 00 02 04 06 08 10 12 Source: Haver Analytics, Goldman Sachs Global Investment Research. borrowing – acted as amplifiers for initial stress. Interbank markets also proved to be particularly vulnerable to doubts about capital positions. Just as the distribution of solvency risk mattered, the distribution of liquidity risks also mattered. At times of stress, some banks had excess liquidity even as others had funding needs. But when capital positions came into question, the willingness to supply that liquidity evaporated. 4. Limits to the lender of last resort The fourth common element was that as these liquidity risks rose and rollover risks increased, lenders of last resort were unable or unwilling to replace the lost liquidity quickly or to provide guarantees that might have halted withdrawals. In some cases, the conventional lenders of last resort (central banks) were simply unable to perform that function. In the EM crises of the late 1990s, foreign currency liquidity was what was needed. With limited reserves, local central banks were unable to fill that need. And without confidence in the nominal exchange rate, attempts to provide local currency liquidity to the banking system, in Indonesia for instance, sometimes simply provided the financing for depositors to withdraw funds and convert them into Dollars. The same problem was true to a degree in the Euro area crisis, where devolution of authority to the ECB left national central banks unable to act independently as lenders of last resort to their own sovereigns and banks. Euro area sovereigns struggled to provide credible guarantees to their banking system when they themselves were under pressure. In other cases, the issues stemmed less from a capacity to act but more from an unwillingness to accept the political and economic consequences. Because of concerns about moral hazard, the risks of lending to potentially insolvent borrowers, the possible impact on public-sector balance sheets, a reluctance among financial institutions to signal a need for support and (in the Euro area particularly) the distributional consequences of assistance, liquidity provision was generally not extended rapidly enough to offset the collapse in private provision, and often it was only extended under duress. These concerns are fundamental to the challenges of policy-making in crises. Ex post, it is easy to argue that it would have been better to provide support earlier or more forcefully. But ex ante, the question of when support for troubled institutions is a wasteful bailout and when it is an essential defence against systemic risk is rarely completely clear. And because – in the end – the resolution of these issues is usually about who should bear the losses that have accumulated, these decisions are inherently politically complicated. Goldman Sachs Global Investment Research 7 March 5, 2014 Global Economics Weekly Exhibit 10: Fed and ECB ultimately used balance sheets aggressively to substitute for liquidity squeeze Exhibit 11: Current EM feedback risks centered on the impact of higher rates, slower growth on credit quality 1.8 Change in balance sheet from 2007 ($ trn) 1.6 1.4 Higher Interest Rate Federal Reserve (emergency credit only) 1.2 Government/CB Banks Recap Costs ECB 1.0 Banks 0.8 0.6 Fewer Loans 0.2 0.0 07 08 09 10 11 12 13 Source: Haver Analytics, Goldman Sachs Global Investment Research. Worsening Fiscal/Capital outflows Lower Tax Receipts Loan Losses 0.4 Weak capital inflows/FX Depreciation External Sector FX Depreciation/ Reduced Funding Weaker Growth Corporates Weaker Growth/Lower Debt Service Source: Haver Analytics, Goldman Sachs Global Investment Research. Ultimately, each of the Big Three crises settled only when liquidity provision and/or government guarantees were dramatically extended to replace the freeze in short-term financing in the private sector. In the EM crises, external financing through the IMF played the largest role. During the global financial crisis, the Fed ultimately expanded emergency liquidity facilities to all the main financial players against increasingly lenient collateral standards, took on direct responsibility for rolling over the US commercial paper market and provided extensive Dollar swap lines to other central banks (Exhibit 10). By 2012, the ECB had extended unlimited term funding to the Euro area banking sector through a 3-year LTRO, had largely replaced the interbank markets in funding peripheral banking systems and through the OMT had provided a conditional lending facility to backstop troubled sovereigns. In the US and Europe, deposit guarantees were also significantly expanded during their financial crises. Central banks were not the only lenders of last resort brought into action to provide emergency liquidity in these crises. In Korea in late 1997, for instance, and in LTCM consortia of banks were brought together to coordinate liquidity supply as part of the rescue packages. But even in these cases, official intervention was needed to solve the coordination problem and to reassure banks that they would be supported. Beyond constraints on the ability to act as a lender of last resort, other constraints limited the effectiveness of crisis response in some places. In particular, in the global financial and Euro area crises, concerns about public sector balance sheets limited counter-cyclical fiscal responses, while the constraints from the “zero lower bound” to policy rates made an effective monetary policy response more difficult. Lessons for the future In thinking about the risk of more serious problems in other circumstances – including in China and in the other fragile EM economies – it is helpful to consider what kind of exposures or policy choices could pose similar risks in each case. We do that briefly here. In terms of asset exposures on levered balance sheets, we have highlighted already that foreign currency mismatch for EM banks and corporates is generally lower than in the past in many EM economies (Exhibit 11). But clearly there are still some economies where those exposures are meaningful and it is difficult to be completely certain about unhedged currency exposures, particularly in the corporate sector. Instead, the main vulnerability seems more likely to come in most places through deterioration in domestic credit quality. Goldman Sachs Global Investment Research 8 March 5, 2014 Global Economics Weekly That is the most significant asset on bank balance sheets. And the risks posed by a period of loose monetary policy and increased leverage are most visible here. In China, we have argued that corporate credit exposures are the area to watch. In terms of feedback loops, the lower risk from foreign currency mismatch means that domestic credit channels are again a more important focus for many of the more fragile EM economies. In particular, where local inflation is already high, currency weakness may add to that pressure. Policymakers are already seeing pressure to tighten monetary policy in response to the deteriorating inflation outlook to avoid greater pressure on bond and FX markets. The risk is that the combination of higher interest rates and slower growth now begins to expose corporate or banking sector vulnerabilities, which discourage credit extension and add to asset market pressure. The role that uncertainty over balance sheet exposures may play in amplifying risks is also central here. In China, for instance, the complexity and perceived lack of transparency about the precise nature of exposures is a major source of anxiety for investors and policymakers alike. In terms of maturity mismatch, loan-to-deposit ratios generally show relatively limited reliance on non-deposit financing in many EM banking systems, including China where the large banks’ wholesale financing needs are relatively low. Even then, interbank markets – including in China – need to be watched for signs of stress. As we have seen elsewhere, if those banks with excess liquidity become reluctant to lend to those with funding needs – and if the distribution of liquidity becomes more uneven – those stresses have the potential to disrupt credit provision even in a system that is not on aggregate short of funding. The experience in the Big Three crises shows the importance of looking beyond conventional deposit finance where the structure of liquidity support is usually most immediate. Corporate deposits – which are often not separately identified – represent one potential source of vulnerability across markets, but their magnitude is hard to determine. In China, the focus is rightly on the financing of the shadow banking system where maturity mismatch is inherent to some of the trust fund financing vehicles. Our China team has argued, however, that the proportion of overall credit financed through this source is still relatively small and that most of the funding is not callable on demand. Hindsight is 20-20 Finally, these stresses highlight the importance of how lenders of last resort act in substituting for liquidity stresses and how quick they are to act to supply emergency liquidity to financial intermediaries if needed. Unlike the 1990s, the build-up of foreign reserves means that many EM central banks have capacity to provide emergency foreign currency liquidity to local banks and corporates, as some did in 2008-09. Because the major vulnerabilities are more likely to be associated with local credit in local currency, the capacity of central banks to act as lenders of last resort is – in principle – relatively high. But the Big Three crises highlight two risks on that front. The first is that if inflationary credibility is lost, central bank liquidity provision may simply finance deposit flight. So maintaining anchored inflation expectations will be important in allowing some of the more vulnerable EM economies to act decisively to alleviate any banking sector stress. The second is that successfully dealing with credit excesses – particularly in China – involves a tricky balancing act for policymakers between restraining riskier lending channels without prompting a sharper withdrawal of credit. In a sense, policymakers are deliberately introducing more uncertainty about the extent of their support to limit some of the risks built up during earlier period. Spikes in interbank rates last summer can be seen through that lens and China’s first corporate default was reported today. So far, risks of trust fund defaults have been quickly dealt with through pressure on banks and local governments to provide ongoing support. But even with significant flexibility and tools at their disposal, there is a risk that policy is insufficiently responsive to emerging stresses. Goldman Sachs Global Investment Research 9 March 5, 2014 Global Economics Weekly In thinking about these risks, the difficulty of identifying exposures and in gauging how to respond to them again deserves special mention. It is easy to know these answers after a crisis is over, but much harder to identify them in advance. Some of the key challenges in China and other EM economies lie firmly in that domain. In principle, policymakers may have advantages relative to the past in their capacity to backstop crises. Most versions of the more sanguine view of China’s credit issues, for instance, stem from the notion that the government and central bank have significant leeway to provide lender of last resort facilities and to absorb or distribute losses. That assessment is a reasonable one. But the risk of policy missteps cannot be ignored. Dominic Wilson Goldman Sachs Global Investment Research 10 March 5, 2014 Global Economics Weekly Global economic forecasts Real GDP, %ch yoy Consumer Prices, %ch yoy 2014 G3 USA Euro area Japan Advanced Economies Australia Canada France Germany Italy New Zealand Norway Spain Sweden Switzerland UK Asia China Hong Kong India Indonesia Malaysia Philippines Singapore South Korea Taiwan Thailand CEEMEA Czech Republic Hungary Poland Russia South Africa Turkey Latin America Argentina Brazil Chile Mexico Venezuela Regional Aggregates BRICS G7 EU27 G20 Asia ex Japan Central and Eastern Europe Latin America Emerging Markets Advanced Economies World 2015 2016 2017 2.9 1.2 1.0 3.2 1.5 1.2 3.0 1.7 1.5 3.0 1.6 1.4 2.0 2.6 0.9 2.0 0.6 3.1 1.8 0.9 3.6 1.9 2.9 2.6 2.7 1.1 2.1 1.0 2.1 2.0 1.2 3.4 2.1 2.7 3.6 2.0 1.4 2.2 1.2 2.4 1.7 1.7 2.8 1.9 3.0 3.9 1.9 1.8 1.6 1.3 2.3 1.7 1.7 2.7 1.7 3.0 7.6 3.7 5.0 5.5 4.5 6.3 3.7 3.7 3.8 3.0 7.8 4.4 6.2 6.0 5.2 6.5 4.2 3.8 3.9 4.7 7.6 3.7 6.6 6.0 5.0 6.3 4.0 4.0 3.8 5.0 7.4 4.0 6.9 6.0 5.0 6.3 4.0 3.8 3.8 5.0 1.7 1.8 2.9 3.0 2.4 2.0 2.4 1.9 3.2 3.6 2.9 1.8 2.6 2.2 3.4 3.6 3.6 5.8 2.4 1.9 3.2 3.7 3.5 5.0 1.7 2.1 3.5 3.3 -1.3 1.3 2.9 4.5 3.8 0.5 3.4 3.3 4.5 3.6 1.8 5.3 3.6 4.5 3.6 2.7 6.0 2.3 1.6 3.6 6.2 2.5 2.5 5.2 2.3 3.6 6.5 2.5 1.8 4.0 6.7 2.8 3.2 5.8 2.5 4.0 6.6 2.5 2.1 4.2 6.7 3.0 3.6 6.0 2.5 4.1 6.6 2.4 1.9 4.2 6.7 2.8 3.9 6.1 2.5 4.1 G3 USA Euro area Japan Advanced Economies Australia Canada France Germany Italy New Zealand Norway Spain Sweden Switzerland UK Asia China Hong Kong India Indonesia Malaysia Philippines Singapore South Korea Taiwan Thailand CEEMEA Czech Republic Hungary Poland Russia South Africa Turkey Latin America Argentina Brazil Chile Mexico Venezuela Regional Aggregates BRICS G7 EU27 G20 Asia ex Japan Central and Eastern Europe Latin America Emerging Markets Advanced Economies World 2014 2015 2016 2017 1.6 0.9 2.6 1.9 1.5 1.7 2.1 1.8 2.1 2.2 1.9 1.0 3.2 1.5 1.0 1.4 0.9 2.0 1.7 0.3 0.6 0.5 1.7 2.6 1.8 1.3 2.5 1.3 2.2 1.5 0.6 1.5 1.3 1.7 2.8 2.0 1.6 2.9 1.4 2.2 1.8 0.8 2.3 1.6 1.8 2.4 2.0 1.6 2.9 1.5 1.9 2.0 1.0 2.5 1.9 1.9 3.0 3.3 6.5 6.8 3.0 3.8 3.3 2.2 1.4 2.6 3.0 3.3 6.1 5.5 2.6 3.5 3.5 2.6 1.8 2.9 3.0 3.1 5.8 5.5 2.5 3.5 3.2 2.7 1.8 3.0 3.0 3.1 5.2 5.5 2.5 3.5 2.8 2.2 1.7 2.8 0.6 1.3 1.5 5.5 5.9 7.7 1.9 2.9 1.8 5.1 5.8 6.8 2.0 3.0 2.3 4.7 5.6 6.1 2.0 3.3 2.4 4.4 5.7 6.5 14.8 5.8 3.3 4.2 61.4 17.7 5.9 2.9 3.5 50.9 16.8 5.5 3.0 3.1 28.3 13.7 5.1 3.0 3.0 20.8 4.3 1.7 1.0 2.9 3.8 1.2 10.7 5.7 1.6 3.3 4.2 1.8 1.6 3.0 3.7 2.0 8.7 5.1 1.8 3.3 4.0 2.1 1.9 3.1 3.6 2.3 6.6 4.5 2.1 3.2 3.8 2.0 2.0 2.9 3.5 2.5 5.6 4.2 2.0 3.0 Source: Goldman Sachs Global Investment Research For India we use WPI not CPI. For a list of the members within groups, please refer to ERWIN. For our latest Bond, Currency and GSDEER forecasts, please refer to the Goldman Sachs 360 website: (https://360.gs.com/gs/portal/research/econ/econmarkets/). Goldman Sachs Global Investment Research 11 March 5, 2014 Global Economics Weekly Global macro and markets charts PMI-implied global growth 8 6 GLI momentum vs. global industrial production* 2 % qoq annl %mom 1 4 0 2 -1 0 -2 Global PMI ModelImplied Growth -2 -4 Global Actual Sequential Growth -3 -6 -8 GLI Momentum Global Industrial Production*, 3mma GS Forecast -4 03 04 05 06 07 08 09 10 11 12 13 14 15 00 01 02 03 04 05 06 07 08 09 10 11 13 See Global Economics Weekly 12/18 for methodology Source: OECD, Goldman Sachs Global Investment Research * Includes OECD countries plus BRICs, Indonesia and South Africa See Global Economics Paper 199 for methodology Source: OECD, Goldman Sachs Global Investment Research GLI ‘Swirlogram’ China, Europe and US risk factors 0.06% Recovery 0.04% Current Last Month Jul-13 0.02% GLI Acceleration Expansion May-13 Apr-13 Jun-13 Aug-13 0.00% 110 Index 105 100 Europe Risk Feb-14 Mar-13 -0.02% Jan-14 -0.04% Sep-13 95 China Risk US Risks 90 Oct-13 Dec-13 -0.06% Nov-13 Contraction -0.08% -0.2% -0.1% 0.0% 0.1% 0.2% 0.3% Slowdown 0.4% 0.5% GLI Momentum 85 80 Jan-13 Mar-13 May-13 Jul-13 Sep-13 Nov-13 Jan-14 Mar-14 See Global Economics Paper 214 for methodology Source: OECD, Goldman Sachs Global Investment Research See Global Economics Weekly 12/15 for methodology Source: Goldman Sachs Global Investment Research US equity risk premium US equity credit premium 6.5 5 % 6.1 14 % 4 5.7 US ERP, calculated daily 5.3 US ERP, 200 Day Moving Average 3 4.9 4.5 2 4.1 1 3.7 1985-1998 average Credit relatively expensive 0 3.3 2.9 -1 2.5 -2 2.1 1.7 04 05 06 07 08 09 10 11 12 See Global Economics Weekly 02/35 for methodology Source: Goldman Sachs Global Investment Research Goldman Sachs Global Investment Research 13 14 -3 2 standard deviations band 82 84 86 88 90 92 94 96 98 00 02 04 06 08 10 12 14 See Global Economics Weekly 03/25 for methodology Source: Goldman Sachs Global Investment Research 12 March 5, 2014 Global Economics Weekly The world in a nutshell THE GLOBAL ECONOMY OUTLOOK KEY ISSUES UNITED STATES We expect annual growth to accelerate to 2.9% in 2014 after 1.9% in 2013. Growth should then remain above trend in 2015 and 2016. On an annualised sequential basis, we expect growth of 1.8% in the first quarter of 2014 and 3.0%-3.5% for the rest of the year. We expect the US to lead the reacceleration in global growth in 2014. The rationale is a sharp reduction in fiscal drag, which should allow the continued recovery in underlying private-sector spending to translate into a stronger growth picture. In particular, we expect positive impulses from personal consumption and business fixed investment to add significantly to growth in 2014. JAPAN We expect real GDP growth of 1.0% in 2014 and 1.2% in 2015. On a sequential basis, we expect volatile growth over the coming quarters as forthcoming consumption tax hikes in 2014 and 2015 will affect personal consumption expenditures. We expect positive private demand dynamics to continue but worry about increased fiscal drag. Structurally, Japan is poised to reach above-trend growth rates in step with an improvement in the global economy. The new leadership at the BoJ has led to a regime shift in Japanese monetary policy, with much more aggressive, Fed-style easing capabilities. While this potentially offers a way out of more than a decade of deflation, reaching the 2% inflation target remains a tall order. EUROPE For the Euro area as a whole, we expect a return to positive growth of 1.2% in 2014, followed by 1.5% in 2015. The growth outlook at the country level looks friendlier than in 2013 but it still shows a divergent trajectory, with growth in Italy, Spain and France around or less than 1% and in Germany at 2%. At the same time, private-sector headwinds remain as banking lending standards have continued to tighten. We expect the Euro area to continue pulling out of recession, driven by modest improvements across all major components of domestic demand. Still, the list of necessary adjustments in the periphery remains long, ranging from cleaning up the banking system and labour market reform to increasing competitiveness. NON-JAPAN ASIA For Asia ex-Japan, we expect growth of 6.2% and 6.7% in 2014 and 2015, respectively. We expect the economies in the region to benefit from the stronger DM recovery in 2014, but with significant differentiation across countries. In China, we expect real GDP growth of 7.6% in 2014, and 7.8% in 2015. Although growth is slightly below trend, the recent tightening in financial conditions sends the signal that policymakers are willing to tolerate somewhat lower growth in order to tackle structural problems and foster more sustainable medium-term growth. LATIN AMERICA We forecast that real GDP growth in Latin America will be 2.5% in 2014 and 3.2% in 2015. Against a more favourable global backdrop, the divergence between those economies with more challenging (Brazil) and more stable (Mexico) policy outlooks is likely to increase. In Brazil, we expect real GDP growth of 2.1% in 2014, and 2.9% in 2015. Despite two consecutive years of sub-par growth, inflation has been sticky above the inflation target of 4.5%. BRL weakness will likely force the Copom to continue to hike policy rates. CENTRAL & EASTERN EUROPE, MIDDLE EAST AND AFRICA With growth across the region forecast at 2.9% in 2014 and 3.2% in 2015, we expect CEEMEA to continue to recover. Helped by improvements in external demand conditions, large output gaps provide fertile ground for recovery from the 2012 soft patch, although current account deficit countries in particular will continue to face stiff challenges. The EM differentiation theme is again visible across the region. While we forecast strong and steady growth in Israel and Russia, we see a similar recovery in Turkey as less sustainable. Growth in South Africa and Ukraine will likely be dragged down by idiosyncratic political and economic risks. CENTRAL BANK WATCH CURRENT SITUATION NEXT MEETINGS EXPECTATION UNITED STATES: FOMC The Fed funds rate is at 0%-0.25%. The Fed initiated a new round of asset purchases and extended its rate guidance on September 13, 2012. Mar. 19 Apr. 30 We expect the Fed to keep the funds rate near 0% through 2015, and to continue asset purchases until 3Q2014, albeit at a reduced pace. JAPAN: BoJ Monetary Policy Board The overnight call rate is at 0%-0.1%. The BoJ significantly extended asset purchases, as well as the related maturity horizon, on April 4, 2013. Mar. 11 Apr. 8 We expect the BoJ to keep the policy rate near 0% and to expand its monetary easing efforts through ongoing asset purchases. EURO AREA: ECB Governing Council The refi/deposit rates are at 0.25%/0.00%. The ECB announced the OMT programme for conditional purchases of Euro area sovereign bonds in Sept. 2012 and cut the refi rate by 25bp on Nov. 7, 2013. The BoE policy rate is currently at 0.5%. The BoE announced threshold-based forward guidance for the path of the policy rate on August 7, 2013. Mar. 6 Apr. 3 We expect the ECB to cut the MRO and deposit rate by 15bp at its April meeting. Mar. 6 Apr. 12 We expect the BoE to keep the policy rate unchanged until mid- 2015. UK: BoE Monetary Policy Committee Goldman Sachs Global Investment Research 13 March 5, 2014 Global Economics Weekly Disclosure Appendix Reg AC We, Dominic Wilson, Kamakshya Trivedi, Noah Weisberger, Aleksandar Timcenko, Jose Ursua, George Cole and Julian Richers, hereby certify that all of the views expressed in this report accurately reflect our personal views, which have not been influenced by considerations of the firm's business or client relationships. Disclosures Global product; distributing entities The Global Investment Research Division of Goldman Sachs produces and distributes research products for clients of Goldman Sachs on a global basis. Analysts based in Goldman Sachs offices around the world produce equity research on industries and companies, and research on macroeconomics, currencies, commodities and portfolio strategy. This research is disseminated in Australia by Goldman Sachs Australia Pty Ltd (ABN 21 006 797 897); in Brazil by Goldman Sachs do Brasil Corretora de Títulos e Valores Mobiliários S.A.; in Canada by either Goldman Sachs Canada Inc. or Goldman, Sachs & Co.; in Hong Kong by Goldman Sachs (Asia) L.L.C.; in India by Goldman Sachs (India) Securities Private Ltd.; in Japan by Goldman Sachs Japan Co., Ltd.; in the Republic of Korea by Goldman Sachs (Asia) L.L.C., Seoul Branch; in New Zealand by Goldman Sachs New Zealand Limited; in Russia by OOO Goldman Sachs; in Singapore by Goldman Sachs (Singapore) Pte. (Company Number: 198602165W); and in the United States of America by Goldman, Sachs & Co. Goldman Sachs International has approved this research in connection with its distribution in the United Kingdom and European Union. European Union: Goldman Sachs International authorised by the Prudential Regulation Authority and regulated by the Financial Conduct Authority and the Prudential Regulation Authority, has approved this research in connection with its distribution in the European Union and United Kingdom; Goldman Sachs AG and Goldman Sachs International Zweigniederlassung Frankfurt, regulated by the Bundesanstalt für Finanzdienstleistungsaufsicht, may also distribute research in Germany. General disclosures This research is for our clients only. Other than disclosures relating to Goldman Sachs, this research is based on current public information that we consider reliable, but we do not represent it is accurate or complete, and it should not be relied on as such. We seek to update our research as appropriate, but various regulations may prevent us from doing so. Other than certain industry reports published on a periodic basis, the large majority of reports are published at irregular intervals as appropriate in the analyst's judgment. Goldman Sachs conducts a global full-service, integrated investment banking, investment management, and brokerage business. We have investment banking and other business relationships with a substantial percentage of the companies covered by our Global Investment Research Division. Goldman, Sachs & Co., the United States broker dealer, is a member of SIPC (http://www.sipc.org). Our salespeople, traders, and other professionals may provide oral or written market commentary or trading strategies to our clients and our proprietary trading desks that reflect opinions that are contrary to the opinions expressed in this research. Our asset management area, our proprietary trading desks and investing businesses may make investment decisions that are inconsistent with the recommendations or views expressed in this research. The analysts named in this report may have from time to time discussed with our clients, including Goldman Sachs salespersons and traders, or may discuss in this report, trading strategies that reference catalysts or events that may have a near-term impact on the market price of the equity securities discussed in this report, which impact may be directionally counter to the analyst's published price target expectations for such stocks. Any such trading strategies are distinct from and do not affect the analyst's fundamental equity rating for such stocks, which rating reflects a stock's return potential relative to its coverage group as described herein. We and our affiliates, officers, directors, and employees, excluding equity and credit analysts, will from time to time have long or short positions in, act as principal in, and buy or sell, the securities or derivatives, if any, referred to in this research. This research is not an offer to sell or the solicitation of an offer to buy any security in any jurisdiction where such an offer or solicitation would be illegal. It does not constitute a personal recommendation or take into account the particular investment objectives, financial situations, or needs of individual clients. Clients should consider whether any advice or recommendation in this research is suitable for their particular circumstances and, if appropriate, seek professional advice, including tax advice. The price and value of investments referred to in this research and the income from them may fluctuate. Past performance is not a guide to future performance, future returns are not guaranteed, and a loss of original capital may occur. Fluctuations in exchange rates could have adverse effects on the value or price of, or income derived from, certain investments. Certain transactions, including those involving futures, options, and other derivatives, give rise to substantial risk and are not suitable for all investors. Investors should review current options disclosure documents which are available from Goldman Sachs sales representatives or at http://www.theocc.com/about/publications/character-risks.jsp. Transaction costs may be significant in option strategies calling for multiple purchase and sales of options such as spreads. Supporting documentation will be supplied upon request. All research reports are disseminated and available to all clients simultaneously through electronic publication to our internal client websites. Not all research content is redistributed to our clients or available to third-party aggregators, nor is Goldman Sachs responsible for the redistribution of our research by third party aggregators. For research or data available on a particular security, please contact your sales representative or go to http://360.gs.com. Disclosure information is also available at http://www.gs.com/research/hedge.html or from Research Compliance, 200 West Street, New York, NY 10282. © 2014 Goldman Sachs. No part of this material may be (i) copied, photocopied or duplicated in any form by any means or (ii) redistributed without the prior written consent of The Goldman Sachs Group, Inc. Goldman Sachs Global Investment Research 14
© Copyright 2026 ExpyDoc