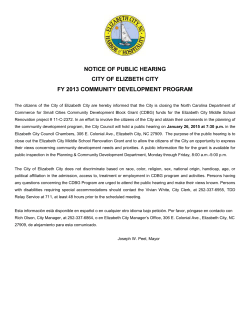
Hearing Research 312 (2014) 48e59
Contents lists available at ScienceDirect
Hearing Research
journal homepage: www.elsevier.com/locate/heares
Research paper
Tinnitus-related dissociation between cortical and subcortical neural
activity in humans with mild to moderate sensorineural hearing loss
Kris Boyen a, b, *, Emile de Kleine a, b, Pim van Dijk a, b, Dave R.M. Langers a, b, c
a
Department of Otorhinolaryngology/Head and Neck Surgery, University of Groningen, University Medical Center Groningen, The Netherlands
Graduate School of Medical Sciences, Research School of Behavioural and Cognitive Neurosciences, University of Groningen, The Netherlands
c
National Institute for Health Research (NIHR), Nottingham Hearing Biomedical Research Unit, University of Nottingham, Nottingham, UK
b
a r t i c l e i n f o
a b s t r a c t
Article history:
Received 17 October 2013
Received in revised form
21 February 2014
Accepted 4 March 2014
Available online 12 March 2014
Tinnitus is a phantom sound percept that is strongly associated with peripheral hearing loss. However,
only a fraction of hearing-impaired subjects develops tinnitus. This may be based on differences in the
function of the brain between those subjects that develop tinnitus and those that do not. In this study,
cortical and sub-cortical sound-evoked brain responses in 34 hearing-impaired chronic tinnitus patients
and 19 hearing level-matched controls were studied using 3-T functional magnetic resonance imaging
(fMRI). Auditory stimuli were presented to either the left or the right ear at levels of 30e90 dB SPL. We
extracted neural activation as a function of sound intensity in eight auditory regions (left and right
auditory cortices, medial geniculate bodies, inferior colliculi and cochlear nuclei), the cerebellum and a
cinguloparietal task-positive region. The activation correlated positively with the stimulus intensity, and
negatively with the hearing threshold. We found no differences between both groups in terms of the
magnitude and lateralization of the sound-evoked responses, except for the left medial geniculate body
and right cochlear nucleus where activation levels were elevated in the tinnitus subjects. We observed
significantly reduced functional connectivity between the inferior colliculi and the auditory cortices in
tinnitus patients compared to controls. Our results indicate a failure of thalamic gating in the development of tinnitus.
Ó 2014 The Authors. Published by Elsevier B.V. This is an open access article under the CC BY-NC-ND
license (http://creativecommons.org/licenses/by-nc-nd/3.0/).
1. Introduction
Tinnitus is a poorly understood hearing disorder characterized
by the presence of an auditory percept in the absence of an external
stimulus and is typically associated with hearing loss. It is a common disorder with prevalence estimates ranging from 7 to 20%
(Hoffman and Reed, 2004). Approximately 40% of the tinnitus patients also suffer from hyperacusis, a diminished tolerance to
Abbreviations: AC, auditory cortex; ANCOVA, analysis of covariance; BA, Brodmann area; BOLD, blood oxygenation level dependent; CER, cerebellum; CN,
cochlear nucleus; DMN, default mode network; fMRI, functional magnetic resonance imaging; EPI, echo planar imaging; FWE, family wise error; HI, hearingimpaired; HI þ T, hearing-impaired and tinnitus; IC, inferior colliculus; L, left; MGB,
medial geniculate body; MNI, Montreal neurological institute; PTA, pure-tone
average; R, right; ROI, region of interest; TPN, task-positive network; THI, tinnitus
handicap inventory
* Corresponding author. Department of Otorhinolaryngology/Head and Neck
Surgery, University of Groningen, University Medical Center Groningen, P.O. Box
30.001, 9700 RB Groningen, The Netherlands. Tel.: þ31 50 3613290; fax: þ31
503611698.
E-mail address: [email protected] (K. Boyen).
ordinary environmental sounds (Baguley, 2003). Most patients
with chronic tinnitus are continuously aware of the tinnitus
percept, but are able to cope effectively with the disturbance.
However, for some patients the tinnitus is more than a trivial
annoyance resulting in feelings of desperation and even suicidal
thoughts (Dobie, 2003).
An important role in the generation of tinnitus is currently
attributed to mechanisms in the central auditory system. Animal
studies have shown that manipulations that are known to be
sources of tinnitus in humans (e.g. noise trauma) cause increased
spontaneous neural activity or changes in neural synchrony in
auditory brain structures (Noreña and Eggermont, 2003; Seki and
Eggermont, 2003). A number of blood oxygenation level dependent (BOLD) functional magnetic resonance imaging (fMRI) studies
have investigated the neural correlates of tinnitus in humans (for a
review, see Lanting et al., 2009; Adjamian et al., 2009). BOLD fMRI is
unable to register sustained increases in spontaneous activity.
Consequently, these fMRI studies applied sound stimuli to probe
abnormal sound processing in the brain of tinnitus patients.
Measuring changes in hemodynamics as a response to sound in
tinnitus sufferers revealed increased activation in the inferior
http://dx.doi.org/10.1016/j.heares.2014.03.001
0378-5955/Ó 2014 The Authors. Published by Elsevier B.V. This is an open access article under the CC BY-NC-ND license (http://creativecommons.org/licenses/by-nc-nd/3.0/).
K. Boyen et al. / Hearing Research 312 (2014) 48e59
colliculus compared to controls (Melcher et al., 2000, 2009; Lanting
et al., 2008), although this may have been associated with hyperacusis rather than with tinnitus (Gu et al., 2010). In contrast to
activation of the brainstem, elevated sound-evoked auditory cortex
activation can be attributed to tinnitus (Gu et al., 2010). These
studies all show neural correlates of tinnitus in clinically normalhearing subjects.
The majority of tinnitus patients, however, has a significant
hearing loss. As was shown in numerous animal studies, hearing
loss is associated with adaptation in the central auditory system,
which is likely to be related to tinnitus (for a review, see Eggermont,
2001). Since tinnitus does not develop in all hearing-impaired individuals, it must be assumed that these adaptations are different
between those that develop tinnitus and those that do not. So far,
differences in adaptations are supported by two models on the
pathophysiology of tinnitus: one based on abnormal thalamic
gating (Rauschecker et al., 2010; Zhang, 2013) and another based on
thalamic hypo-activity (Llinás et al., 1999).
The aim of this explorative study was to investigate tinnitusrelated abnormalities in sound-evoked hemodynamic responses
in subjects with mild to moderate sensorineural hearing loss. Two
relatively large subject groups were enrolled: a hearing-impaired
group without tinnitus and a hearing-impaired group suffering
from tinnitus. Both groups were carefully matched with respect to
age and hearing loss, which allows us to identify the effects that
are specific to tinnitus. In line with previous studies (Melcher
et al., 2000, 2009; Lanting et al., 2008; Gu et al., 2010), we used
BOLD fMRI to measure sound-evoked responses throughout the
brain, and primarily focused on auditory regions since we used
auditory stimuli. Differences between both groups were investigated with respect to the magnitude of brain responses, their
lateralization, and the functional connectivity patterns between
brain regions.
2. Materials and methods
2.1. Subjects
This study included data collected from two groups of patients.
The patients were recruited at the University Medical Center Groningen and via hearing aid dispensers in Groningen, the
Netherlands. The first group comprised 19 hearing-impaired subjects (HI group). The second group comprised 34 subjects with a
hearing impairment suffering from tinnitus (HI þ T group). From
the same subjects, the T1 anatomical scans of 16 HI and 31 HI þ T
subjects have also been included in a previous morphological study
(Boyen et al., 2013). Pure-tone audiometry was performed with a
clinical audiometer using six different octave frequencies (0.25, 0.5,
1, 2, 4 and 8 kHz). For all subjects, the pure-tone average (PTA)
hearing threshold at the octave frequencies of 1, 2 and 4 kHz
satisfied 30 PTA 60 dB in both ears.
To assess handedness, a translated version of the Edinburgh
Inventory (Oldfield, 1971) was completed by all subjects. In the
tinnitus subjects only, tinnitus handicap was assessed by a Dutch
translation of the Tinnitus Handicap Inventory (THI), a selfreported tinnitus handicap questionnaire (Newman et al., 1996).
In order to assess the presence of hyperacusis, a translated version
of the Hyperacusis Questionnaire (HQ; Khalfa et al., 2002) was
administered to all participating subjects. Furthermore, the subjectively perceived tinnitus loudness was recorded on a numeric
rating scale from zero (tinnitus not audible at the time) to ten
(tinnitus sounds as loud as imaginable) before and immediately
after the scanning session. None of the subjects had any major
medical, neurological or psychiatric history.
49
This study was approved by the local medical ethics committee.
All subjects were informed about the purpose of the study before
giving their written consent in accordance with Dutch legislation.
2.2. Data acquisition
The imaging experiments were performed using a 3-T MRI
system (Philips Intera, Philips Medical Systems, Best, The
Netherlands) which was equipped with an eight-channel phasedarray (SENSE) head coil. The functional scans consisted of 2200-ms
single-shot T2* -sensitive echo planar imaging (EPI) sequences with
41 3-mm thick slices (TR 10 s; TE 22 ms; flip-angle 80 ; voxel size
1.75 1.95 3 mm3; field of view 224 224 123 mm3) and were
acquired using a near-coronal orientation, aligned to the brainstem
when viewed on a midsagittal cross-section. Each image volume
enclosed left and right cochlear nuclei (CN), inferior colliculi (IC),
medial geniculate bodies (MGB) and auditory cortices (AC). The
influence of acoustic scanner noise was reduced using a sparse
sampling strategy (Hall et al., 1999; Langers et al., 2005a). Auditory
stimuli were presented during a 7.8-s gap of scanner silence between two successive acquisitions. For each subject, three runs of
73 acquisitions were performed. Additional start-up scans that
were included to achieve magnetization equilibrium and to trigger
the start of the stimulus delivery were excluded from analysis. In
addition, a 3-dimensional high-resolution T1-weighted fast-field
echo scan (TR 9 ms; TE 3.50 ms; flip-angle 8 ; voxel size
1 1 1 mm3; field of view 256 256 170 mm3) was acquired
with the same orientation as the functional scans to serve as an
anatomical reference.
2.3. Acoustic stimulation and scanning paradigm
Auditory stimuli were delivered by an MR-compatible electrodynamic system (MR Confon GmbH, Magdeburg, Germany;
Baumgart et al., 1998), connected to a PC setup equipped with a
digital-to-analog converter controlled by Labview 6.1 (National
Instruments 6052E, National Instruments Corporation, Austin, TX,
USA). The stimuli consisted of dynamic ripples (Langers et al.,
2003). The spectrum of a dynamic ripple is based on pink noise,
but contains temporal and spectral modulations. The stimuli
comprised frequency components between 125 and 8000 Hz, with
a spectral modulation density of one cycle per octave, a temporal
modulation frequency of two cycles per second, and a modulation
amplitude of 80%. These stimuli were chosen for their potency to
induce robust sound-evoked responses in the auditory pathway
(Langers et al., 2003; Lanting et al., 2008, 2010).
During the gaps of scanner silence between two successive acquisitions, auditory stimuli were presented to the left (L) or the
right (R) ear at either 30, 50, 70 or 90 dB SPL (L30, L50, L70, L90; R30,
R50, R70 or R90). In addition, a silent baseline condition was
included. The stimuli were presented in a fixed pseudo-random
order in each functional run. Per run, the silent condition was
presented nine times and all the stimulus conditions were presented eight times each. During the functional scans, the subjects
were instructed to register whether they perceived an audible
stimulus using a button box: whenever they perceived an audible
stimulus in the left or right ear, they pressed one of two corresponding buttons with their right thumb. This task was imposed in
order to promote and monitor that the subject paid attention to the
presented sound stimuli.
2.4. Data processing and linear regression analysis
The images were analyzed using SPM8 (Functional Imaging
Laboratory, The Wellcome Department of Imaging Neuroscience,
50
K. Boyen et al. / Hearing Research 312 (2014) 48e59
London, UK, http://www.fil.ion.ucl.ac.uk/spm/) and MatLab 7.1 (The
Mathworks Inc., Natick, MA). The functional images were first
corrected for motion using realignment on the basis of 3-D rigid
body transformations. The T1-weighted high-resolution anatomical
images were spatially co-registered to the functional images, and
all images were normalized into Montreal Neurological Institute
(MNI) stereotaxic space. To improve the signal-to-noise ratio, the
functional data were spatially smoothed using an isotropic
Gaussian kernel with a full width at half maximum of 4 mm. In
order to express the signal measures in percentage signal change, a
logarithmic transformation was carried out (Langers and van Dijk,
2011). The functional images were interpolated to voxel dimensions of 2.0 2.0 2.0 mm3.
Per subject, a general linear model was set up to analyze the
relative contribution of each condition to the measured response.
The model included one covariate for each of the eight stimulus
conditions, the realignment parameters, as well as constant and
linear terms to model the baseline and drift within each run. An
omnibus F-test, including contrasts of all individual stimulus conditions relative to baseline, was assessed in each voxel to detect the
combined effect of all sound stimuli. The confounds (i.e. baseline,
drift and realignment) that were estimated were subtracted from
the preprocessed functional acquisitions for the purpose of subsequent connectivity analyses.
The contrast images of the eight sound conditions of interest,
relative to the silent condition, were entered in a second-level
random-effects analysis based on a flexible factorial design with
factors for group (i.e. HI þ T and HI), subject, and stimulus condition. Significant responses to all sound conditions across all subjects were detected by means of an F-test.
2.5. ROI definitions and functional connectivity
Eight regions of interest (ROIs) were defined, comprising both
left and right auditory cortex (AC), medial geniculate body (MGB),
inferior colliculus (IC) and cochlear nucleus (CN). The ROIs of the
left and right AC, MGB and IC were defined by means of the outcomes of the second-level random-effects analysis (see Results).
The AC ROI comprised all supra-threshold voxels in the temporal
lobe (F7.357 > 6.53; p < 0.05 corrected for family-wise errors). The
MGB and IC ROIs were drawn to include a cluster of suprathreshold voxels around the correspondingly localized activation
maxima. Because no activation of the left or right CN was found,
these ROIs were defined as a sphere with a radius of 5 mm positioned at MNI coordinates (10, 38, 45) consistent with a previous publication of our group (Boyen et al., 2013).
Next, functional connectivity analysis was performed. Functional connectivity examines the correlations among activity in
different brain areas (Friston, 1994; Smith et al., 2009). Time
courses were determined for all auditory ROIs by averaging the
preprocessed hemodynamic signals of all voxels in the respective
ROI and concatenating them across all subjects. For each ROI, a
functional connectivity map was derived by calculating the Pearson
correlation coefficients R between the time course of the respective
ROI and the time courses of all other voxels in the brain.
Based on the group connectivity maps (see Section 3.3), two
more ROIs were included: the cerebellum (CER) and a task-positive
network (TPN) region, a term adopted from, inter alia, Fox et al.
(2005). The ROI of the CER consisted of the anterior and posterior
cerebellar lobes. The TPN comprised the bilateral cingulate cortex,
the primary somatosensory cortex (Brodmann Areas (BAs) 1, 2 and
3), the primary motor cortex (BA 4) and the supplementary motor
area (BA 6). Both ROIs (CER and TPN) were defined according to the
WFU_pickatlas (Maldjian et al., 2003).
Table 1
Subjects’ characteristics. Hearing loss was measured as the pure-tone average (PTA)
hearing threshold at the octave frequencies 1, 2 and 4 kHz. The mean values with
standard deviation are listed. HI þ T: hearing impairment accompanied by tinnitus;
HI: hearing-impaired; THI: Tinnitus Handicap Inventory; HQ: Hyperacusis
Questionnaire.
HI þ T (n ¼ 34)
HI (n ¼ 19)
Age
Years
Range
57 10
31e75
62 12
44e84
Gender
Male
Female
21
13
16
3
Handedness
Right
Left
Ambidextrous
28
2
4
16
1
2
Hearing loss (dB HL)
Right ear
Left ear
41 8
42 10
44 11
45 8
HQ score (0e42)
Score
Range
20 7
5e33
15 8
2e30
THI score (0e100)
Score
Range
31 22
4e72
e
e
2.6. Response amplitudes and lateralization of regions-of-interest
For each subject, the 10% most strongly responding voxels
within each ROI according to the individual F-test were selected
(see Table 3), and per condition the signal change relative to
baseline was averaged over these voxels. Following previous
studies (Langers et al., 2005b; Lanting et al., 2008; NormanHaignere et al., 2013), we chose to use a fixed percentage of voxels instead of a fixed significance threshold because differences in
significance values across subjects are partly driven by nonspecific
differences in signal-to-noise ratio that are unrelated to neural
activity. Statistical analyses were performed using a repeated
measures ANCOVA model for each ROI separately. In addition to the
factors for group, subject and stimulus condition that were
included in the second-level random-effects model already, this
model included the subject’s PTA hearing loss in the ear of stimulus
presentation as a covariate. The main effects of group and stimulus
condition and the interaction between these two factors were
determined. In addition, we tested whether neural activation in
response to the stimuli co-varied with the amount of hearing loss in
the ear of presentation.
For each ROI of each subject, the average response to all stimuli
presented to the left (L) and the right (R) ear, respectively, was
calculated. The values obtained were used to calculate a lateralization index
Table 2
Number of times that the button was pressed, expressed in percentages. The percentages are shown for each group and each stimulus condition, respectively. HI þ T:
hearing-impaired chronic tinnitus patients; HI: hearing level-matched controls
without tinnitus.
HI þ T
30
50
70
90
dB
dB
dB
dB
SPL
SPL
SPL
SPL
HI
Left ear [%]
Right ear [%]
Left ear [%]
Right ear [%]
14
52
95
100
19
53
94
100
16
58
100
100
8
52
95
100
K. Boyen et al. / Hearing Research 312 (2014) 48e59
51
Table 3
Results of the regression analysis and repeated measures ANCOVA for each ROI. The number of the 10% most strongly responding voxels (N), the regression coefficients (b) of
the activation as a function of the left and right ear stimulus level and the hearing loss in the stimulated ear and the significance (p) of each factor (G: group; S: stimulus; G S:
groupestimulus interaction) or covariate (HL: the subject’s PTA hearing loss in the ear of stimulus presentation) according to an ANCOVA are listed. Significant results
(p < 0.05) are underlined. AC: auditory cortex; MGB: medial geniculate body; IC: inferior colliculus; CN: cochlear nucleus; TPN: task-positive network; CER: cerebellum.
Left AC
Right AC
Left MGB
Right MGB
Left IC
Right IC
Left CN
Right CN
TPN
CER
LI ¼
N [2 2 2 mm3]
Regression coefficient, b [103%/dB SPL]
Significance, p [e]
Left ear
Right ear
Hearing loss
G
S
GS
HL
499
453
31
27
12
15
8
8
17,402
2241
20
32
5.1
7.0
3.4
5.6
4.4
3.8
5.8
6.4
32
19
5.9
3.5
6.5
3.3
4.4
3.7
5.4
6.3
6.3
2.1
7.2
6.2
5.4
0.84
7.5
13.9
2.7
4.9
0.74
0.62
0.021
0.08
0.23
0.39
0.15
<0.001
0.74
0.14
<0.001
<0.001
<0.001
<0.001
<0.001
<0.001
0.046
0.15
<0.001
<0.001
0.50
0.67
0.36
0.45
0.42
0.45
0.50
0.59
0.46
0.52
0.14
0.63
<0.001
0.002
0.001
0.62
0.004
<0.001
0.15
0.003
LR
jLj þ jRj
For positive responses, a value of þ1 indicates a response to
stimuli presented at the left ear only, whereas a value of 1 indicates a response to right-ear stimuli only. Group differences for
the individual ROIs were tested for by means of two-tailed twosample t-tests.
2.7. Network analysis
Pairwise Pearson correlations were calculated as a measure of
functional connectivity between the various ROIs. For this analysis,
the previously defined unilateral auditory ROIs were combined to
bilateral ROIs because homologous areas in both hemispheres are
known to be highly correlated. Within each of the six ROIs (four
auditory ROIs, CER and TPN), the signals of the 10% most active
voxels were averaged for each point in time (i.e. scan). The obtained
fMRI time courses were transformed to zero mean and unit variance for each subject. Per group, these arrays were concatenated
across the subjects belonging to the HI þ T group and HI group
respectively, resulting in a matrix XHIþT of 10 time courses of 7446
elements in time (34 subjects 219 time points) and a matrix XHI of
10 time courses with each 4161 elements in time (19 subjects 219
time points).
Bootstrapping (Wu, 1986; Liu, 1988) was performed to test
whether the correlation coefficients between the six ROIs were
significantly different from zero within each group separately. In
order to obtain a null-distribution for the correlation coefficients,
the time courses of random subsets of runs (consisting of 73 points
in time) were repeatedly negated for each ROI independently. For
each iteration, a Pearson correlation between pairs of ROIs was
calculated. A total of 50 000 iterations was performed to produce a
null distribution. The obtained null-distribution was used to assess
whether significance was reached (p < 0.05). A Bonferroni correction was applied for the total number of 15 connections in the
model.
Non-parametric permutation tests (Good, 2002; Nichols and
Holmes, 2002) were performed to test whether the correlation
coefficients were significantly different between the subjects
groups. A null distribution was obtained by randomly reassigning
subjects to the two groups, while retaining the original group sizes.
A total of 50 000 permutations was performed. For each iteration,
the difference between the correlation coefficients was calculated.
The obtained null-distribution was used to assess the significance
of group difference (p < 0.05). A Bonferroni correction was applied
for the total number of 15 connections in the model.
3. Results
3.1. Subject characteristics
The subjects included in this study had mild to moderate
sensorineural hearing loss (see Fig. 1). Statistical analyses of group
differences were performed by means of a two-tailed two-sample
t-test (hearing thresholds and age) or a Fisher’s exact test (gender
and handedness). Statistical analysis of the hearing threshold at
each of the octave frequencies (0.25, 0.5, 1, 2, 4 and 8 kHz,
respectively) did not show significant differences between the
subjects with and those without tinnitus (p > 0.05). An exact
distribution-free test comparing two multivariate distributions
(Rosenbaum, 2005) did not show significant differences in audiometric shape between both groups (p ¼ 0.73), indicating that both
groups were well matched in their mean audiometric thresholds as
well as in their deviations from the mean. The two groups did not
differ in age (p ¼ 0.07), gender (p ¼ 0.12), and handedness
(p ¼ 1.00). The HQ was filled out by all but two subjects belonging
to the HI þ T group. A significant difference between both groups
was found (p ¼ 0.024), with the HI þ T group having higher scores
relative to the HI group. Moreover, a correlation between the THI
and HQ scores was found (R ¼ 0.61; p < 0.001). Details of the
participants’ characteristics are listed in Table 1.
In both groups, the number of participating women is lower
than the number of participating men, which is representative of
the prevalence of tinnitus and hearing loss in the general population (Lockwood et al., 2002). Age was significantly correlated with
hearing loss (regression coefficient m ¼ 0.30 dB/yr; p ¼ 1.9 104).
Out of the 34 tinnitus subjects, 25 subjects perceived tinnitus in
both ears, seven subjects perceived tinnitus only in the left ear and
two subjects perceived tinnitus only in the right ear. The tinnitus
subjects suffered from chronic continuous tinnitus for at least one
year up to 29 years. The subjectively perceived tinnitus loudness, as
measured with a rating scale from zero to ten, was slightly but not
significantly (p ¼ 0.52) increased after scanning the subjects
(5.5 1.9; mean SD) as compared to before the scan session
(5.2 2.0) (see Fig. 2).
During the functional scans, the subjects were instructed to press
a button whenever they perceived an audible stimulus in the left or
right ear. For each stimulus condition, Table 2 lists the percentage of
times that the button was pressed by the subjects of a group.
3.2. Sound-evoked responses
The significant responses to the auditory stimuli are visualized
in Fig. 3. Based on the F-test clear significant responses were
52
K. Boyen et al. / Hearing Research 312 (2014) 48e59
Hearing Level (dB HL)
Right Ear
Left Ear
0
0
10
10
20
20
30
30
40
40
50
50
60
60
70
70
80
80
90
90
100
250 500 1000 2000 4000 8000
100
250 500 1000 2000 4000 8000
Frequency (Hz)
Frequency (Hz)
HI+T
HI
0
Right Ear
Left Ear
0
40
60
80
100
120
Left Ear
20
Hearing Level (dB HL)
Hearing Level (dB HL)
20
Right Ear
40
60
80
100
0.25 0.50 1.0 2.0 4.0 8.0
0.25 0.50 1.0 2.0 4.0 8.0
Frequency (kHz)
Frequency (kHz)
120
0.25 0.50 1.0 2.0 4.0 8.0
Frequency (kHz)
0.25 0.50 1.0 2.0 4.0 8.0
Frequency (kHz)
Fig. 1. Audiograms. a. Mean audiograms for the HI þ T group (solid line) and HI group (dashed line). The error bars indicate the group standard deviations around the mean. b.
Individual audiograms for the HI þ T group. c. Individual audiograms for the HI group. HI þ T: hearing impairment accompanied by tinnitus; HI: hearing-impaired subjects without
tinnitus.
detected in the AC, MGB and IC. Responses in the CN did not reach
significance. Additionally, significant responses in the parietal lobe
and cerebellum were detected.
3.3. Functional connectivity maps
Pearson correlation coefficients were computed between the
time course of each auditory seed ROI and the time courses of all
voxels in the brain. The resulting maps, thresholded at an arbitrary
level of R ¼ 0.25, are presented in Fig. 4. The left and right AC are
strongly correlated to voxels in the thalamus (MGB) and the
midbrain (IC), but not with the lower brainstem (CN). The thalamus
is connected to voxels in both the cortex and the midbrain and
lower brainstem. Correspondingly, the regions in the midbrain and
lower brainstem are connected to voxels in the thalamus, but not
the cortex.
The auditory cortex and, to a lesser extent, the thalamus show
extensive time course correlations with voxels in the cerebellum,
pericentral gyri and cingulate cortex. Moreover, the CN shows some
time course correlations with voxels in the cerebellum. These regions were additionally included as two large separate ROIs (i.e.
CER and TPN) in the ROI analysis and network analysis that
followed.
3.4. Region-of-interest analysis
We performed ROI analyses on the eight ROIs in the auditory
pathway and the two additional ROIs as defined following the seedROI connectivity maps. For each ROI, the mean percentage signal
change for the various stimulus levels compared to baseline in both
groups are shown in Fig. 5. In general, louder stimuli yielded larger
responses in all ROIs. The TPN and CER showed a plateau effect:
responses increased until the stimulus level equaled 70 dB, and
subsequently remained at a similar level for the 90-dB stimulus.
For all ROIs, the regression coefficients of the activation as a
function of the left and right ear stimulus level were positive
K. Boyen et al. / Hearing Research 312 (2014) 48e59
In the non-auditory areas (TPN and CER), stimulus condition had a
significant effect on the response, but hearing loss only affected the
response in the CER. We also tried two alternative models in which
THI, respectively HQ, was included as a covariate instead of hearing
loss, but found no significant effects related to tinnitus, respectively
hyperacusis, severity.
Fig. 6 shows the lateralization index for each ROI. The lateralization indices for both groups show a clear contralateral stimulus
preference for the bilateral AC, MGB and IC. The right CN was
ipsilaterally lateralized in both groups, whereas the left CN was not.
The differences between the subject groups did not reach significance. For all nuclei, except the left MGB and bilateral CN, the HI
group showed a stronger lateralization toward the left ear,
compared to the HI þ T group. The CER and TPN tended to lateralize
to the left ear.
10
9
8
7
After scanning
53
6
5
4
3
2
3.5. Network analysis
1
0
0
1
2
3
4
5
6
7
8
9
10
Before scanning
Fig. 2. Tinnitus loudness ratings before and after scanning. The ratings were measured
by means of a numeric rating scale from zero (tinnitus not audible at the time) to ten
(tinnitus sounds as loud as imaginable).
(Table 3). These positive slopes (b values) were significant for all
ROIs except the right CN. For hearing loss, a negative regression
coefficient was found in all auditory ROIs. Significance was reached
in the CER and all auditory subcortical ROIs, except the right IC.
The repeated measures ANCOVA of the ROI responses (Table 3)
showed no effect of subject group (HI vs. HI-T) except in the right
CN and left MGB. A significant effect of stimulus condition was
found in all ROIs except the right CN. In all subcortical auditory ROIs
except the right IC, hearing loss had a significant effect on the responses. There was no effect of hearing loss in the auditory cortex.
An overview of the functional connections for both groups is
given in Fig. 7. All possible pairs of ROIs resulted in a significant
positive correlation (Bonferroni-corrected p < 0.05). Successive
connections within the auditory pathway tended to be stronger
than non-successive connections. The nuclei of the brainstem (CN
and IC) were relatively strongly correlated with each other and with
the thalamus (MGB). The cortex (AC and TRN) and the thalamus
were strongly correlated as well. However, the correlations between the cortex and the brainstem were relatively weak. In other
words, the correlation analysis showed two clusters of auditory
centers, with the thalamus belonging to both clusters. In both
groups, the CER as well as the TPN showed the strongest connectivity with the auditory pathway at the level of the cortex. Thus, the
CER and the TPN seem to belong to the corticothalamic cluster.
Furthermore, the CER and the TPN were mutually highly correlated
in both groups (HI þ T: R ¼ 0.72; HI: R ¼ 0.74).
The significant difference between the HI þ T and HI groups
concerning the functional correlations is indicated by the white
squares in Fig. 7. The correlation between the AC and the IC was
Fig. 3. Coronal, axial and sagittal cross-sections of the brain showing significant responses to sound across all stimulus conditions and all subjects by means of an F-test. In each
image, the activation in 11 contiguous slices was projected on an anatomical background. The redeyellow color-coded areas indicate areas with a significant response; auditory
cortex (1), medial geniculate body (2), inferior colliculus (3), cerebellum (4) and parietal region (5). The threshold was set at p < 0.05, corrected for family-wise errors (FWE). (For
interpretation of the references to color in this figure legend, the reader is referred to the web version of this article.)
54
K. Boyen et al. / Hearing Research 312 (2014) 48e59
Fig. 4. Functional connectivity maps across all subjects. Eight auditory regions of interest (ROIs) were defined (indicated with the white arrows). Pearson correlation coefficients R
were calculated between the time courses of the ROIs and those of every voxel in the brain. The correlation coefficients were thresholded at a level of 0.25, and overlaid on coronal,
axial and transversal cross-sections. The redeyellow color-coded areas indicate functionally connected voxels with the respective ROI. Each ROI highly correlated with its constituent voxels and is thus yellow-colored. AC: auditory cortex; MGB: medial geniculate body; IC: inferior colliculus; CN: cochlear nucleus. (For interpretation of the references to
color in this figure legend, the reader is referred to the web version of this article.)
significantly higher in the HI group than in the HI þ T group
(Bonferroni-corrected p ¼ 0.05).
4. Discussion
4.1. Sound-evoked responses in the central auditory system
Using a 3-T MRI system, activation due to sound stimulation
could be detected in multiple regions in the central auditory system
of hearing-impaired subjects, including the auditory cortices (AC)
in the temporal lobes, the medial geniculate nuclei (MGB) in the
thalamus and the inferior colliculi (IC) in the midbrain (Fig. 3).
Although our sample of participants was large, no activation could
be identified in the lower brainstem (CN) by means of the secondlevel random-effects analysis. CN activation was only detectable by
means of an ROI analysis.
The ROI analysis revealed a clear level-dependency in the cortex,
thalamus and midbrain (Fig. 5 and Table 3). The response in each of
the auditory brain areas increased with increasing intensity of the
sound stimulus, which is in agreement with earlier findings (Hall
et al., 2001; Sigalovsky and Melcher, 2006; Langers et al., 2007a;
Ernst et al., 2008; Lanting et al., 2008; Röhl and Uppenkamp,
2012). In normal-hearing subjects, the relation between brain
activation and intensity [expressed in dB] is essentially linear in the
auditory pathway (Langers et al., 2007a; Röhl and Uppenkamp,
2012). In this study, we found some indications of saturation at
loud sound intensity in brainstem and thalamus responses in the
hearing-impaired subjects without tinnitus (Fig. 5). Possibly, this
difference is related to the reduced dynamic range (‘recruitment’)
that is associated with sensorineural hearing loss.
Activation in the AC, MGB and IC occurred most strongly in
response to stimulation of the contralateral ear (Figs. 5 and 6;
Table 3). The AC is principally involved in the processing of
K. Boyen et al. / Hearing Research 312 (2014) 48e59
Signal Change [%]
Left AC
Right AC
2
2
1.5
1.5
1
1
0.5
0.5
Right MGB
Signal Change [%]
Left MGB
0.6
0.6
0.4
0.4
0.2
0.2
0
0
-0.2
-0.2
Signal Change [%]
Left IC
Right IC
0.6
0.6
0.4
0.4
0.2
0.2
0
0
-0.2
-0.2
Left CN
Signal Change [%]
HI+T
HI
0
0
Right CN
0.6
0.6
0.4
0.4
0.2
0.2
0
0
-0.2
-0.2
CER
Signal Change [%]
55
0.6
0.6
0.4
0.4
0.2
0.2
TPN
0
0
L30 L50 L70 L90 R30 R50 R70 R90
L30 L50 L70 L90 R30 R50 R70 R90
Fig. 5. The sound-evoked response amplitudes measured in ten ROIs. For each subject group separately, the response averaged across the group is plotted. Hearing-impaired
subjects with tinnitus (HI þ T): solid lines. Hearing-impaired subjects without tinnitus (HI): dashed lines. The error bars indicate the group standard errors around the mean.
AC: auditory cortex; MGB: medial geniculate body; IC: inferior colliculus; CN: cochlear nucleus; CER: cerebellum; TPN: Task-positive network.
56
K. Boyen et al. / Hearing Research 312 (2014) 48e59
majority of the tinnitus subjects reported nonlateralized tinnitus.
Unfortunately, these differences are hard to interpret at present.
HI+THI
Left nuclei
Right nuclei
CER/TPN
4.2. Functional connectivity patterns in the cortical, thalamic and
subcortical regions
0.5
Lateralization Index
0.4
Left ear
A functional connectivity analysis was performed. Functional
connectivity is a statement about observed correlations between
the patterns of activity in two brain areas (Friston, 1994; Smith
et al., 2009). We observed that for all connections between ROIs
in the model, significantly non-zero Pearson correlation coefficients were found (Fig. 7). Such a correlation does not necessarily indicate a direct connection between two correlated brain
areas. It does not comment on how these correlations are mediated.
In the present study, functional connectivity is likely to be substantially stimulus-induced or task-related. Since functional connectivity reflects the temporal correlation between pairs of time
signals from two spatially remote areas (Friston, 1994), much of the
correlation could be driven by the experimental paradigm. The
experimental paradigm consisted of auditory stimuli, which may
explain the high correlations between the auditory ROIs. Additionally, the subjects were instructed to press a button when an
auditory stimulus was heard, which may explain the high correlations between the auditory and non-auditory ROIs.
The functional connectivity analysis showed two clusters of
brain structures (Fig. 7). Those brain structures were mutually
correlated within the respective cluster. The first cluster consisted
of the brainstem and thalamic nuclei, which showed highly
correlated activity patterns. The second cluster contained the
thalamic and cortical areas. The activity in these areas showed a
highly correlated response as well. Thus, the thalamus is part of
both clusters, which is consistent with a function as a relay station
between the brainstem and cortex (Langers and Melcher, 2011).
The observed clustering could be related to temporal differences
of the response properties of the various brain areas (for a review,
see Eggermont, 2001). While subcortical regions show a sustained
response to sound stimuli, thus faithfully follow the sound on/off
periods, the cortex mainly responds to the onset and offset of a
stimulus, thus shows peaked activations at stimulus transitions
(Harms and Melcher, 2003; Sigalovsky and Melcher, 2006). Correlations among centers with similar responses will be high, while
responses between centers with different types of neural responses
will be comparatively weak. We are unable to distinguish between
0.3
0.2
0.1
0
−0.1
−0.2
−0.3
−0.4
Right ear
−0.5
AC
MGB
IC
CER
CN
TPN
Fig. 6. The lateralization indices for the left hemispheric auditory ROIs (blue) and the
right hemispheric auditory ROIs (red), the cerebellum and the task-positive network. A
lateralization index > 0 indicates a response mainly to left-ear stimuli, whereas a
lateralization index < 0 indicates a response mainly to right-ear stimuli. The error bars
indicate the group standard errors around the mean. HI þ T: hearing impairment
accompanied by tinnitus; HI: hearing-impaired subjects; AC: auditory cortex; MGB:
medial geniculate body; IC: inferior colliculus; CN: cochlear nucleus; CER: cerebellum;
TPN: Task-positive network. (For interpretation of the references to color in this figure
legend, the reader is referred to the web version of this article.)
contralateral stimuli resulting in a distinctly contralateral response
preference upon monaural stimulation (Scheffler et al., 1998;
Suzuki et al., 2002; Langers et al., 2005a, 2007b; Lanting et al.,
2008; Amaral and Langers, 2013). Correspondingly, for the
subcortical brain areas (except the CN), the average responsiveness
to the contralateral ear is larger than that to stimulation of the
ipsilateral ear (see also, Melcher et al., 2000; Langers et al., 2005b;
Lanting et al., 2008).
The lateralization of responses was stronger in the controls,
although this difference was not significant (Fig. 6). Also, the
enhanced sound-evoked activations in the right CN and left MGB of
tinnitus patients suggest that there are differences in the subcortical areas between tinnitus subjects and controls. Notably, the
HI+T
HI
CN
CN
IC
IC
MGB
MGB
AC
AC
TPN
TPN
CER
CER
R
1
0.5
0
CER
TPN
AC
MGB
IC
CN
−0.5
CER
TPN
AC
MGB
IC
CN
−1
Fig. 7. Functional connectivity patterns in the HI þ T and the HI group. The color-coding indicates the value of the coefficient of the Pearson correlations (R) between the respective
ROIs. Correlation coefficients were significantly different between both groups for the connection between the IC and AC (indicated by a white outlined square). HI þ T: hearing
impairment accompanied by tinnitus; HI: hearing-impaired subjects; AC: auditory cortex; MGB: medial geniculate body; IC: inferior colliculus; CN: cochlear nucleus; CER: cerebellum; TPN: Task-positive network. (For interpretation of the references to color in this figure legend, the reader is referred to the web version of this article.)
K. Boyen et al. / Hearing Research 312 (2014) 48e59
the two types of behavior directly because the short duration of
sound blocks (w8 s) in combination with the sparse sampling
prevents us from differentiating onset/offset and sustained
response contributions. Nevertheless, the clustering we observed
seems to be consistent with the diverging response properties in
different anatomic regions of the brain.
A further difference in the properties of subcortical and cortical
areas, respectively, is reflected by the relation between hearing loss
and response amplitudes. While the activation in subcortical areas
was significantly diminished for larger hearing losses (Table 3),
such a relation was not present in the auditory cortex and TPN. This
suggests that the subcortical areas retained a stimulus representation that reflects the detected stimulus level above threshold,
whereas the auditory cortex adapted to the reduced dynamic range
caused by peripheral hearing loss. This is consistent with adaptation in monaural deafness that occurs primarily at the level of the
cortex (Langers et al., 2005b).
4.3. Tinnitus-related thalamic dissociation
In tinnitus patients, the correlation coefficient between the
cortical and subcortical clusters was diminished relative to the
controls (Fig. 7). Since the connection between both clusters is
formed by the thalamus, this difference in functional connectivity
can be interpreted as a thalamic dysfunction. Interestingly, two
models on tinnitus attribute a specific function to the thalamus in
the pathophysiology of tinnitus.
The first model (Rauschecker et al., 2010; Zhang, 2013) assumes
that the thalamic function is under the control of a subcallosal area
consisting of the nucleus accumbens and ventromedial prefrontal
cortex, relayed via the thalamic reticular nucleus. Abnormal gray
matter volume and hyperactivity of this area (Mühlau et al., 2006;
Leaver et al., 2011) have been hypothesized to lead to abnormal
thalamus function causing tinnitus. Our subjects all had a sensorineural hearing loss, which may have caused abnormal neural
activity in the brainstem. In subjects with hearing loss but no
tinnitus, this abnormal neural input is blocked by the MGB under
the control of the thalamic reticular nucleus. If thalamic gating is
impaired, the abnormal brainstem activity may be passed on to the
cortex resulting in tinnitus. The abnormal gating in the thalamus of
tinnitus patients may also have affected the responses to sound.
Specifically, the abnormal connectivity between cortical and
subcortical brain areas that we observed in the tinnitus patients is
possibly related to an abnormality in thalamic gating.
The second model (Llinás et al., 1999) was designed to account
for abnormal dysrhythmia observed in the EEG of tinnitus patients.
The model assumes that the thalamus in tinnitus patients resides in
a hypo-energetic state, which was recently confirmed in patients
with gaze-evoked tinnitus (van Gendt et al., 2012). The hypoenergetic state is associated with low-frequency bursting activity
that is observed in the EEG as an increase of the theta rhythm. It is
conceivable that this bursting mode of the thalamus also affects the
response of the auditory system to an external sound stimulus. The
thalamus may less accurately transmit acoustic information from
the inferior colliculus to the auditory cortex. Possibly, this accounts
for the abnormal connectivity between cortical and subcortical
areas, as observed in the present paper.
Richardson et al. (2012) report the MGB as “a compelling
structure for tinnitus research”. In their review, the role of the MGB
in tinnitus is mostly explained with reference to its inhibitory afferents from the inferior colliculus and thalamic reticular nucleus.
Additionally, pharmacological intervention by some selective
compounds that enhance tonic inhibition, suggesting that the MGB
is their main targeting site, is proposed as treatment of auditory
pathologies including temporal processing disorders or tinnitus
57
(Richardson et al., 2012). Our results may provide a functional
correlate for tinnitus treatment, which can be monitored during
such interventions.
4.4. The role of non-auditory areas in our experimental paradigm
The CER and TPN were included in our analysis, since their activity correlated extensively with activation in the auditory cortex
(Fig. 4). In previous research, connections between these regions
were reported as well (Hunter et al., 2006; Farhadi et al., 2010;
Maudoux et al., 2012). Both regions have been associated with
motor control and executive functions (Ghez and Fahn, 1985;
Schmahmann and Sherman, 1998; Bush et al., 2000). The TPN
consists of brain regions that generally show increased activity
during goal-directed behavior. Activity in the TPN is thought to be
anticorrelated with activity in the default mode network (DMN)
(Fox et al., 2005). The observed responses in CER and TPN may be
related to the button pressing that subjects performed while
listening to the experimental stimuli. Evidence in favor of this
interpretation is given by activation observed in only the left parietal lobe, and by stronger activation in the right cerebellum than
in the left cerebellum (Fig. 3). This activation pattern is possibly
visible due to the fact that subjects responded with the right thumb
whenever they perceived a sound. Furthermore, in contrast to the
responses in the auditory ROIs, which increased with increasing
presentation level, the responses in TPN and CER plateaued at the
level of 70 dB SPL. This plateau may well be due to the fact that
subjects already pressed buttons in nearly 100% of all trials for the
70 dB condition (Table 2), such that a further increase at 90 dB was
impossible.
In contrast with the TPN, the cerebellum appears to play a role in
nonmotor behavior (for a review see Strick et al., 2009), but also in
auditory processing specifically (Petacchi et al., 2005). A crossstudy meta-analysis revealed evidence for activation in five cerebellar areas during active and passive listening. Specifically to
tinnitus, elevated neural activity in rats (Brozoski et al., 2007) and
decreased activation during residual inhibition of the tinnitus in
humans (Osaki et al., 2005) were detected in the cerebellum. Besides, in contrast to normal-hearing subjects, no significant
response to sound in the cerebellum was found in tinnitus patients
(Lanting et al., 2010). Our study contributes another example to
these findings, although it remains difficult to interpret the role of
the cerebellum in tinnitus.
4.5. Hyperacusis as a possible confound
Even though our two hearing-impaired groups were well
matched in terms of hearing loss such that the principal difference
between these two groups was the presence or absence of tinnitus,
we cannot definitively assert that the differences in functional connectivity shown are merely due to tinnitus. Considering the significant difference in HQ scores, the between-group differences seen
here could be due to hyperacusis as well. Hyperacusis as such was not
an inclusion criterion, but a subject characteristic. It is very hard to
untangle the effects of hyperacusis and tinnitus since these characteristics were correlated (R ¼ 0.61). In order to clearly distinguish the
effects of hyperacusis from those of tinnitus, a larger study including a
tinnitus subgroup suffering from hyperacusis and an additional
tinnitus subgroup without hyperacusis would be necessary.
5. Conclusion
We investigated brain responses to sound in subjects with a
mild to moderate sensorineural hearing loss, of which a subgroup
suffered from tinnitus. The tinnitus and non-tinnitus subject
58
K. Boyen et al. / Hearing Research 312 (2014) 48e59
groups were matched with respect to the degree of hearing loss.
The most conspicuous differences between the subjects with
tinnitus and those without were observed in an analysis of the
functional connectivity between brain regions, rather than in the
amplitudes of the sound-evoked responses. Specifically, the functional connectivity between the brainstem and cortex was lower in
the tinnitus patients. This lower functional connectivity is consistent with tinnitus models proposed by Llinás et al. (1999),
Rauschecker et al. (2010) and Zhang (2013).
Acknowledgments
This research was supported by the American Tinnitus Association and the Heinsius Houbolt Foundation. Dave R. M. Langers was
funded by VENI research grant 016.096.011 from the Netherlands
Organisation for Scientific Research and the Netherlands Organization for Health Research and Development (ZonMw). The study is
part of the research program of our department: Healthy Aging and
Communication.
References
Adjamian, P., Sereda, M., Hall, D.A., 2009. The mechanisms of tinnitus: perspectives
from human functional neuroimaging. Hear. Res. 253, 15e31.
Amaral, A., Langers, D.R., 2013. The relevance of task-irrelevant sounds: hemispheric lateralization and interactions with task-relevant streams. Front. Neurosci.. http://dx.doi.org/10.3389/fnins.2013.00264.
Baguley, D.M., 2003. Hyperacusis. J. R. Soc. Med. 96, 582e585.
Baumgart, F., Kaulisch, T., Tempelmann, C., Gaschler-Markefski, B., Tegeler, C.,
Schindler, F., Stiller, D., Scheich, H., 1998. Electrodynamic headphones and
woofers for application in magnetic resonance imaging scanners. Med. Phys. 25,
2068e2070.
Boyen, K., Langers, D.R.M., de Kleine, E., van Dijk, P., 2013. Gray matter in the brain:
differences associated with tinnitus and hearing loss. Hear. Res. 295, 67e78.
Brozoski, T.J., Ciobanu, L., Bauer, C.A., 2007. Central neural activity in rats with
tinnitus evaluated with manganese-enhanced magnetic resonance imaging
(MEMRI). Hear. Res. 228, 168e179.
Bush, G., Luu, P., Posner, M.I., 2000. Cognitive and emotional influences in anterior
cingulate cortex. Trends Cogn. Sci. 4, 215e222 (Regul. Ed.).
Dobie, R.A., 2003. Depression and tinnitus. Otolaryngol. Clin. North Am. 36, 383e
388.
Eggermont, J.J., 2001. Between sound and perception: reviewing the search for a
neural code. Hear. Res. 157, 1e42.
Ernst, S.M.A., Verhey, J.L., Uppenkamp, S., 2008. Spatial dissociation of changes of
level and signal-to-noise ratio in auditory cortex for tones in noise. NeuroImage
43, 321e328.
Farhadi, M., Mahmoudian, S., Saddadi, F., Karimian, A.R., Mirzaee, M.,
Ahmadizadeh, M., Ghasemikian, K., Gholami, S., Ghoreyshi, E., Shamshiri, A.,
Madani, S., Bakaev, V., Moradkhani, S., Raeisali, G., 2010. Functional brain abnormalities localized in 55 chronic tinnitus patients: fusion of SPECT coincidence imaging and MRI. J. Cereb. Blood Flow Metab. 30, 864e870.
Fox, M.D., Snyder, A.Z., Vincent, J.L., Corbetta, M., Van Essen, D.C., Raichle, M.E.,
2005. The human brain is intrinsically organized into dynamic, anticorrelated
functional networks. Proc. Natl. Acad. Sci. U. S. A. 102, 9673e9678.
Friston, K.J., 1994. Functional and effective connectivity in neuroimaging: a synthesis. Hum. Brain Mapp. 2, 56e78.
Ghez, C., Fahn, S., 1985. The cerebellum. In: Principles of Neural Science, second ed.
Elsevier, New York, pp. 833e852.
Good, P., 2002. Extensions of the concept of exchangeability and their applications.
J. Mod. Appl. Statist. Methods 1, 243e247.
Gu, J.W., Halpin, C.F., Nam, E.C., Levine, R.A., Melcher, J.R., 2010. Tinnitus, diminished
sound-level tolerance, and elevated auditory activity in humans with clinically
normal hearing sensitivity. J. Neurophysiol. 104, 3361e3370.
Hall, D.A., Haggard, M.P., Akeroyd, M.A., Palmer, A.R., Summerfield, A.Q., Elliott, M.R.,
Gurney, E.M., Bowtell, R.W., 1999. “Sparse” temporal sampling in auditory fMRI.
Hum. Brain Mapp. 7, 213e223.
Hall, D.A., Haggard, M.P., Summerfield, A.Q., Akeroyd, M.A., Palmer, A.R.,
Bowtell, R.W., 2001. Functional magnetic resonance imaging measurements of
sound-level encoding in the absence of background scanner noise. J. Acoust.
Soc. Am. 109, 1559e1570.
Harms, M.P., Melcher, J.R., 2003. Detection and quantification of a wide range of
fMRI temporal responses using a physiologically-motivated basis set. Hum.
Brain Mapp. 20, 168e183.
Hoffman, H.J., Reed, G.W., 2004. Epidemiology of tinnitus. In: Snow Jr., J.B. (Ed.),
Tinnitus: Theory and Management. B.C. Decker, Inc., Hamilton, Ontario, pp. 16e41.
Hunter, M.D., Eickhoff, S.B., Miller, T.W., Farrow, T.F., Wilkinson, I.D., Woodruff, P.W.,
2006. Neural activity in speech-sensitive auditory cortex during silence. Proc.
Natl. Acad. Sci. U. S. A. 103, 189e194.
Khalfa, S., Dubal, S., Veuillet, E., Perez-Diaz, F., Jouvent, R., Collet, L., 2002. Psychometric normalization of a hyperacusis questionnaire. ORL J. Otorhinolaryngol.
Relat. Spec. 64, 436e442.
Langers, D.R.M., Backes, W.H., van Dijk, P., 2003. Spectrotemporal features of the
auditory cortex: the activation in response to dynamic ripples. NeuroImage 20,
265e275.
Langers, D.R.M., Van Dijk, P., Backes, W.H., 2005a. Interactions between hemodynamic responses to scanner acoustic noise and auditory stimuli in functional
magnetic resonance imaging. Magn. Reson. Med. 53, 49e60.
Langers, D.R.M., van Dijk, P., Backes, W.H., 2005b. Lateralization, connectivity and
plasticity in the human central auditory system. NeuroImage 28, 490e499.
Langers, Dave R.M., van Dijk, P., Schoenmaker, E.S., Backes, W.H., 2007a.
fMRI activation in relation to sound intensity and loudness. NeuroImage 35,
709e718.
Langers, D.R.M., Backes, W.H., van Dijk, P., 2007b. Representation of lateralization
and tonotopy in primary versus secondary human auditory cortex. NeuroImage
34, 264e273.
Langers, D.R.M., Melcher, J.R., 2011. Hearing without listening: functional connectivity reveals the engagement of multiple nonauditory networks during basic
sound processing. Brain Connectivity 1, 233e244.
Langers, D.R.M., van Dijk, P., 2011. Mapping the tonotopic organization in
human auditory cortex with minimally salient acoustic stimulation. Cereb.
Cortex. 55.
Lanting, C.P., De Kleine, E., Bartels, H., Van Dijk, P., 2008. Functional imaging of
unilateral tinnitus using fMRI. Acta Otolaryngol. 128, 415e421.
Lanting, C.P., de Kleine, E., Eppinga, R.N., van Dijk, P., 2010. Neural correlates of
human somatosensory integration in tinnitus. Hear. Res. 267, 78e88.
Lanting, C.P., de Kleine, E., van Dijk, P., 2009. Neural activity underlying tinnitus
generation: results from PET and fMRI. Hear. Res. 255, 1e13.
Leaver, A.M., Renier, L., Chevillet, M.A., Morgan, S., Kim, H.J., Rauschecker, J.P.,
2011. Dysregulation of limbic and auditory networks in tinnitus. Neuron 69,
33e43.
Liu, R.Y., 1988. Bootstrap procedures under some non-I.I.D. models. Ann. Statist. 16,
1696e1708.
Llinás, R.R., Ribary, U., Jeanmonod, D., Kronberg, E., Mitra, P.P., 1999. Thalamocortical
dysrhythmia: a neurological and neuropsychiatric syndrome characterized by
magnetoencephalography. Proc. Natl. Acad. Sci. U. S. A. 96, 15222e15227.
Lockwood, A.H., Salvi, R.J., Burkard, R.F., 2002. Tinnitus. N. Engl. J. Med. 347, 904e910.
Maldjian, J.A., Laurienti, P.J., Kraft, R.A., Burdette, J.H., 2003. An automated method
for neuroanatomic and cytoarchitectonic atlas-based interrogation of fMRI data
sets. NeuroImage 19, 1233e1239.
Maudoux, A., Lefebvre, P., Cabay, J.E., Demertzi, A., Vanhaudenhuyse, A., Laureys, S.,
Soddu, A., 2012. Auditory resting-state network connectivity in tinnitus: a
functional MRI study. PLoS ONE 7, e36222.
Melcher, J.R., Levine, R.A., Bergevin, C., Norris, B., 2009. The auditory midbrain of
people with tinnitus: abnormal sound-evoked activity revisited. Hear. Res. 257,
63e74.
Melcher, J.R., Sigalovsky, I.S., Guinan, J.J., Levine, R.A., 2000. Lateralized tinnitus
studied with functional magnetic resonance imaging: abnormal inferior colliculus activation. J. Neurophysiol. 83, 1058e1072.
Mühlau, M., Rauschecker, J.P., Oestreicher, E., Gaser, C., Röttinger, M.,
Wohlschläger, A.M., Simon, F., Etgen, T., Conrad, B., Sander, D., 2006. Structural
brain changes in tinnitus. Cereb. Cortex 16, 1283e1288.
Newman, C.W., Jacobson, G.P., Spitzer, J.B., 1996. Development of the tinnitus
handicap inventory. Arch. Otolaryngol. Head Neck Surg. 122, 143e148.
Nichols, T.E., Holmes, A.P., 2002. Nonparametric permutation tests for functional
neuroimaging: a primer with examples. Hum. Brain Mapp. 15, 1e25.
Noreña, A.J., Eggermont, J.J., 2003. Changes in spontaneous neural activity immediately after an acoustic trauma: implications for neural correlates of tinnitus.
Hear. Res. 183, 137e153.
Norman-Haignere, S., Kanwisher, N., McDermott, J., 2013. Cortical pitch regions in
humans respond primarily to resolved harmonics and are located in specific
tonotopic regions of anterior auditory cortex. J. Neurosci. 33, 19451e19469.
Oldfield, R.C., 1971. The assessment and analysis of handedness: the Edinburgh
inventory. Neuropsychologia 9, 97e113.
Osaki, Y., Nishimura, H., Takasawa, M., Imaizumi, M., Kawashima, T., Iwaki, T.,
Oku, N., Hashikawa, K., Doi, K., Nishimura, T., Hatazawa, J., Kubo, T., 2005. Neural
mechanism of residual inhibition of tinnitus in cochlear implant users. Neuroreport 16, 1625e1628.
Petacchi, A., Laird, A.R., Fox, P.T., Bower, J.M., 2005. Cerebellum and auditory function: an ALE meta-analysis of functional neuroimaging studies. Hum. Brain
Mapp. 25, 118e128.
Rauschecker, J.P., Leaver, A.M., Mühlau, M., 2010. Tuning out the noise: limbice
auditory interactions in tinnitus. Neuron 66, 819e826.
Richardson, B.D., Brozoski, T.J., Ling, L.L., Caspary, D.M., 2012. Targeting inhibitory
neurotransmission in tinnitus. Brain Res. 1485, 77e87.
Röhl, M., Uppenkamp, S., 2012. Neural coding of sound intensity and loudness in the
human auditory system. J. Assoc. Res. Otolaryngol. 13, 369e379.
Rosenbaum, P.R., 2005. An exact distribution-free test comparing two multivariate
distributions based on adjacency. J. R. Statist. Soc. B 67, 515e530.
Scheffler, K., Bilecen, D., Schmid, N., Tschopp, K., Seelig, J., 1998. Auditory cortical
responses in hearing subjects and unilateral deaf patients as detected by
functional magnetic resonance imaging. Cereb. Cortex 8, 156e163.
Schmahmann, J.D., Sherman, J.C., 1998. The cerebellar cognitive affective syndrome.
Brain 121 (Pt 4), 561e579.
K. Boyen et al. / Hearing Research 312 (2014) 48e59
Seki, S., Eggermont, J.J., 2003. Changes in spontaneous firing rate and neural synchrony in cat primary auditory cortex after localized tone-induced hearing loss.
Hear. Res. 180, 28e38.
Sigalovsky, I.S., Melcher, J.R., 2006. Effects of sound level on fMRI activation in human brainstem, thalamic and cortical centers. Hear. Res. 215, 67e76.
Smith, S.M., Fox, P.T., Miller, K.L., Glahn, D.C., Fox, P.M., Mackay, C.E., Filippini, N.,
Watkins, K.E., Toro, R., Laird, A.R., Beckmann, C.F., 2009. Correspondence of the
brain’s functional architecture during activation and rest. Proc. Natl. Acad. Sci. U.
S. A. 106, 13040e13045.
Strick, P.L., Dum, R.P., Shetake, J.A., 2009. Cerebellum and nonmotor function. Annu.
Rev. Neurosci. 32, 413e434.
59
Suzuki, M., Kitano, H., Kitanishi, T., Itou, R., Shiino, A., Nishida, Y., Yazawa, Y.,
Ogawa, F., Kitajima, K., 2002. Cortical and subcortical activation with monaural
monosyllabic stimulation by functional MRI. Hear. Res. 163, 37e45.
van Gendt, M.J., Boyen, K., de Kleine, E., Langers, D.R., van Dijk, P., 2012. The relation
between perception and brain activity in gaze-evoked tinnitus. J. Neurosci. 32,
17528e17539.
Wu, C.F.J., 1986. Jackknife, bootstrap and other resampling methods in regression
analysis. Ann. Statist. 14, 1261e1295.
Zhang, J., 2013. Auditory cortex stimulation to suppress tinnitus: mechanisms and
strategies. Hear. Res. 295, 38e57.
© Copyright 2026 ExpyDoc