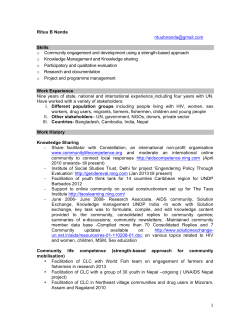
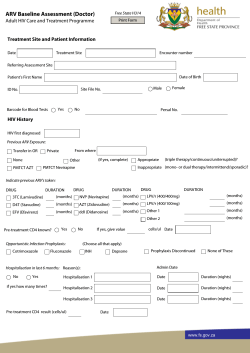
Adjudicated Morbidity and Mortality Outcomes by Age
among Individuals with HIV Infection on Suppressive
Antiretroviral Therapy
Christopher J. Miller1, Jason V. Baker2,3, Alison M. Bormann2, Kristine M. Erlandson4,
Katherine Huppler Hullsiek1, Amy C. Justice5,6, Jacqueline Neuhaus1, Roger Paredes7,8,
Kathy Petoumenos9, Deborah Wentworth1, Alan Winston10, Julian Wolfson1, James D. Neaton1*,
for the INSIGHT SMART and ESPRIT Study Groups
1 Division of Biostatistics, School of Public Health, University of Minnesota, Minneapolis, Minnesota, United States of America, 2 Division of Infectious Diseases, University
of Minnesota, Minneapolis, Minnesota, United States of America, 3 Hennepin County Medical Center, Minneapolis, Minnesota, United States of America, 4 Division of
Infectious Diseases, University of Colorado Anschutz Medical Campus, Aurora, Colorado, United States of America, 5 Veterans Affairs Connecticut Healthcare System, West
Haven, Connecticut, United States of America, 6 School of Medicine and Public Health, Yale University, New Haven, Connecticut, United States of America, 7 irsiCaixa
Foundation, Hospital Universitari Germans Trias i Pujol, Universitat Auto´noma de Barcelona, Badalona, Spain, 8 Lluita contra la SIDA Foundation, Badalona, Spain, 9 The
Kirby Institute, University of New South Wales, Sydney, Australia, 10 Department of Medicine, Imperial College, London, England
Abstract
Background: Non-AIDS conditions such as cardiovascular disease and non-AIDS defining cancers dominate causes of
morbidity and mortality among persons with HIV on suppressive combination antiretroviral therapy. Accurate estimates of
disease incidence and of risk factors for these conditions are important in planning preventative efforts.
Methods: With use of medical records, serious non-AIDS events, AIDS events, and causes of death were adjudicated using
pre-specified criteria by an Endpoint Review Committee in two large international trials. Rates of serious non-AIDS which
include cardiovascular disease, end-stage renal disease, decompensated liver disease, and non-AIDS cancer, and other
serious (grade 4) adverse events were determined, overall and by age, over a median follow-up of 4.3 years for 3,570
participants with CD4+ cell count $300 cells/mm3 who were taking antiretroviral therapy and had an HIV RNA level
#500 copies/mL. Cox models were used to examine the effect of age and other baseline factors on risk of a composite
outcome of all-cause mortality, AIDS, or serious non-AIDS.
Results: Five-year Kaplan-Meier estimates of the composite outcome, overall and by age were 8.3% (overall), 3.6% (,40),
8.7% (40–49) and 16.1% ($50), respectively (p,0.001). In addition to age, smoking and higher levels of interleukin-6 and Ddimer were significant predictors of the composite outcome. The composite outcome was dominated by serious non-AIDS
events (overall 65% of 277 participants with a composite event). Most serious non-AIDS events were due to cardiovascular
disease and non-AIDS cancers.
Conclusions: To date, few large studies have carefully collected data on serious non-AIDS outcomes. Thus, reliable estimates
of event rates are scarce. Data cited here, from a geographically diverse cohort, will be useful for planning studies of
interventions aimed at reducing rates of serious non-AIDS events among people with HIV.
Citation: Miller CJ, Baker JV, Bormann AM, Erlandson KM, Huppler Hullsiek K, et al. (2014) Adjudicated Morbidity and Mortality Outcomes by Age among
Individuals with HIV Infection on Suppressive Antiretroviral Therapy. PLoS ONE 9(4): e95061. doi:10.1371/journal.pone.0095061
Editor: Alan Landay, Rush University, United States of America
Received December 18, 2013; Accepted March 23, 2014; Published April 11, 2014
Copyright: ß 2014 Miller et al. This is an open-access article distributed under the terms of the Creative Commons Attribution License, which permits
unrestricted use, distribution, and reproduction in any medium, provided the original author and source are credited.
Funding: CJM was supported by the National Institute of Allergy and Infectious Diseases (NIAID) [grant number AI007432-15]. The SMART and ESPRIT studies
were funded by NIAID [grant numbers U01AI042170 and U01AI46362 (SMART); U01AI46957 and U01AI068641 (ESPRIT)]. Funding source staff members
participated in non-binding manuscript review as members of the International Network for Strategic Initiatives in Global HIV Trials (INSIGHT), but were not part of
the writing group. The funders had no role in study design, data collection and analysis, decision to publish, or preparation of the manuscript.
Competing Interests: The authors have declared that no competing interests exist.
* E-mail: [email protected]
non-AIDS defining cancer. Studies comparing persons with and
without HIV infection have shown that HIV-positive individuals
have higher rates of heart failure [2]_ENREF_12, myocardial
infarction [3–5], stroke [6], and cancer [7–9]. A recent review
considers several possible reasons for the excess risk of SNA events
among HIV positive individuals [10]. These reasons include
cART, traditional risk factors, and immune dysfunction and
Introduction
Potent combination antiretroviral therapy (cART) has improved
life expectancy for people with HIV. AIDS-related events are now
less common among patients taking suppressive cART [1].
Instead, morbidity and mortality is dominated by serious nonAIDS (SNA) conditions, particularly cardiovascular disease
(CVD), end-stage renal disease, decompensated liver disease and
PLOS ONE | www.plosone.org
1
April 2014 | Volume 9 | Issue 4 | e95061
Adjudicated Outcomes among Individuals with HIV
Table 1. Participant characteristics at study entry overall by age category.
Characteristic
Overall
,40 years
40–49 years
$50 years
P-value
N (ESPRIT, SMART)
3570 (1636, 1934)
1361 (779, 582)
1379 (556, 823)
830 (301, 529)
Female gender
815 (22.8%)
397 (29.2%)
284 (20.6%)
134 (16.1%)
,0.001
Black race
628 (17.6%)
212 (15.6%)
270 (19.6%)
146 (17.6%)
0.35
Homosexual
1861 (52.1%)
656 (48.2%)
737 (53.4%)
468 (56.4%)
,0.001
Heterosexual
1442 (40.4%)
600 (44.1%)
521 (37.8%)
321 (38.7%)
,0.001
Intravenous drug use
335 (9.4%)
131 (9.6%)
160 (11.6%0
44 (5.3%)
,0.001
Years diagnosed with HIV
7.3 (4.2, 11.4)
5.6 (3.2, 9.0)
8.3 (5.1, 12.5)
8.9 (5.2, 13.2)
,0.001
CD4+ cell count (cells/mm3)
547 (421, 949)
528 (415, 686)
562 (432, 758)
557 (420, 730)
0.006
0.001
Demographics
Likely modes of transmission
Medical History
Nadir CD4+ (cells/mm3)
209 (105, 313)
223 (120, 322)
200 (93, 312)
200 (104, 293)
Prior AIDS diagnosis
917 (25.7%)
289 (21.2%)
385 (27.9%)
243 (29.3%)
,0.001
Hepatitis B or C infection#
597 (18.2%)
218 (17.8%)
272 (21.1%)
107 (13.9%)
0.04
Body mass index (kg/m2)
24.1 (22.0, 26.6)
23.7 (21.6, 26.0)
24.2 (22.1, 26.8)
24.6 (22.6, 27.0)
,0.001
Current smoker#
696 (36.0%)
202 (24.7%)
326 (39.6%)
168 (31.8%)
0.04
History of CVD event
84 (2.4%)
6 (0.4%)
33 (2.4%)
45 (5.4%)
,0.001
Polypharmacy%
235 (6.6%)
23 (1.7%)
91 (6.6%)
121 (14.6%)
,0.001
Diabetes mellitus
173 (4.9%)
16 (1.2%)
74 (5.4%)
83 (10.0%)
,0.001
Lipodystrophy #
565 (29.2%)
112 (19.2%)
259 (31.5%)
194 (36.7%)
,0.001
Duration of cART (years)
4.0 (2.6, 5.0)
3.0 (2.0, 5.0)
4.2 (3.0, 5.0)
4.3 (3.0, 5.0)
,0.001
PI use at study entry
1640 (45.9%)
582 (42.8%)
678 (49.2%)
380 (45.8%)
0.06
NNRTI use at study entry
1796 (50.3%)
672 (49.4%)
680 (49.3%)
444 (53.5%)
0.10
Only NRTI use at study entry
387 (10.8%)
171 (12.6%)
136 (9.9%)
80 (9.6%)
0.03
Any PI exposure
2596 (72.7%)
902 (66.3%)
1047 (75.9%)
647 (78.0%)
,0.001
Any NNRTI exposure
2303 (64.5%)
840 (61.7%)
904 (65.6%)
559 (67.4%)
0.002
Abacavir use at study entry
794 (22.2%)
254 (18.7%)
332 (24.1%)
208 (25.1%)
,0.001
Tenofovir use at study entry
435 (12.2%)
124 (9.1%)
187 (13.6%)
124 (15.0%)
,0.001
Lamivudine (3TC) use at study entry
2782 (77.9%)
1058 (77.7%)
1070 (77.6%)
654 (78.8%)
0.98
Stavudine (d4T) use at study entry
1004 (28.1%)
423 (31.1%)
373 (27.1%)
208 (25.1%)
,0.001
Didanosine (ddI) use at study entry
586 (16.4%)
253 (18.6%)
236 (17.1%)
97 (11.7%)
,0.001
Zalcitabine (ddC) use at study entry
20 (0.6%)
9 (0.7%)
8 (0.6%)
3 (0.4%)
0.33
Zidovudine (AZT) use at study entry
1716 (48.1%)
700 (51.4%)
634 (46.0%)
382 (46.0%)
0.003
Any abacavir exposure
983 (27.5%)
319 (23.4%)
413 (30.0%)
251 (30.2%)
,0.001
Any tenofovir exposure
538 (15.1%)
170 (12.5%)
228 (16.5%)
140 (16.9%)
,0.001
Any lamivudine (3TC) exposure
3342 (93.6%)
1252 (92.0%)
1302 (94.4%)
788 (94.9%)
0.03
Any stavudine (d4T) exposure
2126 (59.6%)
766 (56.3%)
847 (61.4%)
513 (61.8%)
,0.001
Any didanosine (ddI) exposure
1539 (43.1%)
564 (41.4%)
636 (46.2%)
339 (40.8%)
0.33
Any lamivudine (ddC) exposure
521 (14.6%)
150 (11.0%)
236 (17.1%)
135 (16.3%)
,0.001
Any zidovudine (AZT) exposure
3022 (84.6%)
1145 (84.1%)
1172 (85.0%)
705 (84.9%)
0.43
cART History
Laboratory values
eGFR‘ (mL/min/1.73 m2)
110 (99, 120)
118 (110, 127)
110 (102, 118)
99 (89, 107)
,0.001
Total:HDL cholesterol#
4.6 (3.6, 6.0)
4.2 (3.3, 5.6)
4.8 (3.7, 6.2)
4.8 (3.8, 6.2)
,0.001
D-dimer* (mg/mL)
0.22 (0.15, 0.35)
0.20 (0.14, 0.31)
0.22 (0.14, 0.34)
0.23 (0.17, 0.45)
,0.001
PLOS ONE | www.plosone.org
2
April 2014 | Volume 9 | Issue 4 | e95061
Adjudicated Outcomes among Individuals with HIV
Table 1. Cont.
Characteristic
Overall
,40 years
40–49 years
$50 years
P-value
Interleukin-6* (pg/mL)
1.73 (1.10, 2.74)
1.50 (0.95, 2.36)
1.70 (1.15, 2.69)
2.27 (1.44, 3.40)
,0.001
hsCRP (mg/mL)
1.58 (0.68, 3.67)
1.17 (0.53, 2.98)
1.63 (0.75, 3.80)
2.14 (0.99, 5.11)
,0.001
Values are median (IQR) or n (%). Significance tests for age differences are general linear models or logistic regression models for continuous and categorical variables,
respectively, with age analyzed as a continuous variable. #Data unavailable for either all ESPRIT participants or for a subset of ESPRIT participants who enrolled from the
Vanguard studies. *Biomarker summary statistics reflect a subset of the sample (n = 1193, 1253, and 775 for age strata, respectively). %Polypharmacy was considered as
use of two or more of the following drug classes hypertensive, hyperlipidaemia, coronary artery disease, osteoporosis, or diabetes. ‘eGFR was available for participants
who consented to store blood samples (n = 960, 1011, and 640 for age strata, respectively). cART = combination antiretroviral therapy. NRTI = nucleoside analog reverse
transcriptase inhibitor. PI = protease inhibitor. NNRTI = non-nucleoside analog reverse transcriptase inhibitor. eGFR = estimated glomerular filtration rate. hsCRP = highsensitivity c-reactive protein. CVD = cardiovascular disease. History of CVD event includes history of myocardial infarction, coronary artery disease surgery, or stroke.
doi:10.1371/journal.pone.0095061.t001
inflammation. Possible therapeutic approaches are discussed in the
review.
Future intervention trials will require accurate estimates of SNA
event rates and of patient risk factors that could be used to select
study participants. In this report, we take advantage of the longterm follow-up and centrally adjudicated clinical outcomes of
participants in the control arms of two large international
randomized clinical trials who received continuous cART aimed
at viral suppression to estimate rates of a composite outcome of allcause mortality, SNA, or AIDS, and rates for each component of
this composite outcome. Results are given overall and by age since
risk of SNA increase with age and, therefore, age is an obvious
factor to consider as an inclusion criterion in future trials.
Furthermore, the number of people aged $50 years living with
HIV-1 (HIV) has been increasing worldwide [11–13], and this
motivates the study of novel interventions to prevent SNA diseases.
Methods
Study Population
Outcomes for the participants in the control arms of the
Strategies for Management of Anti-Retroviral Therapy (SMART)
trial and the Evaluation of Subcutaneous Proleukin in a
Randomized International Trial (ESPRIT) are the subject of this
report. Both studies were carried out by the International Network
for Strategic Initiatives in Global HIV Trials (INSIGHT). The
study design and methods of both studies have been reported
previously [14–16]. In SMART, 5472 HIV-infected individuals
with CD4+ cell counts .350 cells/mm3 were randomized to either
the Drug Conservation group, which received CD4+ cell countguided episodic cART or the Viral Suppression control group,
which received continuous cART [16]. Enrollment in SMART
ended in 2006 and all participants were followed through July
2007 [15]. In ESPRIT, 4111 HIV-infected individuals with CD4+
Table 2. Morbidity and mortality event rates by age.
Event
Overall
n
Rate (SE)
,40 years
40–49 years
$50 years
n
n
n
Rate (SE)
Rate (SE)
aHR (95%
CI)
P-value
Rate (SE)
All-cause mortality
113
0.70 (0.07)
31
0.45 (0.08)
36
0.61 (0.10)
46
1.31 (0.19)
1.8 (1.5–2.2)
,0.001
AIDS (fatal or non-fatal)
54
0.34 (0.05)
14
0.21 (0.06)
27
0.46 (0.09)
13
0.38 (0.10)
1.2 (0.9–1.6)
0.17
SNA event
170
1.08 (0.08)
25
0.37 (0.07)
62
1.08 (0.14)
83
2.51 (0.28)
2.0 (1.7–2.3)
,0.001
Mortality, AIDS, or SNA
268
1.71 (0.10)
55
0.82 (0.11)
101
1.77 (0.18)
112
3.41 (0.32)
1.7 (1.5–2.0)
,0.001
CVD event
79
0.49 (0.06)
12
0.18 (0.05)
26
0.45 (0.09)
41
1.21 (0.19)
2.1 (1.7–2.6)
,0.001
Non-AIDS related cancers
79
0.49 (0.06)
11
0.16 (0.05)
27
0.46 (0.09)
41
1.20 (0.19)
2.0 (1.6–2.4)
,0.001
Chronic kidney disease‘
89
0.99 (0.11)
23
0.63 (0.13)
29
0.89 (0.17)
37
1.82 (0.30)
1.9 (1.5–2.3)
,0.001
Bacterial pneumonia
106
0.67 (0.07)
35
0.52 (0.09)
45
0.79 (0.12)
26
0.77 (0.15)
1.2 (1.0–1.4)
0.14
All-cause hospitalization
817
5.66 (0.20)
278
4.52 (0.27)
291
5.58 (0.33)
248
8.03 (0.51)
1.3 (1.2–1.4)
,0.001
Any grade-4 event
440
2.96 (0.14)
136
2.14 (0.18)
159
2.92 (0.23)
145
4.71 (0.39)
1.5 (1.3–1.6)
,0.001
15
0.09 (0.02)
5
0.07 (0.03)
5
0.08 (0.04)
5
0.14 (0.06)
1.9 (1.1–3.2)
0.02
Hematologic grade 4 event
Gastrointestinal grade 4 event
66
0.41 (0.05)
20
0.30 (0.07)
24
0.41 (0.08)
22
0.64 (0.14)
1.3 (1.0–1.7)
0.04
Hepatobiliary grade 4 event
22
0.14 (0.03)
5
0.07 (0.03)
7
0.12 (0.04)
10
0.29 (0.09)
1.8 (1.2–2.9)
0.008
Nervous system grade 4 event
53
0.33 (0.05)
19
0.28 (0.06)
15
0.26 (0.07)
19
0.55 (0.13)
1.6 (1.2–2.1)
,0.001
Renal and urinary grade 4 event
31
0.19 (0.03)
11
0.16 (0.05)
8
0.14 (0.05)
12
0.35 (0.10)
1.4 (1.0–2.1)
0.07
N represents the number of patients with an event over follow-up. aHR = adjusted hazard ratio. Significance tests and aHR are from Cox models for the continuous
effect of a ten year increase in age adjusted for the effects of gender, likely mode of infection, and study (SMART or ESPRIT). The rate is the number of events per 100
person-years of follow-up with only first events considered (i.e., time-to-event). CVD = cardiovascular disease. SNA = Serious non-AIDS. ‘Data available for participants
who consented to storing blood sample for future testing (n = 2688). No grade 4 hepatobiliary events occurred among women.
doi:10.1371/journal.pone.0095061.t002
PLOS ONE | www.plosone.org
3
April 2014 | Volume 9 | Issue 4 | e95061
Adjudicated Outcomes among Individuals with HIV
Figure 1. Cumulative probability of composite endpoint (death, SNA, or AIDS) by age group.
doi:10.1371/journal.pone.0095061.g001
cell counts $300 cells/mm3 were randomized to receive cART
alone (control group) or cART with interleukin-2 [14]. Enrollment
in ESPRIT ended in 2003 and all participants were followed
through November 2008.
For this study, we included participants in the control arms of
SMART and ESPRIT who were on cART at study entry with an
HIV RNA level #500 copies/mL (a lower limit of detection that
could be applied at all sites for both studies) to focus on
participants who were being successfully treated with cART. This
now represents the great majority of patients taking ART and is
likely to be the target population for adjunctive interventions
aimed at reducing SNA since the first goal of treatment is maximal
and durable suppression of plasma HIV viral load [17]. Neither
SMART nor ESPRIT specified cART regimens to be used to
maintain suppressed HIV RNA levels.
Written informed consent was obtained from all participants.
The institutional review board (IRB) or institutional ethics
committee (IEC) at each site and the University of Minnesota,
which served as the Statistical and Data Management Center,
approved the protocols of SMART and ESPRIT and the analysis
of stored specimens for consenting participants. The University of
Minnesota institutional review board also approved plans for the
continued analysis of SMART and ESPRIT datasets utilized in
this study. Copies of all IRB/IEC approval letters are filed with
the Statistical and Data Management Center at the University of
Minnesota.
PLOS ONE | www.plosone.org
AIDS and Non-AIDS Clinical Outcomes and Causes of
Death
The INSIGHT Endpoint Review Committee (ERC) reviewed
AIDS and SNA non-fatal events and deaths using pre-specified
criteria [18,19]. Briefly, non-fatal event documentation was
reviewed by three reviewers and differences were adjudicated.
Events considered ‘‘confirmed’’ or ‘‘probable’’ based on the prespecified criteria were counted endpoints. Causes of death were
classified by the ERC using the CoDe system [20,21].
Serious non-AIDS (SNA) events included CVD, end-stage renal
disease, decompensated liver disease, and non-AIDS cancer
(excluding basal and squamous cell skin cancers). Myocardial
infarction, cerebrovascular strokes, coronary artery disease
requiring an invasive procedure, and CVD death were classified
as CVD events.
In addition to AIDS and SNA events, rates of grade 4 events
and estimated glomerular filtration (eGFR) are also reported.
Grade 4 events are potentially life-threatening symptomatic events
requiring medical intervention according to the toxicity table of
the Division of AIDS of the National Institute of Allergy and
Infectious Diseases (NIAID). In each study grade 4 events were
classified using System Organ Classes (SOC) defined by the
Medical Dictionary for Regulatory Activities (MedDRA). eGFR
was calculated using the Chronic Kidney Disease-Epidemiology
Collaboration equation [22]. Chronic kidney disease (CKD) was
4
April 2014 | Volume 9 | Issue 4 | e95061
Adjudicated Outcomes among Individuals with HIV
Figure 2. Cumulative probability of death by age group.
doi:10.1371/journal.pone.0095061.g002
defined as a 25% decline in eGFR to a value ,60 mL/min/
1.73 m2 from study entry.
and cumulative three, four and five-year event probabilities are
calculated using the Kaplan-Meier method with 95% log-log
confidence intervals (CIs). Cox proportional hazards models were
used to examine the relationship between age and major clinical
outcomes, and to investigate determinants of a composite outcome
of all-cause mortality, SNA, or AIDS; adjusted hazard ratios
(aHRs) for ten years increase in age and 95% CIs are cited. For
each event considered, time at risk was defined as the time from
randomization to the first event, death, loss to follow-up, or study
closure.
Data were analyzed using SAS version 9.3 and R version 2.15.1.
P-values are two-sided and unadjusted for multiple comparisons.
Baseline and Follow-up Visit Data Collection
Medical and treatment histories, including AIDS and nonAIDS diagnoses, HIV and SNA risk factors, and use of
concomitant medications, were ascertained prior to randomization. Interleukin-6 (IL-6), an inflammatory marker, and D-dimer,
a coagulation marker, were measured at baseline on stored
specimens in both studies for consenting participants [23,24].
In ESPRIT, follow-up visits for data collection were conducted
every four months; in SMART, participants were seen one month
and two months after enrollment, then in two-month intervals
until year one, and in four-month intervals in subsequent years.
CD4+ cell count and HIV RNA levels were measured locally at
each follow-up visit. For consenting individuals, stored specimens
were used to measure creatinine levels annually with additional
measurements at four and eight months in SMART.
Results
Study participants
Among 4792 participants in the control arms of SMART
(n = 2752) and ESPRIT (n = 2040), 3570 (74.5%) were taking
cART and had an HIV RNA level #500 copies/mL at study
entry. Of these participants from 35 countries, 1327 (37.2%) were
enrolled by sites in Europe; 1319 (36.9%) by sites in North
America; 489 (13.7%) by sites in South America; 257 (7.2%) by
sites in Asia; 146 (4.1%) by sites in Australia; and 32 (0.9%) by sites
in Africa. Median follow-up time was 4.3 years (interquartile range
[IQR]: 2.1 and 6.7 years). Vital status was known for 96.5% of
participants at the completion of both studies.
Statistical analysis
Participant characteristics at enrollment and outcomes during
follow-up are presented overall and for three age groups: ,40, 40–
49, and $50 years of age. Cross-sectional associations of
demographic and health factors with age were assessed using
logistic and general linear models for categorical and continuous
variables, respectively. Event rates per 100 person-years are cited
PLOS ONE | www.plosone.org
5
April 2014 | Volume 9 | Issue 4 | e95061
Adjudicated Outcomes among Individuals with HIV
Figure 3. Cumulative probability of SNA event by age group.
doi:10.1371/journal.pone.0095061.g003
persons aged 40–49 years were non-AIDS cancer (28%), liver
disease (11%), CVD (8%) and infection (8%). The most common
causes of death among participants aged $50 years were cancer
(28%) and CVD (20%). Overall, only 6% of deaths were AIDSrelated; 45% were attributable to causes other than AIDS or SNA
(i.e., accident, infection, substances, suicide, or other).
Rates of a composite outcome with components of death, AIDS
or SNA increased with age (aHR per 10 years older: 1.7; 95% CI:
1.5–2.0). In each age group, SNA events were the dominant
component of this composite outcome. Overall, the most common
SNA events were non-AIDS cancers and CVD (79 participants
each). The most common cancers were lung cancer (n = 16),
prostate cancer (n = 11), anal cancer (n = 8), breast cancer (n = 7),
skin cancer (n = 7), and colon cancer (n = 4). For the 79
participants with at least one CVD event, the individual CVD
events were acute myocardial infarction (n = 40), coronary artery
disease with surgery (n = 21), stroke (n = 10), and other causes
(n = 8). Decompensated liver disease (n = 14) and end stage renal
disease (n = 4) were much less common.
Rates of all-cause mortality (aHR: 1.8; 95% CI: 1.5–2.2), SNA
events (aHR: 2.0; 95% CI: 1.7–2.3), CVD events (aHR: 2.1; 95%
CI: 1.7–2.6), non-AIDS cancers (aHR: 2.0; 95% CI: 1.6–2.4),
CKD (aHR: 1.9; 95% CI: 1.5–2.3), and all-cause hospitalization
(aHR: 1.3; 95% CI: 1.2–1.4), increased with older age as expected
(Table 2). AIDS events were rare and were not significantly related
to age (aHR: 1.2; 95% CI: 0.9–1.6). Similarly, risk of bacterial
pneumonia did not vary significantly by age (aHR: 1.2; 95% CI:
Table 1 summarizes baseline characteristics. Median age was 42
years (IQR: 36–49); 1361 (38%), 1379 (39%), and 830 (23%)
participants were aged ,40 years, 40–49 years, and $50 years,
respectively. Older participants were more likely to be male
(P,0.001) and had acquired HIV through homosexual contact
(P,0.001). As expected, older participants were more likely to
have had a history of CVD or diabetes (both P,0.001), and were
more likely to be on medications for hypertension, hyperlipidemia,
osteoporosis, diabetes, or CVD (all P,0.001). Among participants
$50 years old, 14.6% were taking two or more of these types of
medication in addition to cART. Overall, the median time on
ART was 4.0 years (IQR: 2.6–5.0). Older participants were more
likely to have been on ART longer and have a history of use of
protease inhibitors (PIs) and non-nucleoside reverse transcriptase
inhibitors (NNRTIs). Older participants also were more likely to
have been prescribed abacavir, tenofovir, stavudine, zalicitabine,
and lamivudine.
Total/HDL cholesterol, IL-6, and D-dimer levels were higher
and eGFR was lower among older participants (all P,0.001).
Rates of major clinical events
During follow-up, 113 participants died (Table 2). Most
common causes of death for aged ,40 years that could be
adjudicated were CVD (23%), drug overdose (13%), non-AIDS
cancer (10%) and AIDS (10%). Causes of death for 19 participants
could not be determined. Common causes of death for older
PLOS ONE | www.plosone.org
6
April 2014 | Volume 9 | Issue 4 | e95061
Adjudicated Outcomes among Individuals with HIV
Figure 4. Cumulative probability of CVD event by age group.
doi:10.1371/journal.pone.0095061.g004
0.9–1.5). Grade 4 events of multiple etiologies including the
hematologic (aHR: 1.9; 95% CI: 1.1–3.2), gastrointestinal (aHR:
1.3; 95% CI: 1.0–1.7), and neurological systems (aHR: 1.6; 95%
CI: 1.2–2.1), were more likely with older age.
Table 3 presents Kaplan-Meier estimates for serious event rates
at three, four, and five years. The five-year Kaplan-Meier event
rates for all-cause mortality were 1.8%, 2.9%, and 6.4% for
participants aged ,40 years, 40–49 years, and $50 years,
respectively (P,0.001). With regard to the composite endpoint,
five-year event rates were 3.6%, 8.7% and 16.1% for the
respective age groups (P,0.001). Figures 1–6 show Kaplan-Meier
plots for the composite outcome of death, SNA or AIDS and each
major component of this composite outcome including CVD and
non-AIDS cancer.
We examined determinants of the composite outcome of allcause mortality, SNA, or AIDS in unadjusted and adjusted Cox
models (Table 4). The following factors were considered individually in unadjusted models as well as together in a multivariable
model: age, gender, injecting drug use, race, time since HIV
diagnosis, years on cART, baseline and nadir CD4+ count, prior
AIDS, prior CVD, diabetes mellitus status, body mass index, use
of blood pressure lowering medication, use of lipid lowering
medication, IL-6, and D-dimer. While several factors were
associated with the composite in unadjusted analysis, the only risk
factors that remained significant after adjustment for other
covariates were age, male gender, use of antihypertensive drugs,
and elevated levels of IL-6 and D-dimer (Table 4). A sensitivity
PLOS ONE | www.plosone.org
analysis with use of the SMART cohort only where smoking status
could be addressed confirmed that age, smoking, and elevated
levels of IL-6 and D-dimer were significant risk factors for the
composite endpoint, but the effects of male gender and
antihypertensive medications were attenuated. A further sensitivity
analysis adjusting for exposure to PIs, NNRTIs, abacavir,
tenofovir, stavudine, zalciatabine, and lamivudine use, which were
higher among older participants, did not attenuate risk estimates
for older age, male gender, antihypertensive medications, or
elevated biomarker levels.
Discussion
In SMART and ESPRIT, HIV-positive participants taking
suppressive cART with high CD4+ cell counts were followed for
several years and fatal and non-fatal AIDS, SNA and other causes
of deaths were centrally adjudicated against standard event
criteria. In this report we estimate rates of these major causes of
morbidity and mortality overall and by age. Such information is
critical for planning future research aimed at improving the longterm health among a growing number of older persons with HIV.
Over 90% of major clinical events among participants aged
$50 years at enrollment were attributable to conditions other than
AIDS, primarily CVD and non-AIDS cancers. This emphasizes
the importance of prevention and control of established major
CVD risk factors for an aging population with HIV [25,26], and
also motivates the study of interventions that address the
7
April 2014 | Volume 9 | Issue 4 | e95061
Adjudicated Outcomes among Individuals with HIV
Figure 5. Cumulative probability of non-AIDS cancer by age group.
doi:10.1371/journal.pone.0095061.g005
Figure 6. Cumulative probability of AIDS by age group.
doi:10.1371/journal.pone.0095061.g006
PLOS ONE | www.plosone.org
8
April 2014 | Volume 9 | Issue 4 | e95061
Adjudicated Outcomes among Individuals with HIV
Table 3. Kaplan-Meier probabilities for events at 3, 4, and 5 years.
Event
Overall
,40 years
40–49 years
$50 years
Estimate (95% CI)
Estimate (95% CI)
Estimate (95% CI)
Estimate (95% CI)
3 years
1.8% (1.4–2.4)
1.0% (0.5–1.7)
1.7% (1.1–2.6)
3.5% (2.3–5.3)
4 years
2.5% (1.9–3.2)
1.2% (0.7–2.1)
1.9% (1.3–3.0)
5.6% (3.9–7.9)
5 years
3.2% (2.6–4.1)
1.8% (1.1–2.9)
2.9% (2.0–4.3)
6.4% (4.6–8.9)
3 years
1.0% (0.7–1.4)
0.5% (0.2–1.1)
1.3% (0.8–2.2)
1.2% (0.6–2.3)
4 years
1.2% (0.9–1.7)
0.5% (0.2–1.1)
1.7% (1.1–2.8)
1.6% (0.9–3.0)
5 years
1.7% (1.2–2.3)
0.7% (0.4–1.5)
2.4% (1.6–3.7)
2.2% (1.3–4.0)
3 years
1.6% (1.2–2.1)
0.3% (0.1–0.9)
1.5% (0.9–2.4)
3.9% (2.7–5.6)
4 years
2.1% (1.6–2.7)
0.5% (0.2–1.1)
1.9% (1.2–3.0)
5.1% (3.6–7.2)
5 years
2.6% (2.1–3.4)
1.1% (0.6–2.0)
2.4% (1.6–3.7)
5.7% (4.1–8.0)
3 years
1.4% (1.1–1.9)
0.3% (0.1–0.9)
1.4% (0.9–2.3)
3.4% (2.3–5.0)
4 years
2.1% (1.6–2.7)
0.8% (0.4–1.6)
1.8% (1.2–2.9)
4.6% (3.2–6.6)
5 years
2.4% (1.9–3.1)
0.8% (0.4–1.6)
2.0% (1.3–3.1)
6.0% (4.3–8.5)
3 years
3.4% (2.8–4.1)
0.9% (0.5–1.6)
3.6% (2.7–4.9)
7.4% (5.7–9.5)
4 years
4.5% (3.8–5.4)
1.4% (0.9–2.4)
4.6% (3.5–6.1)
9.8% (7.7–12.5)
5 years
5.5% (4.7–6.5)
2.1% (1.3–3.2)
5.4% (4.1–7.1)
11.8% (9.3–14.9)
3 years
5.2% (4.4–6.0)
1.7% (1.1–2.6)
5.5% (4.3–7.0)
10.4% (8.3–12.9)
4 years
6.7% (5.8–7.7)
2.4% (1.6–3.5)
6.9% (5.5–8.7)
13.7% (11.1–16.7)
5 years
8.3% (7.3–9.5)
3.6% (2.6–5.0)
8.7% (7.0–10.8)
16.1% (13.3–19.5)
All-cause mortality
AIDS
CVD event
Non-AIDS cancer
SNA event
Mortality, AIDS, or SNA
Note: Rates were estimated using the Kaplan-Meier method with log-log 95% confidence limits. Note: all log-rank p-values for a difference between age strata are
,0.001 for all event types except AIDS (p = 0.049).
doi:10.1371/journal.pone.0095061.t003
or those with elevated D-dimer or IL-6) were enrolled. Recent
ideas for risk stratification based on biomarkers and randomization
to elements of a ‘‘polypill’’ [31,32] may have merit for those at
intermediate risk of CVD and are relevant for HIV patients.
Sample size for treatments used with cART will also have to
consider adherence and potential side effects of the randomly
assigned treatments.
Consistent with previous studies [33], risk of grade 4 adverse
events increased with older age across a number of body systems.
This increased risk of toxicities with older age and increased use of
other drugs besides cART, highlights the importance of identifying
simple interventions for which adherence will be excellent over the
long-term in order to reduce morbidity and mortality from serious
non-AIDS conditions. It also indicates that toxicity management
will become increasingly important as the age distribution of
persons with HIV infection shifts older.
Strengths of the current study include the large geographically
diverse population, long follow-up with little missing data, and use
of standardized event definitions. The SMART and ESPRIT
studies were among the earliest to carefully adjudicate non-AIDS
conditions. A limitation is that participants were enrolled in
clinical trials and may therefore be healthier than the general HIV
population. However, our primary goal is to provide information
useful for planning trials of future interventions, therefore data
presented here are considered very relevant for that purpose.
underlying causes of the increased risk of SNA events such as antiinflammatory treatments. To illustrate the utility of the event rate
estimates in our report, we computed sample size assuming the
target number of events needed was 380. For example, this event
target might correspond to a placebo-controlled trial of a novel
treatment to reduce inflammation for which 80% power to detect
a 25% reduction in the hazard for the event of interest at the twosided 0.05 significance level was assumed. Using the rates in
Table 2 for those 50 years and older and assuming they are
constant over a five-year follow-up period, we estimated the total
number of patients required assuming patients were enrolled over
a two-year period and followed for a minimum of three years. For
the composite outcome of AIDS, SNA or death, the required
sample size is 3,410; for fatal or non-fatal CVD, the required
sample size is 9,260. Clearly, if an intervention is assumed to have
a broader effect than on CVD, an assumption that is reasonable
based on the relationship of biomarkers like IL-6 with different
outcomes [23,27–29], a composite outcome may be an efficient
approach provided components of the composite can be assumed
to move in line with one another in response to an intervention.
This was the logic behind using such an outcome in the ongoing
INSIGHT trial on the risks and benefits of early ART, the
Strategic Timing of AntiRetorviral Therapy (START) trial [30].
Sample size would be larger if younger patients were enrolled;
sample size would be smaller if a higher risk group (e.g., smokers
PLOS ONE | www.plosone.org
9
April 2014 | Volume 9 | Issue 4 | e95061
Adjudicated Outcomes among Individuals with HIV
Table 4. Unadjusted and multivariable risk prediction models of composite endpoint of all-cause mortality, AIDS, and SNA events.
Predictor
Unadjusted Models
Multivariable Model
HR (95% CI)
P-value
aHR (95% CI)
P-value
Age (per 10 years)
1.7 (1.5–2.0)
,0.001
1.4 (1.2–1.6)
,0.001
Years diagnosed (per 5 years)
1.3 (1.2–1.5)
,0.001
1.0 (0.9–1.2)
0.79
Years on cART (per 5 years)
1.6 (1.3–1.9)
,0.001
1.3 (1.0–1.8)
0.05
Female gender
0.6 (0.4–0.8)
0.002
0.6 (0.4–0.9)
0.007
Injecting drug user
1.6 (1.2–2.3)
0.006
1.4 (0.9–2.0)
0.10
Black race
1.1 (0.8–1.5)
0.63
1.0 (0.7–1.5)
0.86
Previous AIDS illness
1.2 (0.9–1.6)
0.14
0.9 (0.7–1.3)
0.64
IL-6* at baseline (per 1 SD increase)
1.5 (1.4–1.7)
,0.001
1.3 (1.2–1.5)
,0.001
D-dimer* at baseline (per 1 SD increase)
1.4 (1.3–1.6)
,0.001
1.3 (1.1–1.5)
,0.001
Body mass index (per 5 kg/m2) at baseline
1.1 (0.9–1.2)
0.40
0.9 (0.8–1.0)
0.46
Previous CVD at baseline
3.2 (1.8–5.4)
,0.001
1.4 (0.8–2.6)
0.27
Type-2 diabetes mellitus at baseline
2.0 (1.3–3.2)
0.003
1.2 (0.7–2.0)
0.48
On antihypertensive medication at baseline
2.7 (2.0–3.7)
,0.001
1.5 (1.0–2.2)
0.04
On antihyperlipidemia medication at baseline
1.9 (1.4–2.6)
,0.001
1.2 (0.8–1.6)
0.36
Baseline CD4+ cell count (per 100 cells/mm3)
1.0 (1.0–1.1)
0.82
1.0 (0.9–1.1)
0.76
Baseline nadir CD4+ cell count (per 100 cells/mm3)
1.0 (0.9–1.0)
0.38
1.0 (0.9–1.1)
0.92
Note: Multivariable model includes all covariates in the table. * Biomarkers are log-transformed and standardized to a mean of 0 and standard deviation of 1. A
sensitivity analysis restricting to SMART participants to examine the effect of smoking status indicated that smoking significantly predicted mortality or non-AIDS
morbidity unadjusted (HR 1.9, 95% CI 1.3–2.7) and adjusted for other covariates (aHR 1.9, 95% CI 1.2–2.9). Adjustment for smoking attenuated the adjusted risk
associated with female gender (aHR 0.7, 95% CI 0.4–1.3) and antihypertensive medication use (aHR 1.5, 95% CI 0.9–2.4) but not for age (aHR 1.6, 95% CI 1.2–2.0), IL-6
(aHR 1.3, 95% CI 1.1–1.6) or D-dimer (aHR 1.3, 95% CI 1.1–1.6). Another sensitivity analysis adjusting for history of exposure to PIs, NNRTIs, abacavir, tenofovir, stavudine,
zalcitabine, and lamivudine, which were significantly higher among older participants, did not notably alter the magnitude or significance of aHRs from the
multivariable model above.
doi:10.1371/journal.pone.0095061.t004
Another limitation is that the cohort largely consists of participants
in developed countries and causes of morbidity and mortality for
participants on suppressive cART with high CD4+ counts may be
different in developing countries. An additional limitation is that
older participants had different cART exposure than younger
participants, both duration and type of drugs. However, in a
sensitivity analysis, adjusting for these different cART exposures,
duration of cART use, and other covariates did not change the
associations of other covariates with the composite outcome.
In summary, the patterns of risk with age identified in this
report highlight that major morbidity and mortality will be
increasingly dominated by non-AIDS conditions and grade 4
events as individuals with HIV age. The age spectrum of persons
with HIV is shifting older worldwide, largely as a consequence of
effective treatment with cART. In the United States, the CDC
estimates that half of all HIV-infected individuals will be aged 50
or older by 2015. Thus, event rates presented here will be useful
for planning intervention studies aimed at interventions to treat or
prevent non-AIDS diseases among persons with HIV taking
suppressive cART.
Acknowledgments
We would like to acknowledge the participation of the SMART and
ESPRIT participants, the SMART study team (see [15,16] for the list of
SMART investigators), the ESPRIT study team (see [14] for the list of
ESPRIT investigators), and the INSIGHT executive committee. The
Medical Dictionary for Regulatory Activities (MedDRA) terminology is the
international medical terminology developed under the auspices of the
International Conference on Harmonization of Technical Requirements
for Registration of Pharmaceuticals for Human Use (ICH). MedDRA is a
registered trademark of the International Federation of Pharmaceutical
Manufacturers and Associations (IFPMA).
Author Contributions
Conceived and designed the experiments: CJM JVB AMB KME KHH
ACJ JN RP KP DW AW JW JDN. Performed the experiments: JDN.
Analyzed the data: CJM JN DW JDN. Contributed reagents/materials/
analysis tools: JDN. Wrote the paper: CJM JVB AMB KME KHH ACJ JN
RP KP DW AW JW JDN.
References
4. Triant VA, Lee H, Hadigan C, Grinspoon SK (2007) Increased acute
myocardial infarction rates and cardiovascular risk factors among patients with
human immunodeficiency virus disease. J Clin Endocrinol Metab 92: 2506–
2512.
5. Freiberg MS, Chang CC, Kuller LH, Skanderson M, Lowy E, et al. (2013) HIV
infection and the risk of acute myocardial infarction. JAMA Intern Med 173:
614–622.
6. Chow FC, Regan S, Feske S, Meigs JB, Grinspoon SK, et al. (2012) Comparison
of ischemic stroke incidence in HIV-infected and non-HIV-infected patients in a
US health care system. JAIDS 60: 351–358.
1. Mocroft A, Brettle R, Kirk O, Blaxhult A, Parkin JM, et al. (2002) Changes in
the cause of death among HIV positive subjects across Europe: results from the
EuroSIDA study. AIDS 16: 1663–1671.
2. Butt AA, Chang CC, Kuller L, Goetz MB, Leaf D, et al. (2011) Risk of heart
failure with human immunodeficiency virus in the absence of prior diagnosis of
coronary heart disease. Arch Intern Med 171: 737–743.
3. Obel N, Thomsen HF, Kronborg G, Larsen CS, Hildebrandt PR, et al. (2007)
Ischemic heart disease in HIV-infected and HIV-uninfected individuals: a
population-based cohort study. Clin Infect Dis 44: 1625–1631.
PLOS ONE | www.plosone.org
10
April 2014 | Volume 9 | Issue 4 | e95061
Adjudicated Outcomes among Individuals with HIV
7. Bedimo RJ, McGinnis KA, Dunlap M, Rodriguez-Barradas MC, Justice AC
(2009) Incidence of non-AIDS-defining malignancies in HIV-infected versus
noninfected patients in the HAART era: impact of immunosuppression. JAIDS
52: 203–208.
8. McGinnis KA, Fultz SL, Skanderson M, Conigliaro J, Bryant K, et al. (2006)
Hepatocellular carcinoma and non-Hodgkin’s lymphoma: the roles of HIV,
hepatitis C infection, and alcohol abuse. J Clin Oncol 24: 5005–5009.
9. Patel P, Hanson DL, Sullivan PS, Novak RM, Moorman AC, et al. (2008)
Incidence of types of cancer among HIV-infected persons compared with the
general population in the United States, 1992–2003. Ann Internal Med 148:
728–736.
10. Deeks SG, Tracy R, Douek DC (2013) Systemic effects of inflammation on
health during chronic HIV infection. Immunity 39: 633–645.
11. CDC (2008) Diagnoses of HIV infection and AIDS in the United States and
dependent areas, 2008. HIV Surveillance Reports 20.
12. CDC (2009) Diagnoses of HIV infection and AIDS in the United States and
dependent areas, 2009. HIV Surveillance Reports 21.
13. Health Protection Agency (2010) HIV in the United Kingdom: 2010 report.
Health Protection Report 4.
14. Abrams D, Levy Y, Losso MH, Babiker A, Collins G, et al. (2009) Interleukin-2
therapy in patients with HIV infection. NEJM 361: 1548–1559.
15. El-Sadr WM, Grund B, Neuhaus J, Babiker A, Cohen CJ, et al. (2008) Risk for
opportunistic disease and death after reinitiating continuous antiretroviral
therapy in patients with HIV previously receiving episodic therapy: a
randomized trial. Ann Intern Med 149: 289–299.
16. El-Sadr WM, Lundgren JD, Neaton JD, Gordin F, Abrams D, et al. (2006)
CD4+ count-guided interruption of antiretroviral treatment. NEJM 355: 2283–
2296.
17. Panel on Antiretroviral Guidelines for Adults and Adolescents (2012) Guidelines
for the use of antiretroviral agents in HIV-1 infected adults and adolescents.
Department of Health and Human Services. Available: http://aidsinfo.nih.gov/
contentfiles/lvguidelines/AdultandAdolescentGL.pdf. Accessed 2013 Nov 8.
18. Lifson AR, Belloso WH, Davey RT, Duprez D, Gatell JM, et al. (2010)
Development of diagnostic criteria for serious non-AIDS events in HIV clinical
trials. HIV Clin Trials 11: 205–219.
19. Lifson AR, Rhame FS, Belloso WH, Dragsted UB, El-Sadr WM, et al. (2006)
Reporting and evaluation of HIV-related clinical endpoints in two multicenter
international clinical trials. HIV Clin Trials 7: 125–141.
20. Copenhagen HIV Programme (2005) Coding Causes of Death in HIV Protocol.
Available: http://www.chip.dk/Portals/_default/pdf_folder/code_protocol_
ver_1.0.pdf. Accessed 2013 Nov 8.
PLOS ONE | www.plosone.org
21. Lifson AR, Belloso WH, Carey C, Davey RT, Duprez D, et al. (2008)
Determination of the underlying cause of death in three multicenter
international HIV clinical trials. HIV Clin Trials 9: 177–185.
22. Levey AS, Stevens LA, Schmid CH, Zhang YL, Castro AF 3rd, et al. (2009) A
new equation to estimate glomerular filtration rate. Ann Intern Med 150: 604–
612.
23. Kuller LH, Tracy R, Belloso W, De Wit S, Drummond F, et al. (2008)
Inflammatory and coagulation biomarkers and mortality in patients with HIV
infection. PLoS Med 5: e203.
24. Lane HC (2010) Baseline D-dimer levels identify a subset of patients at higher
risk of death following IL-2 administration. 18th Conference on Retroviruses
and Opportunistic Infections. Boston, MA.
25. Friis-Moller N, Sabin CA, Weber R, d’Arminio Monforte A, El-Sadr WM, et al.
(2003) Combination antiretroviral therapy and the risk of myocardial infarction.
NEJM 349: 1993–2003.
26. Poirier P, Giles TD, Bray GA, Hong Y, Stern JS, et al. (2006) Obesity and
cardiovascular disease: pathophysiology, evaluation, and effect of weight loss: an
update of the 1997 American Heart Association Scientific Statement on Obesity
and Heart Disease from the Obesity Committee of the Council on Nutrition,
Physical Activity, and Metabolism. Circulation 113: 898–918.
27. Borges AH, Silverberg MJ, Wentworth D, Grulich AE, Fatkenheuer G, et al.
(2013) Predicting risk of cancer during HIV infection: the role of inflammatory
and coagulation biomarkers. AIDS 27: 1433–1441.
28. Duprez DA, Neuhaus J, Kuller LH, Tracy R, Belloso W, et al. (2012)
Inflammation, coagulation and cardiovascular disease in HIV-infected individuals. PloS ONE 7: e44454.
29. Grund B, Baker JV, Deeks S, Wolfson J, Wentworth D, et al. Combined effect of
interleukin-6 and D-dimer on the risk of serious non-AIDS conditions: data from
3 prospective cohorts; 2013.
30. Babiker AG, Emery S, Fatkenheuer G, Gordin FM, Grund B, et al. (2013)
Considerations in the rationale, design and methods of the Strategic Timing of
AntiRetroviral Treatment (START) study. Clin Trials 10: S5–S36.
31. Lonn E, Bosch J, Teo KK, Pais P, Xavier D, et al. (2010) The polypill in the
prevention of cardiovascular diseases: key concepts, current status, challenges,
and future directions. Circulation 122: 2078–2088.
32. Psaty BM (2010) Drug therapies for the primary prevention of cardiovascular
events: trials and errors: 2009 Ancel Keys Memorial Lecture. Circulation 121:
940–945.
33. Reisler RB, Han C, Burman WJ, Tedaldi EM, Neaton JD (2003) Grade 4 events
are as important as AIDS events in the era of HAART. JAIDS 34: 379–386.
11
April 2014 | Volume 9 | Issue 4 | e95061
© Copyright 2026 ExpyDoc