International Journal of Advanced Research in Computer Engineering & Technology (IJARCET)
Volume 3 Issue 10, October 2014
SIGNAL TO NOISE RATIO ESTIMATION OF QAM AND QPSK
MODULATION TECHNIQUE AT 910MHz and 2116.4 MHz
USING MEASURED DATA
1
2
3
4
Alumona T.L, G.N Onoh, Mbanugo P.C, Ugwuoke O.O
1, 3,4
Department of Electronic and Computer Engineering NnamdiAzikiwe University, Awka, Nigeria
Department of Electrical / Electronic Engineering Enugu State University of science and technology
2
Estimation of signal to noise ratio for the
received signal is an important task in
communication systems. The knowledge of the
SNR is a requirement on many systems in order
to perform efficient signal detection and link
adaptation. In adaptive modulation system we
need a way to decide which modulation level is
best suited for the present channel condition, in
this paper we decided to use the estimated SNR
of the link as a channel metric to decide the
switching levels. The channel estimation using
two digital modulation technique (QAM and
QPSK) are considered in W-CDMA environment,
as we increase the range of communication, we
step down to lower modulation (QPSK) but as
we reduce the communication range means we
are closer to the base station; we can utilize
higher order modulation (QAM) for increase in
throughput thus allowing the system to
overcome
multipath
fading
and
other
interferences. The results shows that the values
of signal to noise ratio (SNR) from 10-12dB, the
modulation scheme that yielded the desired
-3
BER of 10 is QPSK modulation technique while
SNR values greater than 18dB, QAM modulation
technique can be used doubling the capacity
compared with QPSK modulation technique.
Index Terms - QAM, QPSK,SNR and W-CDMA
NETWORK
1.0
INTRODUCTION
W- CDMA offers many advantages which include
jam resistance, privacy and flexibility. CDMA has
been considered and recognized as a viable
alternative to both FDMA and TDMA[1]. W-CDMA
schemes have many advantages over FDMA and
TDMA but these advantages are hindered by the
increasing interference caused by other active
terminals, since all signals in the W-CDMA system
share the same transmission bandwidth. Blocking
occurs when the tolerance limit to interference is
exceeded, hence in W-CDMA, the level of
interference is a limiting factor [2]. Consider a
receiver and two terminals (transmitters) with one
closer to the receiver and the other farther away. If
they transmit simultaneously at equal powers, then
the receiver will receive more power from the nearer
transmitter. Since one’s transmitted signal is the
other’s noise, the signal-to-noise ratio(SNR) for the
farther transmitter is much lower. If the nearer
transmitter transmits a signal of magnitude higher
than the farther transmitter, then the SNR for the
latter may be below detect ability and may as well
not
transmit.
This
effectively
jams
the
communication channel.
This problem is commonly solved by dynamic
modulation and dynamic output power adjustment
of the transmitters [2]. That is, the nearer
transmitter uses less power and higher order
modulation techniques so that the SNR for all
transmitters at the receiver is roughly the same
2.2 Related Work
2.2.1 Modulation Schemes in Wireless System
Quadrature Phase Shift Keying (QPSK)
Modulation
Quadrature Phase Shift Keying (QPSK) is the digital
modulation technique. Quadrature Phase Shift
Keying (QPSK) is a form of Phase Shift Keying in
which two bits are modulated at once, selecting one
of four possible carrier phase shifts (0, Π/2, Π, and
3Π/2). QPSK perform by changing the phase of the
In-phase (I) carrier from 0° to 180° and the
Quadrature-phase (Q) carrier between 90° and 270°.
This is used to indicate the four states of a 2-bit
binary code. Each state of these carriers is referred
to as a Symbol [3].
QPSK performs by changing the phase of the Inphase (I) carrier from 0° to 180° and the Quadraturephase (Q) carrier between 90° and270°. This is used
to indicate the four states of a 2-bit binary code.
Each state of these carriers is referred to as a
Symbol.Quadrature Phase-shift Keying (QPSK) is a
widely used method of transferring digital data by
changing or modulating the phase of a carrier signal.
In QPSK digital data is represented by 4 points
around a circle which correspond to 4 phases of the
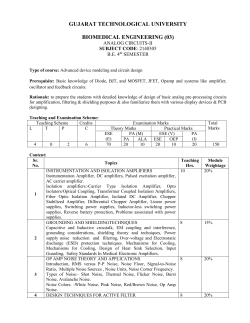
carrier signal. These points are called symbols. Fig
2.1 shows this mapping.
3572
ISSN: 2278 – 1323
All Rights Reserved © 2014 IJARCET
International Journal of Advanced Research in Computer Engineering & Technology (IJARCET)
Volume 3 Issue 10, October 2014
2.3.2 BER Expressions for Rayleigh Fading
Channel.
The mathematical expression for the BER
performance of BPSK, 4-QAM and square 16point QAM over a Rayleigh fading channel are
given [4] as
…2.5
Fig 2.1: QPSK diagram showing how four
different binary codes transmitted
-----2.6
M-ary
Quadrature
Amplitude
Modulation (QAM)
The Modulation equation for QAM is a variation of
the one used for PSK. The generalized PSK allows
changing the Amplitude and the Phase. In PSK all
points lie on a circle so the I and Q values are
related to each other.PSK signals are constant
envelop because of this; all points have the same
amplitude [3] . If we allow the phase and amplitude
to change from symbol to symbol, then we get a
modulation called quadrature amplitude modulation
(QAM) .It can be considered a linear combination of
two DSB-SC.so it is an AM and a PM modulation at
same time.
t)fct------2.1
(t)
This equation can be used to create an hybrid type
of modulation that varies both in amplitude and the
phase. When M=16,we have 16 symbols, each
representing a four bit word. We can lay these out in
a circle but they would be too close an error rate is
likely to be high.
….2.8
According to [5], their work presents a mathematical
technique for determining the optimum transmission.
The throughputs defined as the number of bits per
second correctly received. Trade-offs between the
throughput and the operation range are observed,
and equations are derived for the optimal choice of
the design variables. These parameters are SNR
dependent and can be adapted dynamically in
response to the mobility of a wireless data terminal.
They also looked at the joint optimization problem
involving all the design parameters together. They
found that not all the three parameters (data rate ‘b’,
SNR, Length of packet) need to be adapted
simultaneously: in the received SNR per symbol
stays at some rate so that the received SNR per
symbol stays at some preferred value.
They also varied received power by changing the
distance between the transmitter and receiver.
Finally, they gave a characterization of the optimal
parameter values as functions of received SNR.
In 16QAM, we vary not just the phase of the symbol
but also the amplitude. In PSK, all symbols sat on a
circle so they all had the same amplitude.
2.3.1 BER Expressions for AWGN.
The mathematical expression for the BER
performance of BPSK, QPSK and square 16-point
QAM, assuming perfect clock and carrierrecovery,
in a Gaussian channel are given in [4] as
3.0 MEASUREMENTS ENVIRNOMENT
DESCRIPTION
-------------2.2
---------------2.3
-- 2.4
In equation 2.2, 2.3 and 2.3,
is the SNR
and Q(--) is the Q-function which is defined as
---2.4
Fig 2.2 Adaptive Modulation
This section presents all steps towards the actual
model design from field measurement. Two Base
Stations were visited and Measurement were taken,
Since Sub-Urban Prediction Models are required,
the selection of the two (2) representative sites was
done in such a way to accommodate the
environment scenarios in and around Owerri , Imo
State in Nigeria.
3573
ISSN: 2278 – 1323
All Rights Reserved © 2014 IJARCET
International Journal of Advanced Research in Computer Engineering & Technology (IJARCET)
Volume 3 Issue 10, October 2014
D
(KM)
Figure 3.1 shows the map of the visited sites
3.1
DETERMINATION OF
PATHLOSSES CHARACTERIZATION FOR
CATEGORY B
D
(KM)
ANTENN
A TILT
QAM
Pt
MEDI
MODUL (dBm) AN PL
ATION
(dbm)
MEDIA
N
Rx
dBm
0.1
4
-51
44.1
95
0.2
4
-53
44.1
97
0.3
4
-57
44.1
102
0.4
4
-58
44.1
102
0.5
4
-65
44.1
109
0.6
4
-67
44.1
113
0.7
4
-69
44.1
113
0.8
4
-70
44.1
114
0.9
4
-72
44.1
116
1.0
4
-74
44.1
118
1.1
4
-79
44.1
123
1.2
4
-82
44.1
126
1.3
4
-86
44.1
130
1.4
4
-88
44.1
132
1.5
4
-94
44.1
138
TABLE 3.1: Average PathlossFor Category B,
using QAM Modulation Technique
ANTE
NNA
TILT
QPSK
Pt
MODUL (dBm)
ATION
MEDIA
N
Rx
dBm
0.1
2
-62
19
0.2
2
-64
19
0.3
2
-65
19
0.4
2
-66
19
0.5
2
-67
19
0.6
2
-67
19
0.7
2
-68
19
0.8
2
-69
19
0.9
2
-71
19
1.0
2
-72
19
1.1
2
-77
19
1.2
2
-78
19
1.3
2
-79
19
1.4
2
-77
19
1.5
2
-79
19
TABLE 3.2 AveragePathloss For
QPSK Modulation Technique
MEDIA
N
PL
(dbm)
81
83
84
85
86
86
87
88
90
91
96
97
98
96
98
Category B ,
3.3
Estimation of Signal to noise Ratio
(SNR) from the measured Data
SNR is defined as the ratio of average signal to
average noise power. SNR can be expressed in dB
as [5]
SNR(dB)= 10logSNR…….. 3.1
SNR= Pt- PL(d)-Sr …………………3.2
Where Pt is the transmitted power in dBm , 44dBm
for W-cdma and 43dBm for Gsm, PL(d
is the path loss model andSr is the receiver
sensitivity in dBm
(-110dBm). Equation 3.1 and 3.2 were used to
calculate the SNR of the environment under study
Sub-Urban Area respectively and Matlab program
were written to plot the SNR against distance of the
testbed. Table 3.3 to 3.4 show the average path
loss and average SNRdB appendix E2 and E3
show the matlab codes used.
3574
ISSN: 2278 – 1323
All Rights Reserved © 2014 IJARCET
International Journal of Advanced Research in Computer Engineering & Technology (IJARCET)
Volume 3 Issue 10, October 2014
Average
Path loss
95
97
102
102
109
113
113
114
116
118
123
126
130
132
138
SNR (dB)
18.8
17.72
17.57
17.17
17.17
16.54
16.13
16.13
16.03
15.81
15.58
14.93
14.49
13.80
13.44
12.07
18.6
18.4
18.2
SNR
D
(KM)
0.1
0.2
0.3
0.4
0.5
0.6
0.7
0.8
0.9
1.0
1.1
1.2
1.3
1.4
1.5
18
17.8
17.6
17.4
0
0.5
1
1.5
distance
TABLE 3.3 AveragePathloss And SNR(dB) For
Category B QAM Modulation Technique (SubUrban)
Fig.3.3 Plot showing the average SNR of QPSK
modulation techniques against distance for
Sub-urban
Comparing Theoretical and Empirical Error Rates
0
10
Theoretical SER
Empirical SER
Symbol Error Rate
18
17
SNR
16
-1
10
15
14
-2
10
13
12
0
0.5
1
1.5
distance
Fig.3.2 Plot showing the average SNR of QAM
modulation techniques against distance for Suburban
D
(KM)
0.1
0.2
0.3
0.4
0.5
0.6
0.7
0.8
0.9
1.0
1.1
1.2
1.3
1.4
1.5
Average
Path loss
81
83
84
85
86
86
87
88
90
91
96
97
98
96
98
SNR(dB
)
18.64
18.52
18.45
18.39
18.33
18.33
18.23
18.20
18.07
18.00
17.64
17.56
17.49
17.64
17.49
0
2
4
6
8
Eb/N0 (dB)
10
12
14
Fig.3.4 Plot showing the average Empirical
Symbol error rate and Theoretical symbol error
rate against SNR for the Environment under
study.
4.0 Conclusion
The necessity of these graphs is to show the
relationship of average SNR with distance, it was
observed that the SNR and path loss depends on
the distance and measurement environment. In
this experiment, the channel or the link is very
good, since the theoretical symbol error and
empirical symbol error are nearly the same, thus no
bit error. the results shows that the values of signal
to noise ratio (SNR) from 10-12dB, the modulation
-3
scheme that yielded the desired BER of 10 is
QPSK modulation technique while SNR values
greater than 18dB, QAM modulation technique can
be used doubling the capacity compared with
QPSK modulation technique
TABLE 3.4average pathloss and SNR for category
B QPSK modulation technique (Sub- Urban)
3575
ISSN: 2278 – 1323
All Rights Reserved © 2014 IJARCET
International Journal of Advanced Research in Computer Engineering & Technology (IJARCET)
Volume 3 Issue 10, October 2014
APPENDIX E2
%% ALUMONA THEOPHILUS ECE DEPT UNIZIK
%% ===MATLAB PROGRAM TO COMPARE THE
SNR OF MEASURED DATA OF QAM
MODULATION TECHNIQUE WITH DISTANCE
journal on Selected Areas in Communications, Vol.
23, No.2, , pp 201-220 February 2005.
[6]
Medeisis ,and Kajackas “ Use of the
Universal Okumura Hata Propagation Prediction
Model in Rural Area‟‟ Vehicular Technology
d = [ 0.1 0.2 0.3 0.4 0.5 0.6 0.7 0.8
0.9 1.0 1.1 1.2 1.3 1.4 1.5];
SNR =
[17.7217.5717.1717.1716.5416.1316.1316
.0315.8115.5814.9314.4913.8013.4412.07
];
plot(d,SNR,'-r+')
xlabel('distance'),ylabel('SNR')
1818 (2000)
[56] Siwiak, and Kazimierz, “ Radio Propagation
and Antenna for personal Communication” Artech
House, Boston London (1995)
AUTHOR
APPENDIX E3
%% ===MATLAB PROGRAM TO COMPARE THE
SNR OF MEASURED DATA OF QPSK
MODULATION TECHNIQUE WITH DISTANCE
d = [ 0.1 0.2 0.3 0.4 0.5 0.6 0.7 0.8
0.9 1.0 1.1 1.2 1.3 1.4 1.5];
SNR =
[18.6418.5218.4518.3918.3318.3318.2318
.2018.0718.0017.6417.5617.4917.6417.49
];
plot(d,SNR,'-b+')
xlabel('distance'),ylabel('SNR')
REFERENCES
[1]
Conference Proceedings, VTC Tokyo, Vol 3 pp
Proakis, G.J. “Digital Communication”
Engr. TheophilusAlumonais a Ph.D. holder in Electronic
and Computer Engineering. He has a Master‟s Degree
in Communication Engineering from NnamdiAzikiwe
University, Awka, Anambra State, Nigeria. He also holds
a B.Eng. in Electronic and Computer Engineering. His
areas of interest include Modeling and Simulation of
Communication Networks, Expert Systems, Intelligent
Control, Wireless Sensor Networks, Forensic Computing,
and many other area. He is a Member of Nigeria Society
of Engineers, NSE, COREN and IAENG.
Mbanugo Promise C is a Post Graduate student of Electronics and
Computer Engineering in NnamdiAzikiwe University. His area of
interest is Intelligent Control, Wireless Sensor Networks and
Telecommunication.
fourth Edition, McGraw-hill International Editions
2001.
[2]
Gunnarsson, F. “Power Control in Wireless
Networks: characteristics and fundamentals, “in
Wireless Communications Systems and Networks,
M. Guizani, Ed. New York: Plenum Press, pp. 17920 (2004).
[3]
Virgillo, R. and Goodman, D. „Prioritized
Throughput Maximization via Rate and Power
Control for 3g CDMA: The 2 Terminal Scenario‟,
Brooklyn Polytechnic University (2002).
[4]
Karalayali, M.K et al, “Downlink throughput
maximization in CDMA wireless Networks, “in Proc.
Of IEEE Wireless Communication and Network
Conference (2004).
[5]
Simon Haykin, “Cognitive Radio: Brain-
Empowered Wireless Communications,” IEEE
3576
ISSN: 2278 – 1323
All Rights Reserved © 2014 IJARCET
© Copyright 2026 ExpyDoc