ABSTRACT
SNR ESTIMATION AND JAMMING DETECTION TECHNIQUES USING
WAVELETS
By
Paula Quintana Quiros
December 2014
An SNR estimation approach and a jamming detector based on wavelet
transform theory are presented. The SNR estimator is an in-service, non-dataaided estimator that operates on M-PSK and QAM modulated signals transmitted over baseband CWGN channels. The signal and noise power are separated
through a non-linear wavelet technique known as denoising.
Two wavelet-based estimators are presented. The first method uses hardthresholding which extracts the amplitude trend over one or several symbol periods, depending on whether the modulation is constant or multi-level envelope.
The second method uses adaptive soft-thresholding and applies a self-similarity
criterion between the signal and wavelet. A SNR Moments estimator was also developed as a reference for evaluation purposes. A jamming detector based on discontinuity recognition using wavelets is presented. The detector is implemented
for constant-envelope modulation schemes, leaving the multi-level case for future
research.
SNR ESTIMATION AND JAMMING DETECTION TECHNIQUES USING
WAVELETS
A THESIS
Presented to the Department of Electrical Engineering
California State University, Long Beach
In Partial Fulfillment
of the Requirements for the Degree
Master of Science in Electrical Engineering
Committee Members:
Chit-Sang Tsang, Ph.D. (Chair)
Hen-Geul Yeh, Ph.D.
Mohammad Mozumdar, Ph.D.
College Designee:
Antonella Sciortino, Ph.D.
By Paula Quintana Quiros
B.S., 2010, Costa Rica Institute of Technology
December 2014
UMI Number: 1569590
All rights reserved
INFORMATION TO ALL USERS
The quality of this reproduction is dependent upon the quality of the copy submitted.
In the unlikely event that the author did not send a complete manuscript
and there are missing pages, these will be noted. Also, if material had to be removed,
a note will indicate the deletion.
UMI 1569590
Published by ProQuest LLC (2014). Copyright in the Dissertation held by the Author.
Microform Edition © ProQuest LLC.
All rights reserved. This work is protected against
unauthorized copying under Title 17, United States Code
ProQuest LLC.
789 East Eisenhower Parkway
P.O. Box 1346
Ann Arbor, MI 48106 - 1346
ACKNOWLEDGEMENTS
I wish to thank my advisor Dr.Chit-Sang Tsang for his guidance and patience in the development of this thesis, especially considering my non-flexible
schedule as a full time student with an off-campus, full-time job. I appreciate his
flexibility and his willingness to share with me his research resources, including
textbooks and personal papers.
I want to thank my parents and Dr. Noguera for their unconditional support. Finally, I want to thank Fausto for helping me find supporting research material for the thesis and for tutoring me on how to use LateX.
iii
TABLE OF CONTENTS
Page
ACKNOWLEDGEMENTS . . . . . . . . . . . . . . . . . . . . . . . . . . . . . . . . . . . . . . . . . . . . . . . . . . . . . . . .
iii
LIST OF TABLES . . . . . . . . . . . . . . . . . . . . . . . . . . . . . . . . . . . . . . . . . . . . . . . . . . . . . . . . . . . . . . . . .
vi
LIST OF FIGURES . . . . . . . . . . . . . . . . . . . . . . . . . . . . . . . . . . . . . . . . . . . . . . . . . . . . . . . . . . . . . . . . vii
CHAPTER
1. INTRODUCTION . . . . . . . . . . . . . . . . . . . . . . . . . . . . . . . . . . . . . . . . . . . . . . . . . . . . . . . . . .
1
Background . . . . . . . . . . . . . . . . . . . . . . . . . . . . . . . . . . . . . . . . . . . . . . . . . . . . . . . . . . . . .
SNR Estimators Timeline . . . . . . . . . . . . . . . . . . . . . . . . . . . . . . . . . . . . . . . . . . . . . .
History of Wavelets . . . . . . . . . . . . . . . . . . . . . . . . . . . . . . . . . . . . . . . . . . . . . . . . . . . . .
1
3
7
2. COMMUNICATIONS SYSTEM MODEL . . . . . . . . . . . . . . . . . . . . . . . . . . . . . . . . 12
Introduction. . . . . . . . . . . . . . . . . . . . . . . . . . . . . . . . . . . . . . . . . . . . . . . . . . . . . . . . . . . . . 12
Transmitter Model . . . . . . . . . . . . . . . . . . . . . . . . . . . . . . . . . . . . . . . . . . . . . . . . . . . . . 12
3. SNR ESTIMATION AND JAMMING DETECTION . . . . . . . . . . . . . . . . . . . 21
Estimation Theory . . . . . . . . . . . . . . . . . . . . . . . . . . . . . . . . . . . . . . . . . . . . . . . . . . . . . 21
SNR Estimation . . . . . . . . . . . . . . . . . . . . . . . . . . . . . . . . . . . . . . . . . . . . . . . . . . . . . . . . 26
Jamming Detection . . . . . . . . . . . . . . . . . . . . . . . . . . . . . . . . . . . . . . . . . . . . . . . . . . . . . 35
4. PERFORMANCE EVALUATION . . . . . . . . . . . . . . . . . . . . . . . . . . . . . . . . . . . . . . . . 37
5. SIMULATION AND RESULTS . . . . . . . . . . . . . . . . . . . . . . . . . . . . . . . . . . . . . . . . . . . 40
Introduction. . . . . . . . . . . . . . . . . . . . . . . . . . . . . . . . . . . . . . . . . . . . . . . . . . . . . . . . . . . . .
Transmitter and Channel Models . . . . . . . . . . . . . . . . . . . . . . . . . . . . . . . . . . . . .
Moments Estimator . . . . . . . . . . . . . . . . . . . . . . . . . . . . . . . . . . . . . . . . . . . . . . . . . . . .
Wavelet-Based SNR Estimator 1: Trend Detector . . . . . . . . . . . . . . . . . .
Wavelet-Based SNR Estimator 2: Self-Similarity Detector . . . . . . . . .
Performance Comparison Among SNR Estimators . . . . . . . . . . . . . . . . . .
Wavelet-Based Jamming Detector. . . . . . . . . . . . . . . . . . . . . . . . . . . . . . . . . . . . .
40
41
43
57
70
79
87
6. CONCLUSION . . . . . . . . . . . . . . . . . . . . . . . . . . . . . . . . . . . . . . . . . . . . . . . . . . . . . . . . . . . . . . 96
SNR Estimators . . . . . . . . . . . . . . . . . . . . . . . . . . . . . . . . . . . . . . . . . . . . . . . . . . . . . . . . 96
Wavelet-Based Jamming Detector. . . . . . . . . . . . . . . . . . . . . . . . . . . . . . . . . . . . . 99
General Conclusions . . . . . . . . . . . . . . . . . . . . . . . . . . . . . . . . . . . . . . . . . . . . . . . . . . . . 99
iv
Page
APPENDICES . . . . . . . . . . . . . . . . . . . . . . . . . . . . . . . . . . . . . . . . . . . . . . . . . . . . . . . . . . . . . . . . . . . . . . 100
A. MOMENTS ESTIMATOR: SIMULINK IMPLEMENTATION . . . . . . . . 101
B. WAVELET-BASED ESTIMATOR 1: TREND DETECTOR . . . . . . . . . . 106
C. WAVELET BASED ESTIMATOR 2: SIMILARITY DETECTOR . . . . 110
D. WAVELET-BASED JAMMING DETECTOR . . . . . . . . . . . . . . . . . . . . . . . . . . . 112
BIBLIOGRAPHY . . . . . . . . . . . . . . . . . . . . . . . . . . . . . . . . . . . . . . . . . . . . . . . . . . . . . . . . . . . . . . . . . . 114
v
LIST OF TABLES
TABLE
Page
1
16-QAM Mapping . . . . . . . . . . . . . . . . . . . . . . . . . . . . . . . . . . . . . . . . . . . . . . . . . . . . . . . . . 17
2
Implementations of the Moments Estimator. . . . . . . . . . . . . . . . . . . . . . . . . . . . . 44
3
Wavelet-Based Estimator 1 Performance Comparison.. . . . . . . . . . . . . . . . . . 60
4
Bias of the SNR Estimate, Wavelet-Based Estimator 2. . . . . . . . . . . . . . . . . 79
5
Wavelet-Based Jamming Detector, Pattern 1 . . . . . . . . . . . . . . . . . . . . . . . . . . . . 93
6
Wavelet-Based Jamming Detector, Pattern 2 . . . . . . . . . . . . . . . . . . . . . . . . . . . . 95
vi
LIST OF FIGURES
FIGURE
Page
1
SNR estimation research timeline according to researchers. . . . . . . . . . . . . . . .
5
2
General baseband system model. . . . . . . . . . . . . . . . . . . . . . . . . . . . . . . . . . . . . . . . . . . . . 13
3
Binary source model. . . . . . . . . . . . . . . . . . . . . . . . . . . . . . . . . . . . . . . . . . . . . . . . . . . . . . . . . . 13
4
QPSK and 8PSK constellations.. . . . . . . . . . . . . . . . . . . . . . . . . . . . . . . . . . . . . . . . . . . . . 15
5
QAM constellation. . . . . . . . . . . . . . . . . . . . . . . . . . . . . . . . . . . . . . . . . . . . . . . . . . . . . . . . . . . . 17
6
Gaussian joint PDF of the real random variables U and V. . . . . . . . . . . . . . . . 19
7
Moments Estimator used as reference (estimator 1). . . . . . . . . . . . . . . . . . . . . . . 29
8
Discrete Wavelet Transform using filter banks.. . . . . . . . . . . . . . . . . . . . . . . . . . . . . 31
9
Wavelet analysis block for Wavelet-Based Estimator 1. . . . . . . . . . . . . . . . . . . . 32
10 Wavelet-Based Estimator 1. . . . . . . . . . . . . . . . . . . . . . . . . . . . . . . . . . . . . . . . . . . . . . . . . . 32
11 Wavelet analysis block for Wavelet-Based Estimator 2. . . . . . . . . . . . . . . . . . . . 33
12 Wavelet-Based Estimator 2. . . . . . . . . . . . . . . . . . . . . . . . . . . . . . . . . . . . . . . . . . . . . . . . . . 34
13 Wavelet-Based Jamming Detector. . . . . . . . . . . . . . . . . . . . . . . . . . . . . . . . . . . . . . . . . . . 36
14 MPSK transmitter in Simulink. . . . . . . . . . . . . . . . . . . . . . . . . . . . . . . . . . . . . . . . . . . . . . 42
15 Transmitter and channel models in Simulink . . . . . . . . . . . . . . . . . . . . . . . . . . . . . . . 43
16 Sampling frequency response of the Moments Estimator - QPSK.. . . . . . . . 48
17 Moments Estimator performance (NMSE) - QPSK. . . . . . . . . . . . . . . . . . . . . . . . 49
18 Moments Estimator performance (NBIAS, NVAR) - QPSK. . . . . . . . . . . . . . . 49
19 Moments Estimator performance (NMSE) - QPSK, 8PSK. . . . . . . . . . . . . . . . 50
vii
FIGURE
Page
20 Moments Estimator performance (NBIAS, NVAR) - QPSK, 8PSK. . . . . . . 51
21 Moments Estimator performance (NMSE) - 16QAM. . . . . . . . . . . . . . . . . . . . . . 53
22 Moments Estimator performance (NBIAS, NVAR) - 16QAM. . . . . . . . . . . . . 53
23 Moments Estimator performance (NMSE vs SNR(dB)). . . . . . . . . . . . . . . . . . . 54
24 Moments Estimator performance (NVAR and NBIAS). . . . . . . . . . . . . . . . . . . . 55
25 Moments Estimator performance (NMSE) - MPSK, 16QAM. . . . . . . . . . . . . 56
26 Moments Estimator performance (NBIAS, NVAR) - MPSK, 16QAM. . . . 56
27 Wavelet-Based Estimator 1 (NMSE). . . . . . . . . . . . . . . . . . . . . . . . . . . . . . . . . . . . . . . . 59
28 Wavelet-Based Estimator 1 (NBIAS).. . . . . . . . . . . . . . . . . . . . . . . . . . . . . . . . . . . . . . . 61
29 Wavelet-Based Estimator 1 (NVAR). . . . . . . . . . . . . . . . . . . . . . . . . . . . . . . . . . . . . . . . 62
30 DWT components using Wavelet-Based Estimator 1. . . . . . . . . . . . . . . . . . . . . . 64
31 16QAM signal amplitude at the receiver. . . . . . . . . . . . . . . . . . . . . . . . . . . . . . . . . . . . 65
32 Noise comparison: channel vs Wavelet-Based Estimator 1. . . . . . . . . . . . . . . . 66
33 Wavelet-Based Estimator 1 (NMSE) - 16QAM. . . . . . . . . . . . . . . . . . . . . . . . . . . . . 68
34 Wavelet-Based Estimator 1 (NBIAS, NVAR) - 16QAM. . . . . . . . . . . . . . . . . . . 69
35 Wavelet-Based Estimator 1 (NMSE) - 16QAM, various Fs . . . . . . . . . . . . . . . . 70
36 Wavelet-Based Estimator 1 (NBIAS, NVAR) - 16QAM, various Fs . . . . . . 71
37 Wavelet-Based Estimator 1 (NMSE) - QPSK, 8PSK. . . . . . . . . . . . . . . . . . . . . . 72
38 Wavelet-Based Estimator 1 (NBIAS, NVAR) - QPSK, 8PSK. . . . . . . . . . . . . 73
39 Wavelet-Based Estimator 2 (NMSE) - 16QAM. . . . . . . . . . . . . . . . . . . . . . . . . . . . . 75
40 Wavelet-Based Estimator 2 (NBIAS, NVAR) - 16QAM. . . . . . . . . . . . . . . . . . . 76
41 Wavelet-Based Estimator 2 (NMSE) - QPSK, 8PSK. . . . . . . . . . . . . . . . . . . . . . 77
42 Wavelet-Based Estimator 2 (NBIAS, NVAR) - QPSK, 8PSK. . . . . . . . . . . . . 78
viii
FIGURE
Page
43 Performance comparison (NMSE) for all SNR estimators - 16QAM. . . . . . 81
44 Performance comparison (NBIAS) for all SNR estimators - 16QAM. . . . . 82
45 Performance comparison (NVAR) for all SNR estimators - 16QAM. . . . . . 83
46 Performance comparison (NMSE) for all SNR estimators - QPSK.. . . . . . . 84
47 Performance comparison (NBIAS) for all SNR estimators - QPSK. . . . . . . 85
48 Performance comparison (NVAR) for all SNR estimators - QPSK. . . . . . . . 86
49 Performance comparison (NMSE) for all SNR estimators - 8PSK. . . . . . . . 88
50 Performance comparison (NBIAS) for all SNR estimators - 8PSK. . . . . . . . 89
51 Performance comparison (NVAR) for all SNR estimators - 8PSK. . . . . . . . 90
52 Jamming sources used to evaluate the jamming detector, Fs = 32. . . . . . . . 91
53 Front end stages (signals) of the jamming detector, Fs = 32. . . . . . . . . . . . . . 93
54 Front end stages (signals) of the jamming detector, Fs = 32, Fs = 1. . . . . . 94
55 Power envelope trend obtained using wavelet filters (WF), Fs = 1.. . . . . . . 94
56 Power envelope trend and jamming detection signal, Fs = 1. . . . . . . . . . . . . . 95
57 Moments Estimator: implementation 1. . . . . . . . . . . . . . . . . . . . . . . . . . . . . . . . . . . . . 102
58 Moments Estimator: implementation 2. . . . . . . . . . . . . . . . . . . . . . . . . . . . . . . . . . . . . 103
59 Moments Estimator: implementation 3 (MPSK performance). . . . . . . . . . . . 104
60 Moments Estimator: implementation 3 (QAM performance). . . . . . . . . . . . . 105
61 Wavelet-Based Estimator 1: constant envelope modulation schemes. . . . . 107
62 Wavelet-Based Estimator 1: multi-level modulation schemes. . . . . . . . . . . . . 108
63 Wavelet-Based Estimator 1: hard threshold block. . . . . . . . . . . . . . . . . . . . . . . . . 109
64 Wavelet-Based Estimator: self-similarity detector. . . . . . . . . . . . . . . . . . . . . . . . . 111
65 Wavelet-Based Jamming Detector. . . . . . . . . . . . . . . . . . . . . . . . . . . . . . . . . . . . . . . . . . . 113
ix
CHAPTER 1
INTRODUCTION
Background
Modern communications systems today face high demands in terms of
performance, reliability and efficiency. To achieve these high standards of operation, the industry continues to invest in the design and implementation of complex algorithms that produce performance enhancements. This panorama is very
different when compared to the one in the past, when research on some of these
performance-enhancing algorithms first begun.
A few decades back, the development of Signal-to-Noise Ratio (SNR) estimation algorithms was addressed to theoretical realizations, due to the complexity
that their implementations would portray. Total received power measurements
were preferred over SNR measurements because of limitations in hardware platforms available at the time. Moreover, the performance enhancement by an SNR
estimate was considered negligible and therefore unnecessary for the contemporaneous applications.
Communication services have changed dramatically compared to those
available in the 1960s when the first SNR estimation algorithms were developed.
Nowadays, powerful programmable and low-cost digital hardware devices make it
possible to implement complex algorithms that exhibit the accuracy required to
generate a significant impact in the system’s overall performance.
1
It is pertinent to justify the aim of this thesis on the development of the
SNR estimator. The SNR estimate in a digital receiver indicates the quality of
the transmission link. Because of this, many performance-enhancing applications
use the SNR measurement as an input parameter. For example, many advanced
transmission schemes work under adaptive coding and modulation techniques that
require in-service channel quality monitoring to operate. Most of these adaptation
methods use the SNR estimate as an input, placing high requirements and demands on the accuracy of the estimator. Other monitoring applications like power
control, equalization, timing and symbol detection are also examples of applications that use the SNR estimate to improve system performance. On-line improvement of the transmission link can be accomplished through error correcting codes,
based on the measured BER (Bit Error Rate) or SER (Symbol Error Rate) of the
incoming signal [1]. The absolute value of these performance parameters can be
derived from SNR estimates as well.
Coherent digital receivers are built to decode signals with specific timing
and waveform characteristics. Under this criterion, matched filters are used to
estimate the correct value and timing of incoming digital symbols in a receiver.
The idea of using wavelet theory to measure the SNR is to take advantage of the
waveform of digital signals, which are characterized by abrupt transitions and
discrete amplitude levels. Well-known signal processing analysis techniques like
Fourier decompose signals using a basis comprised by soft sinusoidal functions,
which are not appropriate to represent digital data signals which are mathematically modeled by rectangular functions. Using square-like wavelets as our basis,
we can extract the trend of the data signal using this transform; at the same time
we will extract the white Gaussian noise with a non-linear method that dismisses
the wavelet components representing the details or high frequency variations.
2
As a way to exploit the study of wavelets, a jamming detector based on
wavelets is also presented. Abrupt changes in the power levels of the incoming
noise can be detected using the wavelet transforms, since these changes make the
signal non-stationary. Analysis techniques based on Fourier have the drawback
that in the transformation to the frequency domain, the time information is lost.
Wavelets present a significant advantage in that they have the ability to perform
local analysis; which means they can be used to analyze a segment of a larger
signal in time. In this thesis, the power envelope of the incoming signal is transformed to the wavelet domain, where abrupt transitions are detected monitoring
the detail or high resolution components at a given scale. The scale is selected to
detect an abrupt change over a certain number of symbol periods. Note that this
can be improved further to also include a multi-resolution implementation that
could inspect different scales of resolution and detect smoother transitions as well.
The multi-resolution implementation is left as an area of further study and is not
included in this thesis.
SNR Estimators Timeline
The interest in generating SNR estimates first began in 1964 when the
first paper on the topic was written as a university report by Nahi and Gaglierdi
[2]. A section of this work was published in the scientific journal IEEE Transactions on Information Theory in 1967 [3]. It introduced an estimator comprised
of a filter, a power computation module, and a Look Up Table (LUT). The work
was presented under the assumption that both the signal and noise were Gaussian
stochastic processes. Nahi and Gagliardi developed an expression for the output
power in terms of the filter’s transfer function and the SNR. Since the expression
given by this method is not easily invertible, the output power level was mapped
to a LUT to provide the SNR estimate [4].
3
In 1966, Gilchriest introduced the first in-service Squared Signal-to-Noise
Variance (SNV) estimator, which is based on the first absolute moment and the
second moment at the optimally sampled output of the matched filter in the receiver [5]. This estimator was developed to work with BPSK real signals in Additive Gaussian White Noise (AGWN), and has the drawback that it is only reliable
in the strong signal case (high SNR). Later in 1967, Layland considered the effects of noise distribution tails and developed correction expressions for low SNR
cases [6]. Layland’s results however, disregarded symbol transition estimation errors and were only true asymptotically with the sample size. The transition estimation errors were later included in his studies, but his expressions required numerical integration mathematics to be evaluated. In 1971, Lesh improved on the
works of Gilchriest and developed mean and variance expressions of the SNV estimator using, in conjunction, a Symbol Synchronizer Assembly (SSA) [7]. The expressions developed by Lesh considered the effect of noise distribution tails, finite
sample size, transition estimation errors, quantization errors, and internal equipment noise in the SNV estimate.
At the same time that Layland was performing his research in 1967, Benedict and Soong presented three different methods to compute the SNR: a Maximum Likelihood (ML) estimator, an amplitude Moments Estimator, and a squarelaw Moments Estimator [8]. They did not perform a single estimation of the SNR
parameter but separate estimations of carrier and noise strength in real AWGN.
Benedict and Soong’s derivation of the ML estimator is, as of today, complicated
compared to derivations presented by Kerr, Gagliardi, and Thomas; who based
their works on ML estimation theory. Kerr, Gagliardi, and Thomas included Probability Density Function (PDF) expressions for the estimator, as well as the analytic expressions of its variance and bias. The ML estimator developed by Gagliardi
4
FIGURE 1. SNR estimation research timeline according to researchers.
and Thomas in 1968 operates on-line in a coherent transmission system that uses
cross-correlation detection [9]. It assumes a band-limited AWGN channel and has
reduced bias, however it does use oversampling.
Jumping forward in time over a decade, the Split-Symbol Moments (SSM)
estimator was introduced in 1986 by Simon and Mileant [10]. This estimator uses
averaging for the first two moments of the integrated half symbols of a BPSK
modulated signal, which is transmitted over a wideband AWGN channel. This
method uses the Nyquist sampling rate and takes into account SNR degradation
factors associated with jitter in the sub-carrier demodulation and symbol synchronization loops. In 1989, Shah extended the study of the SSM estimator by considering the effects of the transmission over band-limited channels, quantifying the
effects of filtering which are considered to be Intersymbol Interference (ISI).
In 1993, Matzner presented and derived a second- and fourth-order Moments Estimator, M2 M4 , using a method that had already been presented by Bene-
5
dict and Soong as the Square-law estimator. Matzener’s derivation assumes complex baseband digitally modulated signals in complex AWGN, and includes more
derivation details compared to the one given by Benedict and Soong above; it also
evaluates the performance in terms of the Mean Square Error (MSE) in dB [11].
A year later, in 1994 Metzener together with Engleberger published another paper
on this same method for real signals, using a different approach on fourth order
moments [12]. Implementation details on this estimator were developed later in
1997 by Matzner, Engleberger and Siewert.
With all these methods at hand, it became necessary to compare the performance of the different SNR estimators under the same conditions. In 2000,
Pauluzzi and Beaulieu published their results on comparing different SNR estimation techniques for the AWGN Channel [13]. Most of their work was derived
from Pauluzzi’s thesis on the same topic [4]. This work presented a mathematical model that described the incoming signal at the receiver’s end. Each technique
is then adapted to the conditions of operation. Performance measurements in all
estimators are recorded using the Normalized MSE (NMSE), where a theoretical minimum NMSE is defined according to an unbiased estimator with variance
given by the Cramer-Rao Bound (CRB). Their conclusion on the comparisons performed is that the best estimator to use depends on the application. The scope of
this thesis is limited to uninterrupted in-service SNR estimators. For the category
of in-service estimators, Pauluzzi and Beaulieu indicate that the best estimator
to use depends on the block length, the number of samples per symbol, the type
of modulation used, the SNR range of interest, and the complexity of the method
preferred [13]. In general, the ML, SNV and M2 M4 estimators are relatively easy
to implement and perform identically along systems that employ any type of root-
6
Nyquist filter in the transmitter and the receiver as long as they have the same
gain.
Different approaches of most methods described have been re-formulated
considering new challenges regarding channel modeling and modulation schemes
available. In 2004, Simon and Dolinar working for the Jet Propulsion Laboratory
(JPL) developed studies to extend the use of the SSM estimator to high order
modulations [14]. In 2010, Alvarez-Diaz, Lopez-Valcarce and Mosquera presented
a Non-Data Aided (NDA) estimator dedicated to multilevel constellations using
higher order moments, using an approach based on linear combination of ratios of
certain even number statistics; where the weights of the linear combination can be
tuned according to the type of constellation and to the SNR operation range [15].
Most approaches, including the one presented in this thesis, focus on SingleInput Single-Output (SISO) channels with AWGN and static flat fading. There
are other new approaches that address the frequency selective and time-varying
channels, as well as the Multiple-Input Multiple Output (MIMO) cases, for applications like multi-antenna receivers, but they are beyond the scope of this thesis and
are included here for reference only [16] [17].
History of Wavelets
The original idea of decomposing or representing functions using orthogonal basis functions, was first developed by Joseph Fourier in 1807. It took 150
years to expand and generalize Fourier ideas for non-periodic functions and discrete time sequences. In 1965, a paper was published by Cooley and Tukey describing a very efficient algorithm to implement the Discrete Fourier Transform(DFT),
now known as the Fast Fourier Transform (FFT). The computation efficiency of
the FFT transformed the discipline of Digital Signal Processing (DSP) by making
7
Fourier analysis affordable, and one of the most widely used tools in mathematics
and engineering [18].
Fourier analysis transforms the view of a signal from a time-based domain
to a frequency-based domain. The major drawback of Fourier representation is
that it does not provide a compact support of signals in the time domain, which
means that time information is lost completely after the transformation. This occurs because Fourier functional basis are built out of time-infinite sinusoidal functions.
The likelihood for transients and non-stationary signals to appear in signal
processing applications is very common. As Mallat indicates in his work, ”The
world of transients is considerably larger and more complex than the garden of
stationary signals. The search for an ideal Fourier-like basis that would simplify
most signal processing is hopeless” [19].
In 1946, Dennis Garbor, an electrical engineer and physicist; in an attempt
to correct Fourier’s analysis drawback on time-frequency localization, modified the
FT to support non-stationary signal analysis. The method proposed by Garbor is
known as the Short Time Fourier Transform (STFT), and it is based on the segmentation of time domain signals using time-localized windows. The FT is then
applied on each segment providing a time-frequency representation at a fixed resolution, defined by the width of the window. Breaking up the signal in constant
time-segments for analysis does not provide the same representation accuracy for
all signals along the spectrum. High frequency components occur in short time
spans, requiring narrow time-windows for precise STFT analysis; while low frequency components require wide time-windows instead. Since the STFT uses a
fixed resolution, it must be tuned to support a single frequency band.
8
In the late 1970s, J. Morlet, a geophysical engineer working at a French oil
company, proposed a method that used Gaussian time-windows, which could be
time dilated or compressed to support analysis on different frequency bands. His
method is a two-variable version of the standard STFT procedure, with time location and compression scale as variables. The Gaussian time-window, which Morlet
called ”wavelet of constant shape,” provided compact support both in the time
and frequency domain, with typical limitations given by the uncertainty principle. Morlet’s wavelet transform was not recognized as a reliable mathematical tool
by his colleagues, which forced Morlet to seek help from the theoretical physicist
A. Grossman. Morlet asked Grossman to provide a mathematical footing on his
wavelet transform. It was later found that Morlet and Grossman’s work was originally discovered with a different interpretation by A. Calderon in 1964, who used
it on harmonic analysis, a discipline in pure mathematics that grew out of Fourier
analysis.
The work developed by Calderon, and later rediscovered by Morlet and
Grossman, was based on wavelet redundant series, supported by the idea that redundancy provided better time-frequency localization. In 1985, Y. Meyer focused
on the development of an orthogonal wavelet basis, which proved to perform better than the, so far well known, redundant basis. It was not surprising to find out
later that J.O Stromberg, another harmonic analyst, had constructed an orthonormal wavelet basis a few years before Meyer did. Meyer and Stromberg however,
were not the pioneers of orthogonal wavelet basis development; it was the German mathematician Alfred Haar who discovered in 1909 the first and simplest
orthonormal wavelet set. Theoretical work on wavelets was discovered and rediscovered independently over the course of the next few decades, with approaches
developed for different applications.
9
In 1986, Mallat and Meyer introduced the idea of the Multi-Resolution
Analysis (MRA) technique, which is based on decomposing the signal into its
dyadic frequency bands using low pass and high pass filters in series. Curiously,
this same idea was developed in 1976 by A. Crosier, D. Esteban and C. Galland
under the name of Quadrature-Mirror Filters (QMF) and sub-band filtering, and
it was widely used in electrical engineering applications years before it was discovered by wavelet researchers.
It was in 1988 when Duabechies developed the orthonormal basis of compactly supported wavelets, which became the foundations of modern wavelet theory. A few years later in 1992, Daubechies, along with Cohen and Feauveau, constructed the compactly supported bi-orthogonal wavelet; and Coifman, Meyer and
Wickerhauser developed the theory on wavelet packets, an extension of the MRA
technique. It is evident that the advancement of communication in modern times
has aided in streamlining the research advancement on wavelet theory, and as a
result, has recently led to an influx of contributions. The chaotic research era of
the 1970s and 1980s led to small breakthroughs in wavelet research, but the recent
research is best summarized in the words of Daubechies.
”The subject area of wavelets, developed mostly over the last 15 years, is
connected to older ideas in many other fields, including pure and applied mathematics, physics, computer science and engineering. The history of wavelets can
therefore be represented as a tree with roots reaching deeply and in many directions” [20].
The objective of this thesis is to provide a new SNR estimation approach
based on the incoming signal waveform shape trend at the receiver, using wavelets
and wavelet transform theory. Additionally, a wavelet-based jamming detection
method is presented. The wavelet-based SNR estimation algorithm in this first
10
stage of development is not intended to adapt to the modulation scheme of the
received signal; however, this could be done with further research on Wave-nets,
which are multi-resolution, hierarchical neural networks that can select the most
suitable wavelet to decompose the incoming signal using the wavelet transform.
11
CHAPTER 2
COMMUNICATIONS SYSTEM MODEL
Introduction
Communication systems are described and analyzed using mathematical
models. The following sections describe conventions that will be used to represent
the signals, subsystems and channels in the evaluation of the SNR estimators.
The system model presented in the following sections is a discrete, coherent, and complex baseband-equivalent. The digital modulations used at the
transmitter are M-ary Phase Shift Keying (MPSK) with M=4 and M=8, and 16Quadrature Amplitude Modulation (16QAM). Perfect carrier and symbol timing
are assumed at the receiver.
The channel is characterized by additive wideband CWGN (Complex White
Gaussian Noise); therefore no pulse-shaping filter is used at the transmitter or
receiver to reduce ISI generated by frequency selective fading. An interpolation
filter is used in the transmitter to generate rate transitions, required in a discretetime simulation environment. The received sequence is processed by the estimators at the same channel sample rate.
Transmitter Model
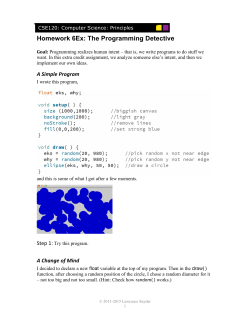
According to Fig.2, the transmitter is comprised by the binary data source,
a digital modulator, an up-sampler, and an interpolation FIR filter. The transmitted sequence mn , regardless of the modulation scheme used, is always a complex
baseband discrete sequence that uses a sampling frequency of Fn = 1/Tn , where
Tn is the symbol time period.
12
FIGURE 2. General baseband system model.
FIGURE 3. Binary source model.
The model created in Simulink for the binary source, uses a Bernoulli generator to generate an independent and random binary sequence with equal probability of obtaining a one or a zero, that is with a probability of p = 0.5. The signal
bn it is a vector of length log2 (M ), where M is the number of symbols used by the
digital modulation (figure 2). Each element in the vector is generated independently by the Bernoulli generator at a rate of Fn . The digital modulator generates
a complex baseband representation using Gray coding.
MPSK Modulation Scheme
The M-ary Phase Shift Keying modulation scheme is a constant envelope
implementation where each symbol is represented by a different phase, and the
number of possible phases is given by the digital modulation level M . As the
13
number of levels M increases, the bandwidth efficiency of the modulation scheme
increases as well. MPSK symbols represent n bits according to equation 2.1. The
complex envelope of an MPSK sequence is mathematically modeled as a complex
number with constant magnitude.
n = log2 M
(2.1)
Equations 2.2 and 2.3 show the polar and rectangular representations for
the complex envelope of MPSK modulated signals, respectively. In the context
of communications systems, the real and imaginary parts of the baseband equivalent are known as quadrature signals; where the real part is usually referred to
as in-phase component and the imaginary part is referred to as quadrature component. The total number of symbols evaluated is indicated as Nsym . The symbol
identification is denoted by the variable i, while n denotes the sample time. The
amplitude An is constant for all symbols.
mn = An ejθin = Imn + jQmn , where n ∈ {0, 1, ...Nsym − 1}
(2.2)
mn = An cos(θin ) + jAn sin(θin ), where i ∈ {1, 2, ..., M }
(2.3)
θ(i,n) =
(2i − 1)π
M
(2.4)
The graphical representation of MPSK-modulated signals is known as
constellation, which is equivalent to the mathematical representation of points in
the complex plane. Each point represents a symbol.
Typically, the bits-signal mapping uses Gray coding, which is based on the
assignment of of n-tuples per symbol with only one-bit difference to two adjacent
signals in the constellation.
14
FIGURE 4. QPSK and 8PSK constellations.
The waveform of each MPSK quadrature component resembles a train of
pulses in the continuous time domain, and it is mathematically described using
displaced rectangular pulses p(t) of width Tn . The in-phase component is denoted
as Imn and the quadrature component is denoted as Qmn . Equations 2.5 and 2.6
are continuous time representations of MPSK quadrature components.
Nsym
Imn (t) = An
X
cos(θin )p(t − nTn )
(2.5)
sin(θin )p(t − nTn )
(2.6)
n=0
Nsym
Qmn (t) = An
X
n=0
For simulation purposes, the sequence mn is up-sampled and interpolated to go through the discrete CWGN channel; which operates at a sample rate
of Fk = Nss Fn . The up-sampling process inserts Nss zeros in between samples
(mu (k)), and then the Sample and Hold (S&H) interpolation FIR filter removes
the Nss − 1 aliases. Sequence mk , is comprised by Nss samples per symbol, where
the samples are repetitions of the original sample per symbol in sequence mn .
15
Nsym−1
X
mu (k) =
mn δk,nNss
(2.7)
n=0
hk =
NX
ss −1
δk,l
(2.8)
l=0
mk = mu ∗ hk =
Nsym−1 Nss −1
X X
n=0
mn δk,(nNss +l)
(2.9)
l=0
The up-sampled, zero-padded sequence mu (k) is expressed in equation 2.7,
where δi,j is the Kronecker delta. The S&H interpolation FIR filter is defined in
equation 2.8, where it is denoted hk . The transmitted discrete sequence mk is expressed according to equation 2.9 in terms of mn , mu and hk ; and it operates at a
sampling frequency of
Nss
Tn
= Fk .
The amplitude levels of MPSK quadrature sequences Imn and Qmn , vary
according to M . For M = 4, each quadrature sequence is bipolar, while for M = 8
they each alternate among four levels, comprised by two bipolar amplitudes.
QAM Modulation Scheme
The QAM (Quadrature Amplitude Modulation) is a multi-level envelope
modulation scheme, which means that the amplitude of the baseband complex
symbols is not constant from symbol to symbol. For the presented transmitter,
the typical 16-QAM is used; which uses four amplitude levels per dimension (per
quadrature signal) accounting for M=16 symbols total.
Sequence mn (figure 2) is defined according to the convention described in
table 1 for 16QAM quadrature sequences Imn and Qmn . Polar expressions such
as An and θin are defined in equations 2.10 and 2.11 in terms of the quadrature
signals.
q
An = Imn 2 + Qmn 2
16
(2.10)
TABLE 1. 16-QAM Mapping
Binary bits
Imn
Qmn
00 01 11 10
−3 −1 3
1
3
1 −1 −3
FIGURE 5. QAM constellation.
−1
θin = tan
Qmn
Imn
(2.11)
The up-sampled discrete sequence mk is modeled according to equation
2.9, since it is provided in terms of mn . Sequence mn is defined for the 16QAM
modulation scheme model according to equations 2.10 and 2.11, and table 1.
Complex AWGN Model
As an introduction to the complex noise model, the principles of complex
˜ =
random variables are introduced. A complex random variable is defined as N
U + jV where U and V are real independent random variables. The first and second moments of a complex random variable are then given in equations 2.12 and
17
2.13 respectively.
˜ ] = E[U ] + jE[V ]
E[N
2
˜ | ] = E[U 2 ] + jE[V 2 ]
E[|N
(2.12)
(2.13)
˜ is still a complex quantity, while the second moThe first moment of N
˜ . The variance of N
˜ is given acment is real and yields the average power of N
cording to 2.14.
˜ ) = E[|N
˜ − E[N
˜ ]|2 ] = E[|N
˜ |2 ] − |E[N
˜ ]|2
var(N
(2.14)
When U and V have Gaussian PDFs, the joint PDF of U and V is given
by 2.15.
#
"
#
−1
1
−1
exp
(u − µu )2 q
exp
(u − µv )2 (2.15)
pU V (u, v) = q
σ2
σ2
2
2
2( 2 )
2( 2 )
2π( σ2 )
2π( σ2 )
1
"
var(U ) = var(V ) =
σ2
2
(2.16)
Figure 6 displays the joint Probability Density Function (PDF) of the
real and imaginary components of a Gaussian complex random variable. The line
projections in the real and imaginary planes show the independent PDFs for each
real random variable U and V respectively, and the shadows in gray display the
two dimensional shape of the Gaussian joint PDF surface.
The joint PDF pU V (u, v) can also be written using complex notation, as
˜.
the PDF of the complex random variable N
1
1
2
pN˜ (˜
n) =
exp − 2 |˜
n−µ
˜|
πσ 2
σ
18
(2.17)
FIGURE 6. Gaussian joint PDF of the real random variables U and V.
˜] = µ
E[N
˜ = µu + jµv
(2.18)
˜ ) = σ2
var(W
(2.19)
The complex noise model must describe a time and discrete waveform.
To do this, the complex random variable concept is enlarged to include time, and
it is described statistically as a discrete random process. The channel model used
in this work is defined according to equation 2.20, and it is known as a complex
white Gaussian noise (CWGN) random process.
n
˜ [n] = u[n] + jv[n] where − ∞ < n < ∞
(2.20)
Sequences u[n] and v[n] are both real white Gaussian noise processes, independent of each other and with a variance of
σ2
,
2
so that the overall average
power of the CWGN is σ 2 . Additionally, CWGN samples have zero mean.
The autocorrelation sequence (ACS) and Power Spectral Density (PSD)
are time and frequency representations of a random process, respectively. Both
these representations can be used to estimate the random process power. The fol19
lowing equations describe theoretically the ACS (equation 2.21) and PSD (equation 2.22) expressions of stationary CWGN processes. Frequency f denotes the
discrete frequency.
Rn˜ [k] =
σ2
k=0
0
k 6= 0
℘n˜ (f ) = σ 2 ∀f where −
1
1
≥f ≥
2
2
(2.21)
(2.22)
Equations 2.21 and 2.22 indicate that CWGN samples are uncorrelated
with a constant power level at all frequencies. These expressions also indicate the
equivalence between the power and variance in a CWGN random process.
20
CHAPTER 3
SNR ESTIMATION AND JAMMING DETECTION
Estimation Theory
Many signal processing applications encounter the parameter estimation
problem. A signal, typically described by a discrete-time waveform or data set,
depends on an unknown parameter θ; which we wish to determine from the data
available. To estimate this unknown parameter, we define an estimator g, which is
modeled as a function of the realization or data set that it is observable.
θˆ = g(x[0], x[1], ..., x[N ])
(3.1)
To determine an estimator, the observable data should be mathematically
modeled. Random data can be statistically described by its probability density
function (PDF) or by statistical properties such as moments (mean, variance, and
covariance), autocorrelation sequences (ACS), and power spectral densities (PSD).
Depending on the prior statistical knowledge of the observable data set and the
parameters we need to estimate, estimators can be classified in two types: classical estimators and Bayesian estimators.
Classical estimators are used when the parameters of interest are deterministic but unknown. The PDF of the observed data set x is parameterized by
the unknown parameter θ, resulting in an expression that represents a family of
PDFs, one per different value of θ. To denote the dependence between the PDF
and the unknown parameter, the PDF function expression uses a semicolon in
21
the list of independent parameters. Equation 3.2 illustrates a classical estimator,
where the data set x is normally distributed and the unknown parameter is the
mean.
−1
2
p(x[i]; θ) = √
exp
(x[i] − θ) , 0 ≤ i ≤ N
2σ 2
2πσ 2
(3.2)
x = [x[0]x[1]...x[N ]]T
(3.3)
1
Equation 3.2 is extended to describe a random process in equations 3.4
and 3.5, where the independent variable is the observable set x.
N
−1
Y
−1
2
√
p(x; θ) =
(x[n] − θ)
exp
2σ 2
2πσ 2
n=0
#
"
N −1
1
−1 X
(x[n] − θ)2
p(x; θ) =
N exp
2σ 2 n=0
(2πσ 2 ) 2
1
(3.4)
(3.5)
Bayesian estimators are used when there is prior knowledge about the parameter to estimate. In this case, the parameter is viewed as a random variable
with a PDF of its own. Using this approach, data can be described using a joint
PDF described as shown in equation 3.6.
p(x, θ) = p(x|θ)p(θ)
(3.6)
The prior PDF p(θ) summarizes the knowledge of the parameter θ before
any data is observed. The conditional PDF p(x|θ) summarizes the knowledge provided by the data set x conditioned on knowing θ.
For the work presented in this thesis, the parameter to estimate is the
SNR. There is no prior PDF defined to describe the SNR, therefore all estimation
based on statistics uses the classical approach.
22
Optimal Estimators
An optimal estimator can be defined as one with a minimum mean square
deviation from the true value. Unfortunately, the mean square error (MSE) optimal criterion leads to non realizable estimators. This can be noted from the MSE
expression for an estimator given in equation 3.7.
ˆ = E[(θ − θ)
ˆ 2 ] = var(θ)
ˆ + b2 (θ), where b(θ) is the estimator’s bias (3.7)
M SE(θ)
Both variance and bias contribute to the MSE. Since the bias is a function
of the unknown parameter and not of the data being observed, any criterion which
depends on the bias will lead to an unrealizable estimator.
Since the optimal minimum MSE estimator is not practical, the minimum
variance unbiased (MVU) estimator is considered instead. This alternative approach constrains the bias to zero and finds the estimator that minimizes the variance.
The MVU estimator will be considered the optimal estimator as a reference, although it does not always exist. Different procedures provide an approach
to search for the MVU estimator: the Cramer-Rao lower bound (CRLB), the
Rao-Blackwell-Lehman-Scheffe (RBLS) theorem and a method that restricts the
estimator to be not only unbiased but linear.
Cramer-Rao Lower Bound (CRLB)
The CRLB places a lower bound on the variance of an unbiased estimator.
The knowledge of this bound serves different purposes: as a reference to determine if the estimator is MVU, to evaluate the performance of an unbiased estimator or to determine the feasibility of designing an unbiased estimator under
certain conditions.
23
The CRLB is accurately obtained when the PDF of the observed data is
known, and it is dependent on the parameter to estimate. When the PDF can be
viewed as a function of the unknown parameter, it is termed the likelihood function.
Consider the SNR estimation of a constant amplitude signal in CWGN at
the receiver.
SN R =
A2
where A is the amplitude, and σ 2 the variance of the CWGN
σ2
(3.8)
The CRLB in this case can be derived considering the estimation parameter θ as a vector according to equation 3.9, and the estimator g(θ) as a function of
such a parameter (equation 3.10).
θ = [A σ 2 ]
g(θ) =
θ12
A2
= 2
θ2
σ
(3.9)
(3.10)
To obtain the CRLB, the Fisher information matrix has to be obtained.
Since the PDF of the observed data is known (equation 3.5), the log-likelihood
function is given by equation 3.11. Using this equation, the Fisher information
matrix can be computed according to equation 3.12.
N −1
N
N
1 X
2
ln(p(x; θ)) = − ln(2π) − ln(σ ) − 2
(x[n] − A)2
2
2
2σ n=0
(3.11)
h 2
i
h 2
i
∂ p(x;θ)
∂ p(x;θ)
−E ∂A∂σ2
−E ∂A2
I(θ) =
i
h 2
i
h 2
∂ p(x;θ)
−E ∂∂σp(x;θ)
−E
2 ∂A
∂σ 2 2
(3.12)
24
Upon taking the negative expectations, the Fisher information matrix becomes equation 3.13.
N
σ2
I(θ) =
0
(3.13)
N
2σ 4
0
The vector parameter CRLB places a bound on the variance of each element. According to a derivation given by Kay in his work, appendix 3B, the
CRLB of each element can be found computing the inverse of the Fisher information matrix [21].
var(θˆi ) ≥ [I −1 (θ)]ii
(3.14)
Although not true in general, for this case the Fisher information matrix
is diagonal and invertible; therefore, it yields to the individual CRLB bounds of
the elements in the parameter vector (equations 3.15 and 3.16).
ˆ ≥
var(A)
σ2
N
(3.15)
2σ 4
2
ˆ
var(σ ) ≥
N
(3.16)
To obtain the CRLB for the 2-dimensional function g(θ) which defines the
SNR, we have to compute the propagation error, given by the covariance matrix
of the SNR (equations 3.18 and 3.19). The Jacobian of g(θ) is computed according to equation 3.17. The SNR covariance matrix is computed using both the Jacobian of g(θ) and the inverse of the Fisher Information Matrix, which describes
the covariance between the elements on the vector parameter θ.
∂g(θ)
=
∂θ
∂g(θ)
∂θ1
∂g(θ)
∂θ2
25
=
∂g(θ)
∂A
∂g(θ)
∂σ 2
(3.17)
T
CSN R =
∂g(θ) −1 ∂g(θ)
I (θ)
=
∂θ
∂θ
CSN R =
2A
σ2
−A2
σ4
σ2
N
0
2A
σ2
0
2
4
2σ
− Aσ4
N
4A2
2A4
4SN R + 2SN R2
+
=
N σ2 N σ4
N
(3.18)
(3.19)
Finally, since the SNR is a scalar the CRLB is given according to equation
3.20.
2
ˆ R) ≥ 4SN R + 2SN R , N: number of observable samples
var(SN
N
(3.20)
SNR Estimation
SNR Estimator Based on Statistics
The SNR Moments Estimator, presented as reference in this work, bases its
operation on the computation of the first and second moments of the received signal. Moments are estimated for the duration of a symbol in general; however, for
MPSK modulations, moments can be estimated over more than one symbol. The
expectation operator is estimated using the sample average (equation 3.21). The
sample average is estimated over a window of samples denoted W . As the size of
the window W increases, the variance of the estimate decreases. The variance of
the sample average estimate was described in equation 3.15.
W
1 X
ˆ
xn
X=
W n=1
(3.21)
The following expressions, describe the moments of the transmitted signal
mk described in Chapter 2.
26
First Moment
E[mk ] = E[mn ] = E[Imn ] + jE[Qmn ]
(3.22)
E[Imn ] = E[Qmn ] = E[an ]
(3.23)
2
E[|mk |2 ] = E[|mn |2 ] = E[Im
] + jE[Q2mn ]
n
(3.24)
2
E[Im
] = E[Q2mn ] = E[a2n ]
n
(3.25)
Second Moment
To obtain a theoretical expression of the moments of sequence mn , we consider the general autocorrelation formula for binary and multilevel digital signals
(equation 3.26), which can be applied to the quadrature sequences Imn and Qmn .
Variable k is used as a time displacement and Pi is the probability of getting the
product (an an+k )i , of which there are I possible values. Symbols are assumed to
be equally likely to occur and independent.
Ran (k) = E[an a(n+k) ] =
I
X
(an an+k )i Pi
(3.26)
i=1
Under the assumption that the data symbols are uncorrelated, we define
Ran in terms of the mean (µan )and variance (σa2n ) of the sequence we defined as an
in equation 3.23.
Ran (k) =
E[a2 ] = σ 2 + µ2
n
an
an
k=0
E[an an+k ] = µ2a
n
k 6= 0
27
(3.27)
The variance and mean associated to each quadrature sequence can be
obtained using equations 3.26 and 3.27. The autocorrelation function per modulation scheme is obtained in equations 3.28 and 3.29.
Ran M P SK (k) =
A2n
2
= σa2n + µ2an
0 = µ2a
n
Ran 16QAM (k) =
k=0
(3.28)
k 6= 0
5 = σ 2 + µ2
an
an
k=0
0 = µ2a
n
k 6= 0
(3.29)
Equations 3.28 and 3.29 demonstrate that asymptotically, the quadrature sequences representing mn have an average power equal to the first moment
squared and a variance equal to zero. For MPSK sequences, the average power
and the symbol’s energy (Es ) are constant due to the constant envelope property
of this modulation scheme.
MPSK
Pavg =
Es
2
= E[|mn |2 ] = E[Im
] + E[Q2mn ] = A2n
n
Tn
(3.30)
For the 16QAM modulated sequence, the average power of the sequence
is asymptotically constant; however, the energy per symbol changes depending on
the specific symbol. To determine the energy per symbol for the QAM case, the
moments estimation occurs only during the symbol interval and, it should be initialized to zero in the transition from symbol to symbol. The energy calculation
per symbol makes the accuracy of the moments estimation dependent to the oversampling rate, which in the context of this work refers to the number of samples
28
FIGURE 7. Moments Estimator used as reference (estimator 1).
per symbol Nss . The larger the value of Nss , the more accurate the sample average used to estimate the expectation.
16QAM
Pavg = E[|mn |2 ] = 5
(3.31)
Es
2
= E[|Im
|]
+ E[|Q2mn |]symbol
n symbol
Tn
(3.32)
After providing the statistical properties of both the sequence of interest
(mk ) and the statistical model of the CWGN channel, a theoretical SNR expression can be provided 3.33.
SN R =
E[|rk |2 ]
var[rk ]
(3.33)
The variance of sequence rk represents the noise power, and it can be calculated by subtracting the first moment squared from the second moment.
The RST signals in figure 7 represent the reset required when the estimation is being performed per symbol. The sample average operators work on a win-
29
dow of samples defined as W . When the estimation is being performed per symbol, W can be set to anything less or equal to the number of samples per symbol.
SNR Estimator Based on the Separation of Signal and Noise
In this work, we use a method based on wavelet analysis that isolates the
noise portion of the received complex sequence.
The first Wavelet-Based Estimator seeks to extract the amplitude trend,
based on the principle that noise changes at a higher rate. It uses a hard-threshold
to denoise the signal.
The second Wavelet-Based Estimator operates on the quadrature components of the complex envelope, and performs the signal extraction based on the
similarity between the mother wavelet and the signal under analysis. For this
case, soft-adaptive thresholding is used to denoise the signal; the method uses
as an adaptive parameter the variance of the high resolution components in the
wavelet domain.
Wavelets and filter banks. Wavelets are signals with irregular, zero-mean,
and short-duration waveforms. Wavelet analysis is based on the decomposition
of a signal into shifted and scaled versions of a ”mother” wavelet (ψ), providing a time-scale view of a signal. Scaling in this context refers to stretching or
compressing the wavelet in time; the smaller the scale, the more compressed the
wavelet. Similarly, shifting refers to delaying or hastening the wavelet’s onset.
The wavelet transform is defined as the summation over time of the signal
multiplied by scaled, shifted versions of ψ. The process produces coefficients that
are a function of the wavelet scale and position; these coefficients indicate how
correlated the wavelet is to the section of the signal under analysis.
The wavelet coefficients are classified according to the wavelet scale as high
or low resolution coefficients. High resolution coefficients provide information re30
FIGURE 8. Discrete Wavelet Transform using filter banks.
garding the rapid-changing details of the signal of interest, and therefore are obtained using high scales that compress the wavelet in time. Low resolution coefficients represent coarse signal features, and are obtained using low scales that
stretch wavelets in time.
The Discrete Wavelet Transform (DWT) uses dyadic scales and positions
(based on powers of two), and it is efficiently implemented using filter banks. Filter banks are comprised by Low-Pass Filters (LPF) and High Pass Filters (HPF)
in parallel. These banks decompose the analyzed signal into approximations (cA)
and details (cD). The approximations are the low-scale, low frequency components
of the signal; while the details are the high-scale, high frequency components. Filter banks are also used for signal reconstruction. The filters in the decomposition
and reconstruction stages are quadrature mirror filters with coefficients set according to the mother wavelet selected. The wavelet function ψ is determined by the
high pass filter in the wavelet decomposition process. The signal associated to the
low pass filter is known as scaling function φ.
31
FIGURE 9. Wavelet analysis block for Wavelet-Based Estimator 1.
FIGURE 10. Wavelet-Based Estimator 1.
Wavelet-Based Estimator 1: trend detector. This estimator uses wavelet
analysis to detect the overall trend of a received signal’s amplitude, which is corrupted by CWGN. The trend is the slowest part of the signal, which in wavelet
analysis corresponds to the lowest scale value. To obtain a low scale, we need to
increase the number of levels in the wavelet transform implementation. The number of levels selected is 5. The wavelet and scaling functions selected belong to the
Daubechies family, type db1 (one vanishing moment); due to the constant waveform that the scaling function has for this selection.
Wavelet-Based Estimator 2: self-similarity detector. Wavelet coefficients
are correlation indexes of the signal under analysis and the wavelet. If the value
32
FIGURE 11. Wavelet analysis block for Wavelet-Based Estimator 2.
of a coefficient is large, it indicates that the resemblance between the signal and
wavelet is strong. In this case, we take advantage of a NRZ bipolar waveform on
quadrature signals for both MPSK and QAM modulated signals. We select the
Daubechies family wavelet with only one vanishing moment (db1) (also known as
Haar wavelet). The Haar wavelet is a square transition from one discrete level to
another.
This estimator performs the wavelet transformation using only one level,
and it denoises the signal using an adaptive soft thresholding method based on
the variance of the detail components. When the variance increases abruptly, detail coefficients are considered part of the signal of interest instead of the noise,
giving a good approximation of signal and noise power.
33
FIGURE 12. Wavelet-Based Estimator 2.
34
Jamming Detection
Wavelet-Based Jamming Detector
A pulse noise jammer transmits pulses of bandlimited white Gaussian noise.
When signals use constant envelope modulation schemes, pulse jamming is detected by identifying the abrupt envelope transitions in the overall power envelope.
Wavelet analysis is first used to extract the trend of the received signal’s
power envelope. If typical averaging stages are used for this purpose, the power
envelope trend obtained would have smooth transitions when jamming occurs. We
need power transitions to remain sharp after the trend extraction; so that we can
use another type of wavelet analysis to detect discontinuities.
For the power envelope trend extraction, the wavelet analysis block uses
Daubechies wavelet db1 for the decomposition into wavelet coefficients and wavelet
db2 (vanishing moment=2) for the reconstruction. Five levels of analysis are used,
as the purpose is to obtain the slow-changing component of the signal. Hard thresholding is used to denoise the power trend.
Once the power envelope trend has been extracted, we use wavelet analysis
to detect the instants of time in which the signal has discontinuities. Since we are
only interested in detecting the discontinuity, we can use a wavelet analysis block
based on Daubechies wavelet db1 (Haar wavelet). Wavelet reconstruction is only
performed for high resolution coefficients (details). The reconstructed signal goes
through a threshold device which determines what power envelope transitions are
considered jamming.
35
FIGURE 13. Wavelet-Based Jamming Detector.
36
CHAPTER 4
PERFORMANCE EVALUATION
The performance of SNR estimators is evaluated through the measurement
of statistical properties of the SNR estimates; this includes the sample mean, sample variance and statistical mean-squared error (MSE). The use of measurements
rather than closed-form expressions of each statistical property is considered accurate due to the ergodicity of all processes underlying in the SNR estimation.
The statistical measurements are performed over the estimator’s steady
state. The estimates obtained during the transient state are ignored.
The bias of an estimate is an error measurement defined as the difference
between the estimate mean and the real value of the parameter being estimated
(equation 4.1). The ideal SNR estimator is unbiased and has the minimum variance. The statistical MSE reflects both the variance and the bias of the estimate;
therefore, this single parameter can be used to characterize the overall performance of the estimator.
ˆ R} = SN
ˆ R − SN R
Bias{SN
ˆ R} =
V ar{SN
Nsym
1
X
Nsym − 1
ˆ R − SN R)2
(SN
(4.2)
i=1
ˆ R} = E[(SN
ˆ R − SN R)2 ]
M SE{SN
ˆ R} =
M SE{SN
(4.1)
(4.3)
Nsym
1
X
Nsym
37
i=1
ˆ R − SN R)2
(SN
(4.4)
ˆ R} = V ar{SN
ˆ R} + Bias{SN
ˆ R}2
M SE{SN
(4.5)
In order to evaluate the performance of each estimator, an optimal MVU
(Minimum Variance Unbiased) estimator is used as reference. The MVU estimator is assumed to have zero bias and a variance given by the Cramer Rao Lower
Bound (CRLB). For an SNR estimator, the CRLB is given according to equation
4.6.
2
4SN Rlinear + 2SN Rlinear
CRLBlinear : var(SN Rˆlinear ) ≥
Nsym
(4.6)
The expression given in equation 4.6 uses a linear SNR estimate. All SNR estimators presented in this work provide an the estimate in logarithmic scale (dB). The
equivalent expression for the CRLB in logarithmic scale is obtained computing a
coefficient of variation (CV), which is shown in equations 4.7, 4.8, 4.9, and 4.10.
σlinear :
p
CRLBlinear
(4.7)
σlinear
SN Rlinear
(4.8)
CV =
σdB = 10log10 (CV + 1)
(4.9)
CRLBdB = CRLB = (σdB )2
(4.10)
For better interpretation of the results, all performance parameters are
expressed normalized to the SNR.
ˆ
ˆ R} = M SE{SN R}
N M SE{SN
SN R2
(4.11)
ˆ R}
Bias{SN
SN R
(4.12)
ˆ R} =
N BIAS{SN
38
ˆ R} =
N V AR{SN
ˆ R}
V ar{SN
SN R2
ˆ
ˆ R} = CRLB{SN R}
N CRLB{SN
SN R2
39
(4.13)
(4.14)
CHAPTER 5
SIMULATION AND RESULTS
Introduction
The evaluation of the SNR estimators and the jamming detector is based
on simulations performed using MATLAB. The system model is implemented using Simulink which is a block diagram environment within MATLAB that is oriented towards model-based design. Simulink toolboxes provide operational blocks
for applications in communications and signal processing that simplify the development, simulation and design of new systems. These blocks also provide different
levels of configuration and can can be customized to have the physical constraints
of real digital systems.
The wavelet processing applications are implemented using the toolbox
Simuwave.
The performance of the estimators is given in terms of normalized Mean
Square Error (NMSE), variance (NVAR) and bias (NBIAS). These performance
parameters are theoretically calculated using expectation. Simulink implementations of the estimators estimate these performance parameters using the running
mean and running variance blocks. The estimators are configured to provide an
estimate over the entire simulation time. The simulation time for all results presented in this chapter is equivalent to the transmission of 512 symbols; however,
to compute the estimates of performance parameters, the SNR estimates obtained
40
during the transient state of the estimator were excluded in order to show in the
results the statistics of a steady-state operation.
Transmitter and Channel Models
The transmitter is implemented using three blocks in Simulink: the Bernoulli
binary generator, the bit to integer converter and the MPSK or QAM baseband
modulator. The settings of the Bernoulli binary generator allow the user to specify the probability of a zero, the number of elements in the output (which can
be configured to be a vector), and the initial seed used for random generation.
The number of elements on the output vector varies according to the modulation
scheme selected, and it is set to be the base-two logarithm of the number of symbols available per scheme. The bit to integer converter is used as an intermediate
block which simplifies the baseband modulator block operation.
The MPSK baseband modulator is configured to have a phase offset of
π
M
and a Gray constellation ordering. The amplitude of the complex baseband signal
is set to have a magnitude of one for all simulations performed and the modulator
is set to use a sampling frequency of one second, which is also the symbol rate
(Tn ).
The QAM rectangular baseband modulator block is configured with a phase
offset of zero radians and uses a normalization method based on the minimum
distance between symbols; this is set to two, according to table 1.
The channel is modeled using the AWGN channel block. This block adds
white Gaussian noise to the input. For complex inputs, the block adds CWGN
and generates a complex output. This block is configured by specifying the output
SNR and the input signal power (referenced to 1 Ohm). According to these quantities, the block calculates the variance of the noise being added to the real and
imaginary components.
41
FIGURE 14. MPSK transmitter in Simulink.
42
FIGURE 15. Transmitter and channel models in Simulink
The CWGN channel block operates at a sampling frequency higher than
the transmission symbol rate (Tn = 1) in order to have more than one noise sample per symbol. The sampling frequency at which the channel and the receiver
operate is referred to as Fk = Nss Fn in Chapter 2. In related literature, the sampling frequency is usually denoted as Fs ; therefore, in this chapter, Fs is used as
an equivalent of Fk , which indicates the samples per symbol.
The rate transition block connecting the transmitter with the channel in
figure 15 is typically used in Simulink to interface a slow and a fast subsystem.
Since this block is used for simulation purposes only, it does not execute in real
time, and it effectively acts as a delay equal to one slow update period. The latency introduced ensures deterministic transfer timing.
Moments Estimator
The Moments Estimator was evaluated using three implementation schemes.
The performance of each scheme was evaluated in terms of obtained NMSE; which
is plotted using different sampling frequencies (Fs ), SNR Values, and sample average window sizes (W ).
The differences among the implementations presented evaluate the effect of
two main processes: the SNR calculation and the sample average estimation.
43
TABLE 2. Implementations of the Moments Estimator.
Implementation SNR Calculation
1
SdBm − NdBm
2
S/N
3
SdBm − NdBm
Sample Average
Running
Running
F ixed (P erSymbol)
There are two ways of estimating the SNR. The first method converts the
signal and noise power estimates to logarithmic scale units (dBm) and then subtracts them to obtain the SNR estimate in dB. The second method divides the
signal and noise power estimates using linear scale units and then converts the result to a logarithmic scale to generate the SNR estimate in dB.
The sample average estimation can be performed using running or fixed average implementations. The running average implementation, also known as moving average, performs an ongoing calculation of the statistical mean over a window of running samples in such a way that data progressively changes as it goes
through the window. The fixed average implementation performs the mean calculation using the number of samples per symbol, giving an estimate per symbol
that is independent from symbol to symbol.
Implementations 1 and 2 use running averages to calculate the first and
second moments. The difference between the two is that the former calculates the
SNR by subtraction of the signal and noise power in dBm, while the latter divides
the signal and noise power estimates and converts the result to dB. Implementation 3 calculates the SNR in the same way implementation 1 does, but it uses
fixed sample averages per symbol to estimate the moments.
44
Evaluation of Constant Envelope Modulation Schemes: MPSK
For constant envelope modulation schemes, it is possible to average samples using a running average over window sizes that are larger than the number of
samples per symbol. This allows the possibility of evaluating the three implementations presented in table 2.
The first implementation of the Moments Estimator is shown in appendix
A, figure 57. It uses the Simulink block Mean to compute the running averages
over a window of size W , where W is configurable. The estimator uses this block
to estimate the moments on the amplitude of the received signal. It also converts the signal and noise power estimates to logarithmic units of dBm using the
block dB Conversion. This block handles the exception of the logarithm of zero by
adding eps to the input. The SNR is then computed by subtracting the signal and
noise estimates in logarithmic units of dBm.
The performance parameters of the estimator are calculated over the total number of symbols transmitted (Nsym ), excluding those that are part of the
transient state. To make sure that the transient state is dismissed, the running
average and running variance blocks at the output are set to zero by a reset signal generated by the block Transient Counter. This same reset signal controls the
output switch, so that no estimates are available at the output until the steady
state of the estimator is reached.
The second implementation computes the SNR by dividing the signal and
noise estimates in linear scale and then converting the SNR estimate to dB. This
approach requires an initial value setting for the noise estimate in order to prevent the division by zero. The second implementation of the Moments Estimator
is shown in appendix A, figure 58.
45
The third implementation, evaluates the effect of replacing the Mean blocks
that compute the running average over a window of samples with an Integrator
& Dump filter that estimates the average over a fixed number of samples; in this
case, the fixed number is equivalent to the number of samples per symbol. The
signal and noise estimates are converted to dBm to compute the SNR, just as it
was presented in implementation 1.
The transfer function of the Integrator & Dump filter block is given in
equation 5.1). This filter operates with an input reset port. The reset signal is
generated every time a new symbol starts, dismissing information stored in the
filter’s memory from the previous symbol.
HID (z) =
Ts z
z−1
(5.1)
The third implementation of the Moments Estimator is shown in appendix
A, figure 59.
The three implementations of the Moments Estimator were first evaluated
varying the sampling frequency Fs . We observe the effect of selecting different
sampling rates with different SNRs and window sizes (W ) for the running sample averages. For the case of implementation 3, the window size of the Integrator
& Dump filter is always equal to the number of samples per symbol. For the other
two implementations, the size of the window is independent from the number of
samples per symbol.
From figure 16, we observe that implementation 3 is independent of the
window size since it does not use running sample average blocks but rather the
I&D filter. Implementation 3 integrates the number of samples per symbol to estimate the first and second moment, therefore, as the sampling frequency increases,
46
more samples are used to calculate an estimate. Consequently, the estimator performs better having a lower NMSE.
If we compare the NMSE measured for implementation 1 and 2, we can
conclude that the former performs better, but the difference in performance becomes negligible as the window size of the sample average block increases. Also,
both implementations 1 and 2 of the Moments Estimator are approximately invariant, in terms of NMSE, to sampling frequency variations.
According to figure 16, the best implementation for the Moments Estimator with constant envelope modulated signals at the input is implementation 1.
Additionally, the performance of the Moments Estimator increases as the window
size increases; which is observed as a decrease in the NMSE.
Figure 17 displays a graph of NMSE vs SNR using implementation 1 with
different sample average window sizes (W ) and with a sampling frequency of Fs =
64. This figure shows the effect of the window size in the performance of the Moments Estimator. Figure 18 displays the normalized bias and the variance of the
Moments Estimator under the same conditions.
Figure 17 shows the overall performance of the estimator in terms of the
NMSE; however, figure 18 shows the contributions of bias and variance to the
NMSE. It can be observed from figure 18 that increasing the window size (W )
does not mitigate the NBIAS magnitude in the low SNR cases; however, it does
reduce the NVAR for all SNR cases.
The Moments Estimator was also evaluated using 8PSK modulated signals.
Figures 19 and 20 show the difference in performance between using QPSK and
8PSK modulated signals at the input of the same estimator (implementation 1).
Figure 19 shows the negligible difference in performance between the Moments
47
(b) W=16
(a) W=4
101
101
SNR=4
SNR=4
SNR=10
SNR=10
SNR=28
SNR=28
100
10−1
10−1
NMSE
NMSE
100
10−2
10−2
10−3
10−3
10−4
2
6
10−4
10 14 18 22 26 30 34 38 42 46 50 54 58 62
2
6
10 14 18 22 26 30 34 38 42 46 50 54 58 62
Fs (Samples per Symbol)
Fs (Samples per Symbol)
(c) W=32
(d) W=64
101
101
SNR=4
SNR=4
SNR=10
SNR=10
SNR=28
SNR=28
100
10−1
10−1
NMSE
NMSE
100
10−2
10−2
10−3
10−3
10−4
2
6
10 14 18 22 26 30 34 38 42 46 50 54 58 62
Fs (Samples per Symbol)
10−4
2
6
10 14 18 22 26 30 34 38 42 46 50 54 58 62
Fs (Samples per Symbol)
FIGURE 16. Sampling frequency response of the Moments Estimator - QPSK.
Evaluated with QSPK signals at different SNRs. For implementations 1 and 2,
different window sizes (W ) are also evaluated.
Implementation 1: solid line, implementation 2: dashed line, implementation 3:
light dotted line.
48
102
W=4
W=16
W=32
101
W=64
NMSE
100
10−1
10−2
10−3
10−4
2
4
6
8
10
12
14
16
18
20
22
24
26
28
30
SNR (dB)
FIGURE 17. Moments Estimator performance (NMSE) - QPSK. Implementation
1 with QPSK modulated signals for different SNRs and sample average window
sizes (W ), Fs = 64.
101
101
W=4
W=4
W=16
W=16
W=32
W=32
100
W=64
W=64
100
NVAR
NBIAS
10−1
10−1
10−2
10−2
10−3
10−3
2
4
6
8
10 12 14 16 18 20 22 24 26 28 30
SNR (dB)
10−4
2
4
6
8
10 12 14 16 18 20 22 24 26 28 30
SNR (dB)
FIGURE 18. Moments Estimator performance (NBIAS, NVAR) - QPSK.
Implementation 1 with QPSK modulated signals for different SNRs and sample
average window sizes (W ), Fs = 64.
49
101
QPSK
8PSK
100
NMSE
10−1
10−2
10−3
10−4
2
4
6
8
10
12
14
16
18
20
22
24
26
28
30
SNR (dB)
FIGURE 19. Moments Estimator performance (NMSE) - QPSK, 8PSK.
Implementation 1 evaluated with QPSK and 8PSK modulated signals at the
input, with Fs =64 and W=64.
Estimator using QPSK and 8PSK. Figure 20 indicates that QPSK produces a
slightly lower bias for high SNRs.
50
101
100
QPSK
QPSK
8PSK
8PSK
10−1
NVAR
NBIAS
100
10−1
10−2
10−3
10−2
10−3
5
10
15
20
25
30
SNR (dB)
10−4
5
10
15
20
25
SNR (dB)
FIGURE 20. Moments Estimator performance (NBIAS, NVAR) - QPSK, 8PSK.
Implementation 1 evaluated with QPSK and 8PSK modulated signals at the
input, with Fs =64 and W=64.
51
30
Evaluation of Multi-level Envelope Modulation Schemes: QAM
To estimate the SNR of QAM modulated signals, the Moments Estimator must be implemented according to configuration 3, which was previously described in the subsection evaluating constant envelope modulation schemes. Implementation 3 estimates the received signal moments per symbol, and does not
use running averages. The estimates are done by integrating the number of samples in a symbol, and initializing the output between symbols to zero (implementation 3 uses the I&D Filter).
Implementation 3 can be used for Moments Estimators receiving both
MPSK and QAM modulated signals; however, performance parameters such as
MSE, bias, and variance, are calculated differently from one modulating scheme
to the other. Figure 60 in appendix A, shows the Moments Estimator using implementation 3 including the blocks that calculate performance parameters. For
multi-level modulation schemes, the SNR estimate varies from symbol to symbol,
therefore, the SNR used as reference to compute the performance parameters has
to change accordingly. To generate a reference SNR, we use the transmitted signal
without channel interference (without CWGN) and calculate its power. The reference SNR is then calculated based on the power of the transmitted signal without
interference and the constant noise level used for the simulation. For the performance parameters to be calculated at the output of the estimator, the reference
SNR signal must be delayed to account for the Moments Estimator’s delay.
Figures 21 and 22 show the NMSE, NBIAS, and NVAR of the Moments
Estimator using implementation 3 with a 16QAM modulated signal at the input,
for different sampling frequencies.
From figures 21 and 22, we can conclude that the Moments Estimator performs best as the sampling frequency increases. This occurs for implementation 3
52
102
Fs=4
Fs=16
Fs=32
101
Fs=64
NMSE
100
10−1
10−2
10−3
10−4
2
4
6
8
10
12
14
16
18
20
22
24
26
28
30
AVG SNR (dB)
FIGURE 21. Moments Estimator performance (NMSE) - 16QAM.
Implementation 3 evaluated with a 16QAM modulated signal at the input, with
different sampling frequencies (Fs ).
101
101
Fs=4
Fs=4
Fs=16
Fs=16
Fs=32
Fs=32
100
Fs=64
Fs=64
100
NVAR
NBIAS
10−1
10−1
10−2
10−2
10−3
10−3
5
10
15
20
25
30
AVG SNR(dB)
10−4
5
10
15
20
25
AVG SNR (dB)
FIGURE 22. Moments Estimator performance (NBIAS, NVAR) - 16QAM.
Implementation 3 evaluated with a 16QAM modulated signal at the input, with
different sampling frequencies (Fs ).
53
30
101
QPSK
8PSK
16QAM
100
NMSE
10−1
10−2
10−3
10−4
2
4
6
8
10
12
14
16
18
20
22
24
26
28
30
SNR (dB)
FIGURE 23. Moments Estimator performance (NMSE vs SNR(dB)).
Implementation 3 evaluated with QPSK, 8PSK and QAM modulated signals at
the input, with Fs = 64 and W = 64.
because the number of samples per symbol being averaged increases as the sampling frequency increases; therefore, for this implementation, increasing the sampling frequency has the equivalent effect of increasing the averaging window (W )
in implementations 1 and 2 used for MPSK signals. Additionally, figure 22 shows
that the NBIAS and NVAR are significantly higher for the case that uses a sampling frequency F s = 4, compared to the others evaluated.
For multi-level power envelopes like QAM, there is a different SNR per
symbol. All QAM performance curves use the symbol’s average SNR.
Performance Comparison Based on Modulation Scheme
Implementation 3 is the only one that allows us to compare the performance of the constant and multi-level modulation schemes under the same conditions. Figures 23 and 24 show the performance of the Moments Estimator using
implementation 3; evaluated with signals modulated in QPSK, 8PSK and QAM,
at a sampling frequency of F s = 64.
54
101
101
QPSK
QPSK
8PSK
8PSK
16QAM
QAM
100
100
NVAR
NBIAS
10−1
10−1
10−2
10−2
10−3
10−3
5
10
15
20
25
30
SNR (dB)
10−4
5
10
15
20
25
SNR (dB)
FIGURE 24. Moments Estimator performance (NVAR and NBIAS).
Implementation 3 evaluated with QPSK, 8PSK and QAM modulated signals at
the input, with Fs = 64 and W = 64.
Figure 23 shows that the NMSE for MPSK modulated signals is lower than
the NMSE for QAM modulated signals using the same implementation of the
Moments Estimator (implementation 3). The performance differences between
constant and multi-level modulation schemes are caused by the SNR evaluation
in both scenarios. For QAM modulated signals, the NMSE has to be graphed
against the average symbol SNR; while for MPSK, the SNR between symbols does
not change. The difference in performance, however, is only observable for low
SNRs.
For constant envelope modulations, implementations 1 and 2 perform better than implementation 3; therefore, figures 25 and 26 compare the performance
of the Moments SNR Estimator using implementation 1 for MPSK modulated signals (constant envelope) and implementation 3 for the 16QAM modulated signal
(multi-level envelope). The scenario displayed by figures 25 and 26 describes the
55
30
101
QPSK (Implementation 1)
8PSK (Implementation 1)
16QAM (Implementation 3)
100
NMSE
10−1
10−2
10−3
10−4
2
4
6
8
10
12
14
16
18
20
22
24
26
28
30
SNR (dB)
FIGURE 25. Moments Estimator performance (NMSE) - MPSK, 16QAM.
Implementation 1 for MPSK modulated signals at the input and implementation 3
for 16QAM modulated signals, with Fs = 64 and W = 64.
101
101
QPSK (Implementation 1)
QPSK (Implementation 1)
8PSK (Implementation 1)
8PSK (Implementation 1)
16QAM (Implementation 3)
QAM (Implementation 3)
10
0
100
NVAR
NBIAS
10−1
10−1
10−2
10−3
10−2
5
10
15
20
25
30
SNR (dB)
10−4
5
10
15
20
SNR (dB)
FIGURE 26. Moments Estimator performance (NBIAS, NVAR) - MPSK,
16QAM. Implementation 1 for MPSK modulated signals at the input and
implementation 3 for QAM modulated signals, with Fs = 64 and W = 64.
56
25
30
real operation conditions, where only QAM modulated signals would use implementation 3 of the Moments Estimator.
The difference between implementations 1 and 2 is the way in which the
SNR is computed. From the results obtained in figure 16, we can conclude that
implementation 1 performs better than 2; therefore, for the evaluation of other estimators in the following sections, we will only consider implementation 1 for constant envelope modulations and implementation 3 for multi-level envelope modulations.
Wavelet-Based SNR Estimator 1: Trend Detector
Wavelet-Based Estimator 1 operates on the amplitude of the received signal; separating the noise from the amplitude by converting the incoming signal
into the wavelet domain. This results in classifying the detail components as noise,
and the approximation components as the signal of interest. Each component is
converted back from the wavelet domain separately, and the average power for
each is computed to estimate the SNR. The average power of the amplitude and
noise is converted to logarithmic units (dBm) so that the SNR can be easily computed by subtracting the quantities. Wavelet-Based SNR Estimator 1 is mainly
comprised by two sections. The first one separates the incoming signal into the
amplitude and noise components. The second section estimates the power of these
two components.
The signal separation into amplitude and noise components is performed
by the block named Wavelet Filters, which operates in the same way for constant
and multi-level modulation schemes. Power estimation, however, is computed differently depending on whether the incoming signal is constant or multi-level envelope. If the received signal is constant envelope, the average block can compute
running averages with window sizes that could be larger than the number of sam57
ples per symbol. On the other hand, if the incoming modulation is multi-level, it
performs the averaging per symbol using a fixed-size window integrator. In the
section dedicated to the Moments Estimator, these two power estimation implementations were identified by implementation 1 and implementation 3, respectively.
The Simulink block diagrams for both implementations of Wavelet-Based
SNR Estimator 1 are shown in appendix B. Figure 64 shows the running average implementation for constant envelope modulation schemes (implementation
1), and figure 62 shows the fixed-average implementation for multi-level envelope
modulation schemes (implementation 3). Note that the only difference between
these implementations is the way in which the averaging blocks operate.
The discrete wavelet conversion block in Simulink, identified as Wavelet
Filters, operates according to figure 8 (Chapter 3). The number of levels selected
determines the sampling frequency required because the DWT implementation is
comprised by filter stages with down-sample blocks in between each stage. The
minimum sampling frequency is, therefore, defined by a power of two, with a lower
bound given by 2levels . As it is explained in Chapter 3, for trend extraction, the
use of several levels produces a smoother approximation. After all, the approximation component is the result of low-pass filtering the signal at different time
scales; however, as we increase the number of levels, the hardware and operational
requirements increase: higher sampling frequencies and more filter stages are required.
Figures 27, 28, and 29 show the effect in the performance parameters when
different wavelet-levels are used to operate Wavelet-Based Estimator 1. The sampling frequency selected is the minimum required by the higher scale, which in
this case is Fs = 32. The performance parameters are plotted for constant (8PSK,
58
102
DWT Level=1 (QAM)
DWT Level=3 (QAM)
DWT Level=5 (QAM)
10
DWT Level=1 (QPSK)
1
DWT Level=3 (QPSK)
DWT Level=5 (QPSK)
DWT Level=1 8PSK)
DWT Level=3 (8PSK)
100
DWT Level=5 (8PSK)
NMSE
REF MSE=1dB
10−1
10−2
10−3
2
4
6
8
10
12
14
16
18
20
22
24
26
28
30
SNR(dB)
FIGURE 27. Wavelet-Based Estimator 1 (NMSE). Evaluated for different levels in
the DWT, with QPSK, 8PSK and 16QAM modulated signals at the input, with
Fs = 32 and W = 32.
QPSK) and multi-level (16QAM) envelope modulated signals at the input, and
evaluated for different SNR levels. For the case of QAM signals, the SNR displayed corresponds to the average SNR per symbol. Figure 27 shows that, for all
modulations evaluated, the performance in terms of NMSE improves as the number of wavelet levels increase. The improvement, however, is not linear; it is more
significant in the transition from DW T Level = 1 to DW T Level = 3 than it is in
the transition from DW T Level = 3 to DW T Level = 5. Also, it shows that constant envelope modulations provide better SNR estimates in terms of NMSE than
multi-level modulations.
Figure 27 allows us to graphically compare the overall performance in terms
of NMSE. Table 3 records values from the graph (with DW T Level = 5) to provide a quantitative comparison. Since the differences in NMSE between QPSK
59
TABLE 3. Wavelet-Based Estimator 1 Performance Comparison.
SNR
4
16
28
MPSK NMSE
0.7038
0.00422
0.001242
MPSK MSE (dB) 16QAM NMSE
11.2608
1.099
1.0803
0.01064
0.9737
0.06269
16QAM MSE (dB)
17.5840
2.7288
49.1484
and 8PSK are negligible, they are classified as a single modulation (MPSK) in the
table.
Figure 27 shows a reference line named REF MSE = 1dB, which serves
as a graphical guide and displays a constant 1 dB MSE curve normalized to the
SNR. Considering this reference curve and the data recorded in table 3, we can
conclude that, for MPSK modulations, Wavelet-Based Estimator 1 has a low, constant MSE of approximately 1 dB for SNRs greater than 15 dB. For low SNRs,
however, the error increases above 11 dB. For the 16QAM case, the MSE increases
at both low and high ends of the SNR range under evaluation, getting worse for
the high SNR end where the MSE reaches 49 dB.
To understand how the bias and variance contribute to the overall MSE,
figures 28 and 29 show the NBIAS and NVAR of Wavelet-Based SNR Estimator
1, obtained for QPSK, 8PSK, and 16QAM modulated signals at the input. From
figures 28 and 29, we can observe that Wavelet-Based SNR Estimator 1 has the
lowest bias and the highest variance when it operates on 16QAM modulated signals. Conversely, when it operates on 8PSK and QPSK modulated signals, it has
the lowest variance and highest bias. The differences between 8PSK and QPSK
are only visible when the DW T Level is equal to one; these differences become
negligible for practical purposes.
60
101
DWT Level=1 (QAM)
DWT Level=3 (QAM)
10
DWT Level=5 (QAM)
0
REF BIAS=1dB
NBIAS
10−1
10−2
10−3
10−4
2
4
6
8
10
12
14
16
18
20
22
24
26
28
30
SNR (dB)
101
DWT Level=1 (QPSK)
DWT Level=3 (QPSK)
DWT Level=5 (QPSK)
REF BIAS=1dB
NBIAS
100
10−1
10−2
2
4
6
8
10
12
14
16
18
20
22
24
26
28
30
SNR (dB)
101
DWT Level=1 (8PSK)
DWT Level=3 (8PSK)
DWT Level=5 (8PSK)
REF BIAS=1dB
NBIAS
100
10−1
10−2
2
4
6
8
10
12
14
16
18
20
22
24
26
28
30
SNR (dB)
FIGURE 28. Wavelet-Based Estimator 1 (NBIAS). Evaluated using different
levels in the DWT, with QPSK, 8PSK and 16QAM modulated signals at the
input, with Fs = 32 and W = 32.
61
102
DWT Level=1 (QAM)
DWT Level=3 (QAM)
101
DWT Level=5 (QAM)
REF VAR=1dB
NVAR
100
10−1
10−2
10−3
10−4
2
4
6
8
10
12
14
16
18
20
22
24
26
28
30
SNR (dB)
100
DWT Level=1 (QPSK)
DWT Level=3 (QPSK)
DWT Level=5 (QPSK)
NVAR
10
REF VAR=1dB
−1
10−2
10−3
10−4
2
4
6
8
10
12
14
16
18
20
22
24
26
28
30
SNR (dB)
100
DWT Level=1 (8PSK)
DWT Level=3 (8PSK)
DWT Level=5 (8PSK)
NVAR
10
REF VAR=1dB
−1
10−2
10−3
10−4
2
4
6
8
10
12
14
16
18
20
22
24
26
28
30
SNR (dB)
FIGURE 29. Wavelet-Based Estimator 1 (NVAR). Evaluated using different levels
in the DWT, with QPSK, 8PSK and 16QAM modulated signals at the input, with
Fs = 32 and W = 32.
62
The differences in performance obtained between processing QAM and
MPSK signals are determined by the characteristics of the wavelet filters used to
implement the denoising algorithm. MPSK signals have a constant amplitude,
while QAM signals have multi-level. The wavelet filter is sensitive to the amplitude transitions in the QAM signal from symbol to symbol. These transitions
are part of the ideal trend of the QAM signal’s amplitude, and therefore, should
be classified as such by the denoising algorithm. The wavelet filter, however, interprets the transitions in the wavelet domain as detail components due to their
high frequency nature. Details in the wavelet domain are identified by the system as noise; this results in the denoising algorithm mistakenly identifying some
amplitude components as noise. This causes the variance of the SNR estimate to
increase for the QAM case, as shown in figure 29. On the other hand, the performance in terms of bias is significantly better when QAM signals are processed
compared to MPSK.
Figure 30 shows the wavelet domain coefficients for a QAM signal (details
and approximation) evaluated with a high SNR (average SNR=30 dB). The amplitude of the details have abrupt peaks at the same time that transitions in the
approximation component (trend) occur. These peaks do not affect the amplitude
approximation significantly, but they do affect the noise approximation by increasing the variance; this explains why Wavelet-Based Estimator 1 has poor performance when processing QAM signals with a high SNR. Figures 31 and 32 show
the noise and amplitude approximations generated by the wavelet filters used in
Wavelet-Based SNR Estimator 1 under different SNRs. To evaluate the accuracy
of the estimates, the transmitted signal and channel noise are plotted as well.
Figures 31 and 32 show the respective amplitude and noise estimates for different
SNRs. From these figures, we can justify again why Wavelet-Based SNR Estima63
Approximation
40
30
20
10
0
362
364
366
368
370
372
374
376
378
380
382
374
376
378
380
382
374
376
378
380
382
374
376
378
380
382
374
376
378
380
382
374
376
378
380
382
Time(s)
2
Detail 1
1
0
−1
−2
362
364
366
368
370
372
Time(s)
1
Detail 2
0.5
0
−0.5
−1
362
364
366
368
370
372
Time(s)
1
Detail 3
0.5
0
−0.5
−1
362
364
366
368
370
372
Time(s)
1
Detail 4
0.5
0
−0.5
−1
362
364
366
368
370
372
Time(s)
Detail 5
0.4
0.2
0
−0.2
−0.4
362
364
366
368
370
372
FIGURE 30. DWT Components using Wavelet-Based Estimator 1. Details and
Approximation evaluated with DW T Level = 5, Fs = 64 processing a 16QAM
signal with an average SNR of 30dB.
64
(a)SNRavg =4dB
10
Amplitude at the Receiver Input
Amplitude at the Transmitter Output
Wavelet-Filtered Amplitude (trend)
QAM Signal Amplitude
8
6
4
2
0
362
364
366
368
370
372
374
376
378
380
382
Time(s)
(b)SNRavg =14dB
6
Amplitude at the Receiver Input
Amplitude at the Transmitter Output
QAM Signal Amplitude
Wavelet-Filtered Amplitude (trend)
4
2
0
362
364
366
368
370
372
374
376
378
380
382
Time(s)
(c)SNRavg =30dB
6
Amplitude at the Receiver Input
Amplitude at the Transmitter Output
QAM Signal Amplitude
Wavelet-Filtered Amplitude (trend)
4
2
0
362
364
366
368
370
372
374
376
378
380
382
Time(s)
FIGURE 31. 16QAM signal amplitude at the receiver. Noted as: signal
amplitude at the receiver (green), signal as it is transmitted (blue), and signal as
it is estimated by Wavelet-Based SNR Estimator 1 (red) evaluated at an average
symbol SNR of (a) 4dB, (b) 14dB, (c) 30dB, with DW T Level = 5, Fs = 64.
65
(a)SNRavg =4dB
10
Channel Additive Noise
Noise Amplitude
Wavelet-Filtered Noise
5
0
−5
362
364
366
368
370
372
374
376
378
380
382
Time(s)
(b)SNRavg =14dB
4
Channel Additive Noise
QAM Signal Amplitude
Wavelet-Filtered Noise
2
0
−2
−4
362
364
366
368
370
372
374
376
378
380
382
Time(s)
(c)SNRavg =30dB
4
Channel Additive Noise
QAM Signal Amplitude
Wavelet-Filtered Noise
2
0
−2
−4
362
364
366
368
370
372
374
376
378
380
382
Time(s)
FIGURE 32. Noise comparison: channel vs Wavelet-Based Estimator 1. Noted as:
channel additive noise (blue), and noise estimated by Wavelet-Based SNR
Estimator 1 (red). Evaluated using a 16QAM signal with an average symbol SNR
of (a) 4dB, (b) 14dB, (c) 30dB, with DW T level = 5, Fs = 64.
66
tor 1 performs poorly at high SNRs when it operates on QAM signals: the amplitude estimation is accurate; however, the noise includes high amplitude peaks.
Wavelet-Based SNR Estimator 1 also behaves poorly at low SNR values. This behavior is expected from most SNR estimators, due to the high variance obtained
in the signal estimates due to high power interference. For the particular case of
Wavelet-Based SNR Estimator 1, low biased estimates can be obtained at low
SNRs if the received signal is multi-level envelope. As a final observation, note
that for 16QAM signals, Wavelet-Based SNR Estimator 1 performs best for midrange SNRs and that, according to the results shown in figure 28, the minimum
bias obtained changes according to the DW T Level selected for the wavelet filters.
The implementation of this Wavelet-Based Estimator can be modified to
operate on QAM signals. This modification consists of dismissing the detail component at the onset of each symbol for the noise estimate, assuming the receiver
is perfectly synchronized, and adding this detail component to the amplitude estimate instead. Figures 33 and 34 show the comparison in performance between
the regular Wavelet-Based SNR Estimator and the improved implementation for
multi-level modulations.
Another operational factor that was evaluated for Wavelet-Based Estimator
1 is the performance response to the sampling frequency. We already mentioned
that as the DW T Level increases, the sampling frequency has to increase as well.
We observed that as the DW T Level increases, the performance of the estimator
for all modulations evaluated improves as well; however, we have not mentioned
the effect of varying the sampling frequency at a fixed DW T Level. Figures 35
and 36 show the performance parameters for Wavelet-Based SNR Estimator 1
using a DW T Level = 5 at three different sampling frequencies, evaluated with
16QAM modulated signals. Finally, figures 37 and 38 show the performance re67
101
Wavelet-Based SNR Estimator- Regular
Wavelet-Based SNR Estimator- Improved for 16QAM
REF MSE=1dB
NMSE
100
10−1
10−2
10−3
2
4
6
8
10
12
14
16
18
20
22
24
26
28
30
SNR(dB)
FIGURE 33. Wavelet-Based Estimator 1 (NMSE) - 16QAM. Regular and
improved implementations evaluated with 16QAM modulated signals at the input,
with DW T Level = 5, Fs = 32.
68
102
Wavelet-Based SNR Estimator- Regular
Wavelet-Based SNR Estimator- Improved for 16QAM
REF BIAS=1dB
101
NBIAS
100
10−1
10−2
10−3
10−4
2
4
6
8
10
12
14
16
18
20
22
24
26
28
30
SNR(dB)
102
Wavelet-Based SNR Estimator- Regular
Wavelet-Based SNR Estimator- Improved for 16QAM
REF VAR=1dB
101
NVAR
100
10−1
10−2
10−3
10−4
2
4
6
8
10
12
14
16
18
20
22
24
26
28
30
SNR(dB)
FIGURE 34. Wavelet-Based Estimator 1 (NBIAS, NVAR) - 16QAM. Regular and
improved implementations evaluated with 16QAM modulated signals at the input,
with DW T Level = 5, Fs = 32.
69
101
Regular Imp(Fs=32)
Regular Imp (Fs=64)
Regualr Imp (Fs=128)
10
Improved Imp (Fs=32)
0
Improved Imp (Fs=64)
Improved Imp(Fs=128)
REF MSE= 1dB
NMSE
10−1
10−2
10−3
10−4
2
4
6
8
10
12
14
16
18
20
22
24
26
28
30
SNR(dB)
FIGURE 35. Wavelet-Based Estimator 1 (NMSE) - 16QAM, various Fs . Regular
and improved implementations evaluated with 16QAM modulated signals at the
input and different sampling frequencies, with DW T Level = 5.
sults for QPSK and 8PSK modulated signals at these same three sampling frequencies. We can observe that for constant envelope modulations, the changes in
performance due to the sampling frequency are negligible.
Wavelet-Based SNR Estimator 2: Self-Similarity Detector
Wavelet-Based Estimator 2 processes the quadrature components of the
received signal to obtain an SNR estimate. The quadrature components of both
8PSK and QAM modulated signals have multi-level amplitudes which allows the
use of wavelet filters as self-similarity detectors, considering the mother wavelet
in a rectangular transition (Haar). The idea behind this Wavelet-Based Estimator is to provide a simplified implementation of Wavelet-Based Estimator 1 that
performs better for both constant and multi-level envelope modulated signals. The
self-similarity detector is considered simplified because it uses only one DW T Level,
70
102
Regular Imp(Fs=32)
Regular Imp (Fs=64)
Regular Imp (Fs=128)
101
Improved Imp (Fs=32)
Improved Imp (Fs=64)
Improved Imp(Fs=128)
REF BIAS= 1dB
NBIAS
10
0
10−1
10−2
10−3
10−4
2
4
6
8
10
12
14
16
18
20
22
24
26
28
30
SNR (dB)
102
Regular Imp(Fs=32)
Regular Imp (Fs=64)
Regular Imp (Fs=128)
101
Improved Imp (Fs=32)
Improved Imp (Fs=64)
Improved Imp(Fs=128)
REF VAR= 1dB
NVAR
10
0
10−1
10−2
10−3
10−4
2
4
6
8
10
12
14
16
18
20
22
24
26
28
30
SNR (dB)
FIGURE 36. Wavelet-Based Estimator 1 (NBIAS, NVAR) - 16QAM, various Fs .
Regular and improved implemenations evaluated with 16QAM modulated signals
at the input and different sampling frequencies, with DW T Level = 5.
71
101
QPSK(Fs=32)
QPSK (Fs=64)
QPSK (Fs=128)
8PSK (Fs=32)
8PSK (Fs=64)
100
8PSK(Fs=128)
NMSE
REF MSE= 1dB
10−1
10−2
10−3
2
4
6
8
10
12
14
16
18
20
22
24
26
28
30
SNR(dB)
FIGURE 37. Wavelet-Based Estimator 1 (NMSE) - QPSK, 8PSK. Evaluated with
QPSK and 8PSK modulated signals at the input at different sampling frequencies,
with DW T Level = 5.
72
102
QPSK(Fs=32)
QPSK (Fs=64)
QPSK (Fs=128)
101
8PSK (Fs=32)
8PSK (Fs=64)
8PSK(Fs=128)
REF BIAS= 1dB
NBIAS
10
0
10−1
10−2
10−3
10−4
2
4
6
8
10
12
14
16
18
20
22
24
26
28
30
SNR (dB)
100
QPSK(Fs=32)
QPSK (Fs=64)
QPSK (Fs=128)
8PSK (Fs=32)
8PSK (Fs=64)
10−1
8PSK(Fs=128)
NVAR
REF VAR= 1dB
10−2
10−3
10−4
2
4
6
8
10
12
14
16
18
20
22
24
26
28
30
SNR (dB)
FIGURE 38. Wavelet-Based Estimator 1 (NBIAS,NVAR) - QPSK, 8PSK.
Evaluated with QPSK and 8PSK modulated signals at the input at different
sampling frequencies, with DW T level = 5.
73
reducing the number of filter banks and sampling frequency required. As a way to
improve the performance of the estimator, an adaptive threshold is used for the
denoising algorithm. This adaptive threshold classifies details in the wavelet domain as noise or as signal’s amplitude depending on a preliminary, instantaneous
SNR estimate fed back from the output of the wavelet filters.
Figures 39 and 40 show the performance parameters of Wavelet Based Estimator 2 when using 16QAM modulated signals at the input. The performance
is shown using different sampling frequencies. According to figure 39, the overall
performance (NMSE) of the SNR estimator improves as the sampling frequency
increases. From figure 40, we can observe that the SNR estimate’s variance decreases as the sampling frequency increases; however, the estimate’s bias varies
significantly. For low SNRs, the bias estimate with low sampling frequencies, with
the exception of Fs = 4, is better than the higher sampling frequencies. For high
SNRs, however, the bias estimate decreases as the sampling frequency increases.
Figures 41 and 42 show the performance parameters of Wavelet Based Estimator
2, this time using QPSK and 8PSK modulated signals at the input.
Note from figures 41 and 42 that for high SNRs, the estimator performs
better under QPSK modulated signals than under 8PSK. There is an important
difference between the quadrature components of QPSK and 8PSK signals. For
QPSK the IQ signals are bipolar, which means that they are comprised by two
levels with the same amplitude, but opposite in sign. For 8PSK and 16QAM, the
IQ signals comprise two different amplitudes, each with its negative counterpart.
The multi-levels present in IQ signals differentiate the signal under evaluation
from the mother wavelet, affecting the self-similarity criterion by causing a decrease in performance.
74
102
Fs=4
Fs=8
Fs=16
101
Fs=64
REF MSE= 1dB
NMSE
100
10−1
10−2
10−3
10−4
2
4
6
8
10
12
14
16
18
20
22
24
26
28
30
SNR(dB)
FIGURE 39. Wavelet-Based Estimator 2 (NMSE) - 16QAM. Evaluated using
16QAM modulated signals at the input at different sampling frequencies, with
DW T Level = 1.
75
102
Fs=4
Fs=8
Fs=16
101
Fs=64
REF BIAS= 1dB
NBIAS
100
10−1
10−2
10−3
10−4
2
4
6
8
10
12
14
16
18
20
22
24
26
28
30
SNR (dB)
102
Fs=4
Fs=8
Fs=16
101
Fs=64
REF VAR= 1dB
NVAR
100
10−1
10−2
10−3
10−4
2
4
6
8
10
12
14
16
18
20
22
24
26
28
30
SNR (dB)
FIGURE 40. Wavelet-Based Estimator 2 (NBIAS, NVAR) - 16QAM. Evaluated
using 16QAM modulated signals at the input at different sampling frequencies,
with DW T Level = 1.
76
102
QPSK(Fs=4)
QPSK (Fs=8)
QPSK (Fs=16)
10
1
QPSK (Fs=64)
8PSK (Fs=4)
8PSK (Fs=8)
8PSK (Fs=16)
100
8PSK(Fs=64)
NMSE
REF MSE= 1dB
10−1
10−2
10−3
10−4
2
4
6
8
10
12
14
16
18
20
22
24
26
28
30
SNR(dB)
FIGURE 41. Wavelet-Based Estimator 2 (NMSE) - QPSK, 8PSK. Evaluated
using QPSK and 8PSK modulated signals at the input at different sampling
frequencies, with DW T Level = 1.
77
102
QPSK(Fs=4)
QPSK(Fs=8)
QPSK(Fs=16)
101
QPSK(Fs=64)
8PSK(Fs=4)
8PSK(Fs=8)
8PSK(Fs=16)
10
0
8PSK(Fs=64)
NBIAS
REF BIAS= 1dB
10−1
10−2
10−3
10−4
2
4
6
8
10
12
14
16
18
20
22
24
26
28
30
SNR (dB)
102
QPSK(Fs=4)
QPSK(Fs=8)
QPSK(Fs=16)
101
QPSK(Fs=64)
8PSK(Fs=4)
8PSK(Fs=8)
8PSK(Fs=16)
10
0
8PSK(Fs=64)
NVAR
REF BIAS= 1dB
10−1
10−2
10−3
10−4
2
4
6
8
10
12
14
16
18
20
22
24
26
28
30
SNR (dB)
FIGURE 42. Wavelet-Based Estimator 2 (NBIAS, NVAR) - QPSK, 8PSK.
Evaluated with QPSK and 8PSK modulated signals at the input at different
sampling frequencies, with DW T Level = 1.
78
TABLE 4. Bias of the SNR Estimate, Wavelet-Based Estimator 2.
Modulation
QPSK
8PSK
16QAM
Fs
4
8
16
64
4
8
16
64
4
8
16
64
NBIAS (SNR=2dB)
1.1650
0.6856
0.9238
1.0130
1.1993
0.7085
0.9280
1.0261
1.1954
0.7352
0.9334
1.0439
BIAS (dB) (SNR=2dB)
2.3300
1.3712
1.8476
2.0260
2.3986
1.4170
1.8560
2.0522
2.3908
1.4704
1.8668
2.0878
NBIAS (SNR=4dB)
0.9885
0.1041
0.2666
0.3339
1.0512
0.1137
0.2687
0.3417
1.1008
0.1118
0.2675
0.3555
BIAS (dB) (SNR=4dB)
3.994
0.4164
1.0664
1.3356
2.1024
0.4548
1.0748
1.3668
4.4032
0.4472
1.0700
1.4220
The main contribution of Wavelet-Based Estimator 2 is the capacity to
provide estimates with a low bias for the critical cases when the SNR is low (below 6dB). Table 4 displays numerical quantities of the normalized and raw bias for
the different modulation schemes evaluated.
Performance Comparison Among SNR Estimators
Figures 43, 44, and 45 display the performance parameters for all estimators evaluated in this work using 16QAM modulated signals at the input. The
cases presented for each estimator are those that performed best. All performance
parameters are plotted for F s = 64, but additionally, results using a sampling frequency of F s = 128 are also plotted for the case of Wavelet-Based Estimator 1.
For Wavelet-Based Estimator 2, the case F s = 8 is also plotted because it performed best in terms of bias for this estimator at low SNRs (see table 4).
The NCRLB curve shown in the NMSE and NVAR graphs (figures 43 and
45) indicate the ideal performance of a maximum likelihood SNR estimator estimated over 29 samples, and it serves as an additional reference. All estimators
presented are evaluated over less than 29 samples since all the transient estimates
are dismissed; therefore, the NCRLB plotted is displayed as an ideal scenario
79
where there is no need to dismiss samples to estimate the performance parameters on the estimate.
From figure 43, note that the estimator with the best performance in terms
of NMSE for 16QAM modulated signals is Wavelet-Based Estimator 2 (Fs = 64)
for all SNRs, with the exception of the Moments Estimator performing slightly
better for the high end SNRs (negligible). From figure 44, note that for 16QAM
modulated signals, the highest bias for low SNRs is obtained with Wavelet-Based
Estimator 1 at Fs = 64, while for high SNRs, it is Wavelet-Based Estimator 2
(Fs = 8). The estimator that performs the best in terms of bias overall is WaveletBased Estimator 2 operating at Fs = 8 for low SNRs and at Fs = 64 for high
SNRs; however, the lowest overall bias is obtained at a mid-range SNR (16 dB)
using Wavelet-Based Estimator 1 at a sampling frequency Fs = 64. Figure 45
displays the variance of the estimates generated by each estimator using 16QAM
modulated signals. In terms of variance, the estimator that performs the best is
the Moments Estimator and the one that performs the worst is Wavelet-Based
Estimator 2 operating at Fs = 8.
Figures 46, 47, and 48 display the same results, this time using QPSK
modulated signals. The MPSK Moments Estimator was evaluated over 210 symbols, and the NCRLB is also calculated for this number of samples. For QPSK,
the estimator with the best performance in terms of NMSE is Wavelet-Based Estimator 2 with Fs = 64 for SNRs below 10dB and the Moments Estimator for high
SNRs above 10dB.
In terms of bias, for both 16QAM and QPSK, the best performance is obtained with Wavelet-Based Estimator 2. For the low SNR cases, this estimator
produces a lower bias estimate operating at a sampling frequency of Fs = 8; while
for higher SNRs, it performs better at a sampling frequency of Fs = 64. It is
80
101
Moments Estimator (Fs= 64, W=64)
Wavelet-Based Estimator 1 (Fs=64)
Wavelet-Based Estimator 1 (Fs=128)
Wavelet-Based Estimator 1 Improved Imp (Fs=64)
Wavelet-Based Estimator 1 Improved Imp (Fs=128)
Wavelet-Based Estimator 2 (Fs=8)
100
Wavelet-Based Estimator 2 (Fs=64)
REF MSE= 1dB
NCRLB (N=29 )
NMSE
10−1
10−2
10−3
10−4
2
4
6
8
10
12
14
16
18
20
22
24
26
28
SNR(dB)
FIGURE 43. Performance comparison (NMSE) for all SNR estimators - 16QAM.
Evaluated using 16QAM modulated signals at the input at different sampling
frequencies.
81
30
101
Moments Estimator (Fs= 64, W=64)
Wavelet-Based Estimator 1 (Fs=64)
Wavelet-Based Estimator 1 (Fs=128)
Wavelet-Based Estimator 1 Improved Imp (Fs=64)
Wavelet-Based Estimator 1 Improved Imp (Fs=128)
Wavelet-Based Estimator 2 (Fs=8)
Wavelet-Based Estimator 2 (Fs=64)
REF BIAS= 1dB
NBIAS
100
10−1
10−2
10−3
2
4
6
8
10
12
14
16
18
20
22
24
26
28
SNR(dB)
FIGURE 44. Performance comparison (NBIAS) for all SNR estimators - 16QAM.
Evaluated with 16QAM modulated signals at the input at different sampling
frequencies.
82
30
101
100
NVAR
10−1
10−2
Moments Estimator (Fs= 64, W=64)
Wavelet-Based Estimator 1 (Fs=64)
10
Wavelet-Based Estimator 1 (Fs=128)
−3
Wavelet-Based Estimator 1 Improved Imp (Fs=64)
Wavelet-Based Estimator 1 Improved Imp (Fs=128)
Wavelet-Based Estimator 2 (Fs=8)
Wavelet-Based Estimator 2 (Fs=64)
REF VAR= 1dB
NCRLB (N=29 )
10−4
2
4
6
8
10
12
14
16
18
20
22
24
26
28
SNR(dB)
FIGURE 45. Performance comparison (NVAR) for all SNR estimators - 16QAM.
Evaluated with 16QAM modulated signals at the input at different sampling
frequencies.
83
30
101
Moments Estimator (Fs= 64, W=64)
Wavelet-Based Estimator 1 (Fs=64)
Wavelet-Based Estimator 1 (Fs=128)
Wavelet-Based Estimator 2 (Fs=8)
Wavelet-Based Estimator 2 (Fs=64)
REF MSE= 1dB
NCRLB (N=210 )
100
NMSE
10−1
10−2
10−3
10−4
2
4
6
8
10
12
14
16
18
20
22
24
26
28
SNR(dB)
FIGURE 46. Performance comparison (NMSE) for all SNR estimators - QPSK.
Evaluated with QPSK modulated signals at the input at different sampling
frequencies.
84
30
101
NBIAS
100
10−1
10−2
Moments Estimator (Fs= 64, W=64)
Wavelet-Based Estimator 1 (Fs=64)
Wavelet-Based Estimator 1 (Fs=128)
Wavelet-Based Estimator 2 (Fs=8)
Wavelet-Based Estimator 2 (Fs=64)
REF BIAS= 1dB
10−3
2
4
6
8
10
12
14
16
18
20
22
24
26
28
SNR(dB)
FIGURE 47. Performance comparison (NBIAS) for all SNR estimators - QPSK.
Evaluated with QPSK modulated signals at the input at different sampling
frequencies.
85
30
101
100
NVAR
10−1
10−2
10−3
Moments Estimator (Fs= 64, W=64)
Wavelet-Based Estimator 1 (Fs=64)
Wavelet-Based Estimator 1 (Fs=128)
Wavelet-Based Estimator 2 (Fs=8)
Wavelet-Based Estimator 2 (Fs=64)
REF VAR= 1dB
NCRLB (N=210 )
10−4
2
4
6
8
10
12
14
16
18
20
22
24
26
28
SNR(dB)
FIGURE 48. Performance comparison (NVAR) for all SNR estimators - QPSK.
Evaluated with QPSK modulated signals at the input at different sampling
frequencies.
86
30
important to note that Wavelet-Based Estimator 1 produces the estimate with
the highest bias and that changes in sampling frequency do not change its performance in terms of bias.
From figure 48, we can observe that the Wavelet-Based Estimators operating on QPSK have higher variance in their SNR estimates compared to the Moments Estimator.
Figures 49, 50, and 51 display the performance parameter comparison among
SNR estimators operating on 8PSK modulated signals. As you can see from these
figures, the results are very similar to those obtained for QPSK.
Wavelet-Based Jamming Detector
The Simulink implementation of the Wavelet-Based Jamming Detector is
shown in appendix D, figure 65. The jamming generator includes three sources:
an MPSK modulated signal with a constant power envelope of 30dBm (considering a 1 Ohm resistance), a CGWN source which simulates the channel’s constant
noise level at 10 dBm, and a pulse-noise jamming source. The pulse-noise jamming source reduces the SNR by 20 dB. Two jamming patterns with different window sizes were evaluated (tables 5 and 6). The power estimation stage includes a
multiplier, an RMS block, and a running average block which uses a window size
of W = 300 samples and operates at Fs = 32. Once the power envelope is extracted, the signal is down-sampled to the symbol rate (Fs = 1) to be processed
by the wavelet filters. The first stage of wavelet filters extracts the trend and the
second stage detects the discontinuities in the trend, giving estimates of the instants where the jamming starts and ends.
Figure 52 shows the pulse-noise jamming signals used to evaluate the detector.
87
101
Moments Estimator (Fs= 64, W=64)
Wavelet-Based Estimator 1 (Fs=64)
Wavelet-Based Estimator 1 (Fs=128)
Wavelet-Based Estimator 2 (Fs=8)
Wavelet-Based Estimator 2 (Fs=64)
REF MSE= 1dB
NCRLB (N=210 )
100
NMSE
10−1
10−2
10−3
10−4
2
4
6
8
10
12
14
16
18
20
22
24
26
28
SNR(dB)
FIGURE 49. Performance comparison (NMSE) for all SNR estimators - 8PSK.
Evaluated with 8PSK modulated signals at the input at different sampling
frequencies.
88
30
101
NBIAS
100
10−1
10−2
Moments Estimator (Fs= 64, W=64)
Wavelet-Based Estimator 1 (Fs=64)
Wavelet-Based Estimator 1 (Fs=128)
Wavelet-Based Estimator 2 (Fs=8)
Wavelet-Based Estimator 2 (Fs=64)
REF BIAS= 1dB
10−3
2
4
6
8
10
12
14
16
18
20
22
24
26
28
SNR(dB)
FIGURE 50. Performance comparison (NBIAS) for all SNR estimators - 8PSK.
Evaluated with 8PSK modulated signals at the input at different sampling
frequencies.
89
30
101
100
NVAR
10−1
10−2
10−3
Moments Estimator (Fs= 64, W=64)
Wavelet-Based Estimator 1 (Fs=64)
Wavelet-Based Estimator 1 (Fs=128)
Wavelet-Based Estimator 2 (Fs=8)
Wavelet-Based Estimator 2 (Fs=64)
REF VAR= 1dB
NCRLB (N=210 )
10−4
2
4
6
8
10
12
14
16
18
20
22
24
26
28
SNR(dB)
FIGURE 51. Performance comparison (NVAR) for all SNR estimators - 8PSK.
Evaluated with 8PSK modulated signals at the input at different sampling
frequencies.
90
30
Jamming Source Amplitude 1 (20dBm)
1.5
1
0.5
0
0
200
400
600
800
1,000
1,200
1,400
1,600
1,800
1,200
1,400
1,600
1,800
Jamming Source Amplitude 2 (20dBm)
Time(s)
1.5
1
0.5
0
0
200
400
600
800
1,000
Time(s)
FIGURE 52. Jamming sources used to evaluate the jamming detector, Fs = 32.
91
The incoming signal in the receiver is processed to extract the power envelope. First, the instantaneous power of the signal is computed, followed by the
RMS which is calculated per symbol. These two steps are done to provide a smoother
curve for the instantaneous power and to increase the abruptness of the transitions of the jamming pulse. The instantaneous power RMS is then averaged using
a running mean block, with a window of size W = 320, which is given in samples and is equivalent to 10 symbols. If we increase the window, we could get a
smoother power envelope; however, the jamming pulse transition would spread in
time, losing abruptness. We need the transition to be sharp in our envelope estimate for the Wavelet-Based Detector to operate properly. Figure 53 shows the
received signal at the different processing stages described.
After the running average stage, the power envelope is down-converted to
a sampling frequency of Fs = 1 and is also converted to logarithmic scale (dB)
to eliminate the offset given by the amplitude of the signal (A=1). Figure 54 displays these signals. The first wavelet block that processes the power envelope in
dB is used in the configuration of the trend detector, with DW T Levels = 5. The
input, output (trend), and reference jamming pulse are shown in figure 55.
The discrete-amplitude trend observed in the third graph of figure 55 is the
one that we use as input to the second stage of the wavelet filters. In this second
stage, we use the wavelet transform’s details coefficients to detect the instant of
time in which jamming occurred. Figure 56 shows the output of the second stage
of the wavelet filter that operates as a transition detector.
Tables 5 and 6 display the results obtained from evaluating the WaveletBased Jamming Detector using the jamming patterns shown in figure 52. The
average error for the results displayed in tables 5 and 6 are 1.53% and 1.25%, respectively.
92
Jamming Pulse
1
0.8
0.6
0.4
0.2
0
0
200
400
600
800
1,000
1,200
1,400
1,600
1,000
1,200
1,400
1,600
1,000
1,200
1,400
1,600
1,000
1,200
1,400
1,600
1,000
1,200
1,400
1,600
Time(s)
Rx Signal
1.5
1
0.5
0
200
400
600
800
Inst Rx Power
Time(s)
2
1
0
0
200
400
600
800
Time(s)
Power RMS
1.6
1.4
1.2
1
0
200
400
600
800
RMS Mean (W=320)
Time(s)
1.2
1
0
200
400
600
800
Time(s)
FIGURE 53. Front end stages (signals) of the jamming detector, Fs = 32.
TABLE 5. Wavelet-Based Jamming Detector, Pattern 1
Jamming Pattern
Window 1 (180 Symbols)
Window 2 (180 Symbols)
Window 3 (300 Symbols)
Start Time (s)
96
456
1236
Detection (s)
97
449
1249
93
Error (%)
1.04
1.54
1.05
End Time (s)
276
636
1536
Detection (s)
289
641
1537
Error (%)
4.71
0.8
0.0651
Jamming Pulse
1
0.8
0.6
0.4
0.2
0
0
200
400
600
800
1,000
1,200
1,400
1,600
1,800
1,200
1,400
1,600
1,800
1,200
1,400
1,600
1,800
Down-Converted
Time(s)
1.3
1.2
1.1
1
0.9
0
200
400
600
800
1,000
Time(s)
dB Scale
1
0.5
0
0
200
400
600
800
1,000
Time(s)
FIGURE 54. Front end stages (signals) of the jamming detector, Fs = 32, Fs = 1.
Jamming Pulse
1
0.8
0.6
0.4
0.2
0
0
200
400
600
800
1,000
1,200
1,400
1,600
1,800
1,200
1,400
1,600
1,800
1,200
1,400
1,600
1,800
Power envelope (dB)
Time(s)
1
0.5
0
0
200
400
600
800
1,000
Power envelope trend (WF)
Time(s)
1
0.5
0
0
200
400
600
800
1,000
Time(s)
FIGURE 55. Power envelope trend obtained using wavelet filters (WF), Fs = 1.
94
Jamming Pulse
1
0.8
0.6
0.4
0.2
0
0
200
400
600
800
1,000
1,200
1,400
1,600
1,800
1,200
1,400
1,600
1,800
1,200
1,400
1,600
1,800
Trend (WF)
Time(s)
1
0.5
0
0
200
400
600
800
1,000
Jamming Detection Signal
Time(s)
1.4
1.2
1
0.8
0.6
0
200
400
600
800
1,000
Time(s)
FIGURE 56. Power envelope trend and jamming detection signal, Fs = 1.
TABLE 6. Wavelet-Based Jamming Detector, Pattern 2
Jamming Pattern
Window 1 (1080 Symbols)
Window 2 (120 Symbols)
Start Time (s)
156
1836
Detection (s)
161
1825
95
Error (%)
3.20
0.55
End Time (s)
1236
1956
Detection (s)
1249
1953
Error (%)
1.05
0.15
CHAPTER 6
CONCLUSION
SNR Estimators
Three different implementations of SNR estimators were developed and
studied in the previous chapter. The following conclusions were obtained:
1. The SNR logarithmic calculation provides estimates with lower NMSE
than the linear calculation. The difference is negligible for most cases evaluated;
however, in worst-case conditions of operation which include low SNRs, small averaging window sizes (W ) and low sampling frequencies (Fs ) resulted in an estimate that was 10% lower for the NMSE when using the logarithmic calculation.
2. The Moments Estimator operating on constant envelope modulations
has an NMSE that is invariant to the operating sampling frequency of operation
Fs . It also performs better when it uses running averages instead of fixed averages per symbol. Since this estimator is based on statistical moments obtained
using sample averages, the variance of the estimate decreases and consequently,
so does the NMSE as the size of the average window (W ) increases. The bias
only decreases with larger window sizes for the high SNR cases, which include
the SNRs greater than 10dB. In worst case operation conditions, which include
the lowest SNR and smallest window size W , the Moments Estimator has a bias
that is 300% (SNR estimate = 6 dB) of the real value (SNR = 2 dB). Finally, the
difference in performance due to modulation levels of the signal at the input is
negligible for practical purposes.
96
3. The Moments Estimator operating on multi-level envelope modulation
schemes performs better as the sampling frequency of operation (Fs ) increases;
however, for low SNR cases, this improvement is less significant than for high
SNR cases (in terms of both bias and variance). For the lowest SNR case, the
bias decreases up to 40% as the sampling frequency changes from the minimum
(Fs = 2) to the maximum (Fs = 64), while for high SNR cases, it decreases up to
90%. Similarly, for the lowest SNR case, the variance decreases up to 66% as the
sampling frequency changes from the minimum to maximum, while for high SNR
cases it decreases up to 97%.
4. Using the same implementation for the Moments Estimator (using fixed
window averages to compute the moments) under the same conditions resulted
in better performance for the NMSE for constant envelope modulation schemes
when compared to multi-level envelope modulation schemes. The differences in
NMSE become greater if running average blocks are used for the constant envelope schemes. This is due to the fact that the running average blocks reduce the
variance more effectively than the fixed average windows.
5. The sampling frequency for Wavelet-Based Estimator 1 is determined by
the number of DWT levels used in the implementation. This results in a restriction on the estimator sampling frequency (must operate at a power of two of the
number of levels used in the Discrete Wavelet Transform). The performance, in
terms of NMSE, increases as the number of scales or levels increase for this estimator; however, this results in more hardware resources and ultimately, a much
higher sampling frequency. As a final note, this estimator provides better SNR
estimates of constant envelope modulated signals than multi-level modulated signals (in terms of NMSE) if the sampling frequency is restricted to the minimum
(Fs = 2levels ). For the multi-level envelope case, the NMSE increases to unac97
ceptable levels on the high end of the SNR range evaluated. Note that this issue
for high SNRs was corrected with an improved implementation that improved the
NMSE by 98% for high SNRs; however, the regular implementation performs better by up to 60% for low SNRs.
6. Wavelet-Based Estimator 2 resulted in low biased estimates, for low
SNRs, on all modulation schemes. The estimator also performs better in terms
of NMSE as the sampling frequency of operation (Fs ) increases.
7. The estimators were also evaluated to provide best case estimates on
all modulation schemes. Depending on the modulation scheme and the parameter that needs to be minimized, an optimum configuration was presented and
evaluated. For 16QAM modulated signals, the estimator that performs the best
in terms of NMSE is Wavelet-Based Estimator 2 at Fs = 64; however, the Moments Estimator performs similarly for high SNRs (above 20 dB). In terms of
bias, Wavelet-Based Estimator 2 performs best overall; however, for low SNRs,
it should operate at Fs = 8. For high SNRs, it should operate at Fs = 64. For
a very narrow SNR range (14dB-18 dB), Wavelet Based Estimator 1 at Fs = 64
has the lowest bias of all estimators. In terms of variance, the Moments Estimator
performs the best of all estimators.
8. For QPSK and 8PSK modulated signals, the estimators that perform
the best in terms of NMSE are Wavelet-Based Estimator 2 and the Moments Estimator, both at F s = 64; the former performs best for SNRs below 10dB and the
latter for SNRs above 10dB. In terms of bias, different estimators perform best depending on the SNR range. In general, Wavelet-Based Estimator 2 performs best
for the lowest and highest SNRs at F s = 8 and F s = 64, respectively. For midrange SNR values (12-18 dB), the Moments Estimator performs the best. Finally,
in terms of variance, the Moments Estimator performs best of all.
98
Wavelet-Based Jamming Detector
1. The Wavelet-Based Jamming Detector performed very well. The detector was able to predict the start and end times of pulsed-noise jamming interference with an average error of less than 2% when the SNR decreases by 20dB.
General Conclusions
As we saw in this work, the Wavelet-Based Estimators provide an alternative in Estimation Theory that yield many benefits depending on the application
and purpose. In general, the Wavelet-Based Estimators resulted in lower biased
estimates than the Moments Estimator. The implementation of the Moments Estimator in this work, however, provided estimates with the lowest variance. By
knowing the strengths and weaknesses of each method, a tailored approach can be
customized to a specific application’s needs. The initial work on Wavelet-Based
Estimators provided in this thesis show very promising results and should continue to be researched as a possible alternative for future systems. In terms of
follow on work in regards to the material presented, a combined implementation
should be developed and evaluated using both the Wavelet-Based and Moments
Estimators to see if this hybrid implementation provides a more accurate unbiased
SNR estimator.
99
APPENDICES
100
APPENDIX A
MOMENTS ESTIMATOR: SIMULINK IMPLEMENTATION
101
FIGURE 57. Moments Estimator: implementation 1.
102
FIGURE 58. Moments Estimator: implementation 2.
103
FIGURE 59. Moments Estimator: implementation 3 (MPSK performance).
104
FIGURE 60. Moments Estimator: implementation 3 (QAM performance).
105
APPENDIX B
WAVELET-BASED ESTIMATOR 1: TREND DETECTOR
106
FIGURE 61. Wavelet-Based Estimator 1: constant envelope modulation schemes.
Trend detector (Simulink implementation 1).
107
FIGURE 62. Wavelet-Based Estimator 1: multi-level modulation schemes. Trend
detector (Simulink implementation 3).
108
FIGURE 63. Wavelet-Based Estimator 1: hard threshold block. Improved to
operate with QAM implemented in Simulink. The transient counters generate
pulses every symbol transition.
109
APPENDIX C
WAVELET BASED ESTIMATOR 2: SIMILARITY DETECTOR
110
FIGURE 64. Wavelet-Based Estimator: self-similarity detector. This detector was
used for all Modulations (Per Symbol Operation).
111
APPENDIX D
WAVELET-BASED JAMMING DETECTOR
112
FIGURE 65. Wavelet-Based Jamming Detector.
113
BIBLIOGRAPHY
114
BIBLIOGRAPHY
[1] C. S. Tsang, G. L. Lui, and K. T. Woo, “Algorithm and performance of a noncoherent SNR estimator,” in Military Communications Conference, 1995, MILCOM, vol. 1, 1995. pp. 155-159.
[2] N. E. Nahi and R. M. Gagliardi, On the Estimation of Signal to Noise Ratio and
Applications to Detection and Tracking Systems. USEE report 114. Los Angeles, CA: Space System Division, Air Force Systems Command, United States
Air Force, 1964.
[3] N. Nahi and R. Gagliardi, “Use of limiters for estimating signal to noise ratio
(corresp.),” IEEE Trans. Information Theory, vol. 13, no. 1, pp. 127–129,
1967.
[4] D. R. Pauluzzi, ”Signal-to-noise ratio and signal-to-impairment ratio estimation
in AWGN and wireless channels,”. PhD thesis, Dept. Elect. and Comp. Eng.,
Queen’s University, Kingston, ON, Canada, 1997.
[5] C. E. Gilchriest, “Signal-to-noise monitoring,” Supporting Research and Advanced Development - Space Programs Summary, vol. 4, no. 37-27, pp. 169–
184, 1964.
[6] J. W. Layland, “On S/N estimation,” Space Programs Summary, vol. 3, no. 3748, pp. 209–212, 1967.
[7] J. R. Lesh, “Accuracy of the signal to noise ratio estimator,” Deep Space Network Progress Report - JPL Technical Report 32-1526, vol. 10, pp. 217–235,
1972.
[8] T. Benedict and T. Soong, “The joint estimation of signal and noise from the
sum envelope,” IEEE Trans. Information Theory, vol. 13, no. 3, pp. 447–454,
1967.
[9] R. M. Gagliardi and C. Thomas, “PCM data reliability monitoring through estimation of signal-to-noise ratio,” IEEE Trans. Communication Technology,
vol. 16, no. 3, pp. 479–486, 1968.
[10] M. A. Simon M. K., “SNR estimation for the baseband assembly,” TDA Progress
Report11 - Jet Propulsion Lab, vol. 42-85, pp. 118–126, 1986.
115
[11] R. Matzner, “An SNR estimation algorithm for complex baseband signals using
higher order statistics,” Electronics and Energetics, vol. 6, no. 1, pp. 41–52,
1993.
[12] R. Matzner and F. Englberger, “An SNR estimation algorithm using fourthorder moments,” in Proc. 1994 IEEE Intl. Symp. Information Theory, 1994.
pp. 119-125.
[13] D. R. Pauluzzi and N. C. Beaulieu, “A comparison of SNR estimation techniques
in the AWGN channel,” in Proc. IEEE Pac. Rim Conf. on Comm., Comp.,
and Signal Proc., 1995. pp. 36-39.
[14] M. Simon and S. Dolinar, “Signal-to-noise ratio estimation for autonomous receiver operation,” in Global Telecommunications Conference, 2004, GLOBECOM ’04, IEEE, vol. 1, 2004. pp. 282-287.
[15] M. Alvarez-Diaz, R. Lopez-Valcarce, and C. Mosquera, “SNR estimation for multilevel constellations using higher-order moments,” IEEE Trans. Signal Processing, vol. 58, no. 3, pp. 1515–1526, 2010.
[16] A. Wiesel, J. Goldberg, and H. Messer-Yaron, “SNR estimation in time-varying
fading channels,” IEEE Trans. Communications, vol. 54, no. 5, pp. 841–848,
2006.
[17] A. Stephenne, F. Bellili, and S. Affes, “Moment-based SNR estimation for SIMO
wireless communication systems using arbitrary QAM,” in Conference Record
of the Forty-First Asilomar Conference on Signals, Systems and Computers,
2007. pp. 601-605.
[18] R. G. Lyons, Understanding Digital Signal Processing, 2nd ed. China: Pearson
Education Asia Ltd. and China Machine Press, 2005.
[19] S. G. Mallat, A Wavelet Tour of Signal Processing. [Online]. New York: Elsevier,
1999. Available: ScienceDirect Engineering eBook Collection.
[20] I. Daubechies, “Where do wavelets come from? A personal point of view,” Proceedings of the IEEE, vol. 84, no. 4, pp. 510–513, 1996.
[21] S. M. Kay, Fundamentals of Statistical Signal Processing: Estimation Theory.
Englewood Cliffs, N.J.: Prentice-Hall PTR, 1993.
116
© Copyright 2026 ExpyDoc