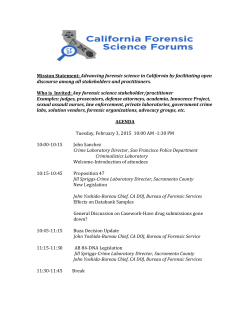
4/30/2014
Cincinnati HAZARD
A Place Based Strategy for Crime
and Traffic Crash Reductions
2014 INTERNATIONAL CONFERENCE
on
URBAN TRAFFIC SAFETY
May 2, 2014
Captain Daniel W. Gerard, M.S.
Police Officer Joseph Lorenz, M.S.
Cincinnati, Ohio Police Department
Presentation Focus Areas
1. Why HAZARD?
2. HAZARD Development
3 U
3.
Using
i Traffic
T ffi Data
D t to
t Reduce
R d
Violent
Vi l t
Crime and Traffic Crashes
4. Traffic Data Analytic Tools and How to
Use Them
Why HAZARD?
1
4/30/2014
X
Cincinnati, Ohio
• Population: 297,000
– 10% population loss in last decade
– 2.2 million in larger metropolitan area
– 51% White, 46% Black, 1.3% Hispanic
–
–
–
–
21.9% below poverty line
6.4% unemployed
19.1% less than HS Education
19.7% female-headed households
6
2
4/30/2014
What Works??
The Buzz Words
•
•
•
•
•
•
•
Community Policing
Problem Solving
Zero Tolerance
Compstat
Data Driven
Best Practices
Bias-Based Policing
•
•
•
•
•
•
•
•
Hot Spot Policing
Intelligence-led Policing
Evidence-based Policing
Place-Based Policing
g
Focused Deterrence
Fusion Centers
Real-time Crime Centers
Predictive Policing
Standard Model
• Diversity of Approaches = Mostly Law Enforcement
• Level of Focus = Low
– Resources target all crimes across all parts of the
jurisdiction served
• Examples:
– Increasing number of police
– Random patrol across all parts of community
– Rapid response to calls for service
– Generally applied follow-up investigations
– Generally applied intensive enforcement & arrest
policies
Standard Model:
Does it Work?
• Evidence:
– Widely used strategies
– In general not the most effective
strategy to reduce crime, disorder, or
fear of crime
3
4/30/2014
Community Policing
• Diversity of Approaches = Wide Array
• Level of Focus = Low
• Difficult to define
– Definition varies over time and across
agencies
– Principle assumptions is police draw from
larger array of resources
Focused Policing
• Diversity of Approaches = Mostly Law
Enforcement
• Level of Focus = High
• Examples:
– Police enforcement operations
– Hot-spots policing
– Intelligence-led
– Focus on repeat offenders/victims/places
Focused Policing:
Does it Work?
• Evidence:
– Strong body of evidence shows a
focused geographic approach to crime
problems
bl
increases
i
effectiveness
ff ti
– Most recent research demonstrates
effectiveness on targeting specific
types of offenders
4
4/30/2014
Involvement in Violence
Violence is not randomly distributed:
• Hot spot study in Minneapolis – 3% of city
addresses generated 50% of crime calls for
service
• Small number of serious chronic offenders
– Account for an overwhelming majority of crime and
violence
• Repeats:
repeat offenders, repeat victims,
repeat crimes, repeat addresses
In Many Areas Violent
Crime Remains a Problem
• Violent crime remains very high in some
places, even in “safe” cities
• Concentrated in poor minority
neighborhoods
• Concentrated by place and group even
within those neighborhoods
• Driven by violent groups and drug
markets
5
4/30/2014
Group Members Disproportionately Involved
in Homicides: June 06 - June 07
100%
90%
26.5%
99.5%
80%
70%
60%
73.5%
50%
40%
Non Group
Members
30%
20%
10%
Violent Group
Member
0.5%
0%
Population
Homicides
Cincinnati 2006 Homicide Rates
(per 100,000)
19.6x
700
16.1x
600
13.2x
500
576.1
473
387.6
400
300
3.5x
200
100
102.7
29.4
0
Cinci - All
Cinci - YBM
Avondale YBM
Walnut Hills YBM
OTR - YBM
HAZARD Development
6
4/30/2014
CPD Crime and Traffic
Strategy
• Prior to HAZARD development, CPD
had existing violent crime and traffic
strategies
CPD Traffic Safety Goal
• Traffic safety goal is to have CPD
Officers patrol along the busiest, high
crash locations during peak periods in
order to reduce fatal and injury auto
crashes.
• A core Patrol strategy for the CPD since
2006
Traffic Safety Core Strategies
• High Visibility Patrol
• Consistent Enforcement
• Relentless Analysis of Traffic Hot
Spots
• Outside Partnerships
7
4/30/2014
CPD Crime Strategy
• To combat violent crime, CPD regularly
employed a focused deterrence model
that narrowly focused on repeat
offenders,
ff d
repeatt llocations
ti
and
d repeatt
victims
• Violence was concentrated in gang
controlled areas
Demonstrating Crime and
Traffic Overlaps
• Prior to 2012 CPD did not track the
common locations for traffic crashes and
criminal activity
• Was a mistake
• When mapped and overlaid, clear
patterns developed
Cincinnati DUI Stops and Traffic Crashes
8
4/30/2014
Cincinnati Serious Traffic Crashes and Gang Locations
Cincinnati DUI Stops and Gang Locations
HAZARD Development
• Cincinnati High Activity Zones And
Resource Deployment-HAZARD
• D
Developed
l
d using
i the
h principles
i i l off
DDACTS and Place Based Policing
9
4/30/2014
HAZARD DevelopmentDDACTS
• Data Driven Approaches to Crime and
Traffic Safety-DDACTS
• DDACTS Developed
D
l
d by
b the
h US National
N i
l
Highway Traffic Safety Administration
• Operationally Based
HAZARD DevelopmentDDACTS
• Integrates location based crime and
traffic data
• U
Uses this
hi integration
i
i to better
b
deploy
d l
police resources
• Has a goal of reducing both crime and
traffic crashes in an area
HAZARD DevelopmentDDACTS
• Takes into account that police have ever
diminishing resources
• R
Recognizes
i
that
h both
b h criminal
i i l activity
i i
and traffic crashes often occur in close
proximity
• Recognizes crimes often involve vehicles
10
4/30/2014
HAZARD DevelopmentPlace Based Strategy
• Cities are identified by their
neighborhoods
• Citizen
Ci i
behavior,
b h i
both
b h good
d and
d bad,
b d in
i
those neighborhoods can define
perception of the entire neighborhood
HAZARD DevelopmentPlace Based Strategy
• In reality, majority of the criminal
activities in the neighborhood are
narrowly concentrated a specific
locations within the area:
Stores/parking lots/vacant
building/apartment buildings
HAZARD DevelopmentPlace Based Strategy
• Traffic crashes are the same
• A roadway may acquire a reputation for
hi h crash
high
h rates when
h in
i reality
li the
h
crashes only occur at certain times of the
day such as morning or afternoon rush
hours
11
4/30/2014
HAZARD DevelopmentPlace Based Strategy
• Police agencies routinely deploy their
officers in precincts, districts, zones,
sectors or beats
• All of these areas are geographically
large and more difficult to analyze for
underlying causative factors of crime
and crashes
HAZARD DevelopmentPlace Based Strategy
• A place based strategy focuses on
smaller geographic units of analysis
such as a particular address,
address
intersection, corner or street segment
HAZARD DevelopmentPlace Based Strategy
• A smaller geographic focus allows for
easier measurement of both criminal
and traffic activity patterns and more
timely identification of causative factors
12
4/30/2014
HAZARD DevelopmentPlace Based Strategy
• Easier measurement and more timely
identification of causative factors allows
for both quicker action plan development
and implementation and faster
modification of the plan if needed
HAZARD DevelopmentPlace Based Strategy
• CPD hypothesized that by combining
DDACTS principles with a place based
approach both crime and traffic crashes
approach,
would be reduced using highly visible
traffic enforcement on small street
segments where crime and crashes
overlapped in identified gang areas
HAZARD DevelopmentPlace Based Strategy
• CPD developed and tested HAZARD in
District 4
• D4
D ran through
h
h the
h center off the
h city
i for
f
11.6 square miles
• D4 was the 2nd busiest patrol district in
terms of citizen calls for service and
violent crime
13
4/30/2014
HAZARD DevelopmentPlace Based Strategy
• Prior to HAZARD implementation, the
D4 crime analyst broke the entire
district into 1 block street segments
• A total of 2352 individual street
segments were identified
HAZARD DevelopmentPlace Based Strategy
• Street Segments that experienced 2 or
more violent crimes in 2012 were then
identified
• 125 street segments fit the criteria
HAZARD DevelopmentPlace Based Strategy
• Next, street segments that experienced
3 or more traffic crashes in 2012 were
identified
• 302 street segments fit the criteria
14
4/30/2014
HAZARD DevelopmentPlace Based Strategy
• Of the 302 high traffic crash street
segments, 102 directly overlapped with
the identified high crime street
segments
HAZARD DevelopmentPlace Based Strategy
• Traffic citations were then analyzed
• In 2012, D4 officers issued 3935 traffic
citations for moving violations that did
not result in traffic crashes
HAZARD DevelopmentPlace Based Strategy
• Of these traffic citations, 26% of them
were issued in existing street gang
territories
• 44% of the citations were issued in the
identified high crash zones
15
4/30/2014
Violent Crimes/
OVI Arrests
Violent crimes( Homicides, Robberies,
and Aggravated Assaults)decreased by
111 offenses from 2011 (14.40%)
• Violent crimes accounted for 14.34% of
District Four’s Part 1 Crimes.
• Violent crimes by neighborhood:
Walnut Hills 25.75% (Beat 2)
Avondale
24.70% (Beat 3)
Roselawn 12.95% (Beat 5)*
Bond Hill
10.39%
10 39% (Beat 5)*
*Beat 5 Total: 23.34%
Beats 2, 3, and 5 accounted for 73.79%
of District Four’s violent crime
Mt. Auburn
North Avondale
Corryville
Carthage
Paddock Hills
Hartwell
7.83%
7.08%
4.52%
3.61%
1.66%
1.51%
16
4/30/2014
Robberies/ Traffic
Crashes
Of the 443 Robberies in District Four,
24 (5.42%) Resulted in Shootings
(Victims Struck.)
142 of the 443 Robberies occurred in
Gang Territory (32.05%)
• 14 of the 24 Robberies that
resulted in shootings occurred in
gang territory (58.33%)
(58 33%)
Robberies in District Four by
Neighborhood
Avondale
24.89%
Walnut Hills
24.43%
Roselawn
13.35%
Bond Hill
9.95%
Mt. Auburn
8.60%
North Avondale 6.33%
Corryville
5.20%
Carthage
4.30%
Hartwell
1.81%
Paddock Hills 1.13%
Aggravated
Assaults/Traffic
Crashes
Of the 211 Aggravated Assaults in
District Four, 61 (28.91%) Were
Shootings (Victim Struck.)
• Aggravated Assaults in District
Four by weapon type:
Firearm (Type Not Stated)
Handgun
K if /C tti I t
Knife/Cutting Instrument t
(Icepick, Ax, Etc.)
Blunt Object (Club, Motor Vehicle (When Used As Weapon)
Personal Weapons (Hands, Feet, Teeth, etc.)
None
Unknown
27.72%
13.86%
25.74%
13.37%
6.93%
10.40%
0.50%
1.49%
120 of the 211 Agg Assaults occurred
in Gang Territory (56.87%)
• 38 of the 61 Agg. Assaults
(Shootings) occurred in gang
territory (62.30%)
Violent Crimes, Accidents, and
Traffic Enforcement:
Technical Presentation
17
4/30/2014
Purpose
• To demonstrate how to overlap
densities to visualize common
locations for different datasets
• To demonstrate high activity street
segments for presentation and
analytical purposes.
Glossary
• Violent Crime (for the purposes of this
study)
– Homicides, Aggravated Robberies,
Robberies Felonious Assaults,
Robberies,
Assaults and
Aggravated Burglaries
• Tickets
– Traffic citations for any infraction not
related to an auto accident
Glossary
• Street Segments or Line Segments
– Series of addresses for a particular Street in a
GIS Street shape file. The length of the
segment and number of addresses in each
series is determined by the person who created
th shape
the
h
filled
fill d used.
d
• Peak Density
– The highest density for a particular data set
achieved by changing the number of classes
and changing the criteria for the density
delimiters.
18
4/30/2014
Tools Used
• ARCMap 10.1
• CAGIS created street shape files for
streets, neighborhoods,
i hb h d and
d police
li
districts
• Cincinnati Police Crime and Traffic
Databases
Data Selection and Cleaning
• Data pulled from police databases and
l d d into
loaded
i
an Excel
E l spread
d sheet
h
for
f
cleaning purposes.
Data Selection and Cleaning
• Data included dates, times, hours,
addresses, and crime/ traffic infraction
types
– Regarding Ticket addresses: the address of
the offense/infraction was used not the
address of the traffic stop.
19
4/30/2014
Data Selection and Cleaning
• Data issues that needed to be addressed
prior to mapping
– Standardizing the Addresses
• Street suffixes and even street names can be
recorded differently depending on the rules of
the particular database
• Traffic crashes and calls for service data in
Cincinnati can be expressed as street corner. Ex:
“Reading Rd/ Rockdale Av
– Recommend changing such address entries to numeric
addresses.
Geocoding
• Use a street
specific address
locator
• Set the points
to the Street
– “0 side offset”
– Set the end
offset to 2-3%
Joining Points
to Lines
20
4/30/2014
Joining Points to Lines
• Select the street
shape file you
want to use on
your map
– Right click and
follow the menu
to “Join”
– Navigate the
window
Joining Points to Lines
• Open the
attribute table
of the resulting
shape file
– Sort the “count”
column
l
on the
th
far right side of
the table
• Open editor and
delete the
unwanted
segments.
21
4/30/2014
Peak Density
• Standardizing the
original densities used
to create “peaks”
– Use the same “Search
Radius”, “Output”,
and “Processing
Extent” for all the
density processes.
• Maintains an
“Apples to Apples”
situation for further
analysis
Peak Density
• In “Arc Toolbox”
– Open “Spatial
Analyst Tools”
– Open “Reclass”
Reclass
– Open “Reclassify”
• Select the density
you want to change
• Click “Classify”
Peak Density
• Change Classes to
“2”
• Set the
“Exclusions”
Exclusions to “0”
0
• Check “Standard
Deviation” and
“Mean”
22
4/30/2014
Peak Density
• Two ways to
manipulate the
delimiters of each
class
– Change the
percentages on the
h
right side of the
window
– Physically manipulate
the delimiter lines
– Click O
– “OK”
Peak Density
•Change the
class labels
from “1” and
“2” to “0” and
“1”
respectively
Peak Density
• Adding the
Separate Peaks
together
– Open “Raster
Calculator”
– Add all
ll th
the
Reclassified
densities in the
equation window
– Creates a new raster
that has all the
classes overlapped.
23
4/30/2014
Questions?
Contact Information
Captain Daniel W. Gerard
Cincinnati Police Department
310 Ezzard Charles Drive
Cincinnati, OH 45214
[email protected]
(513) 263-8309
263 8309
Police Officer Joseph Lorenz
4150 Reading Road
Cincinnati, Ohio 45229
[email protected]
(513) 569-8628
24
© Copyright 2026 ExpyDoc