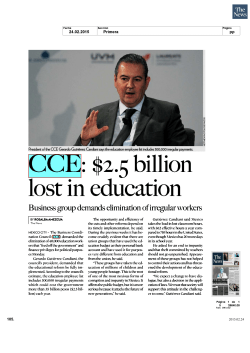
Progression of aging in Mexico
Artículo especial
Progression of aging in Mexico:
the Mexican Health
and Aging Study (MHAS) 2012
Rebeca Wong, PhD,(1) Alejandra Michaels-Obregón, MS, MBA,(1) Alberto Palloni, PhD,(2)
Luis Miguel Gutiérrez-Robledo, MD, PhD,(3) César González-González, PhD,(3-5) Mariana López-Ortega, MPP, PhD,(3)
Martha María Téllez-Rojo, PhD,(6) Laura Rosario Mendoza-Alvarado, Lic TS.(7)
Wong R, Michaels-Obregón A, Palloni A,
Gutiérrez-Robledo LM, González-González C,
López-Ortega M, Téllez-Rojo MM, Mendoza-Alvarado LR.
Progression of aging in Mexico:
the Mexican Health and Aging
Study (MHAS) 2012.
Salud Publica Mex 2015;57 suppl 1:S79-S89.
Abstract
Objective. To describe the third wave of the Mexican
Health and Aging Study (MHAS), completed in 2012, and
present preliminary results. Materials and methods.
Descriptive analyses by gender and age group of demographic
and socioeconomic characteristics, health conditions and
health behaviors, as well as social support and life satisfaction
measures are presented. In addition, external validations are
presented by comparing MHAS 2012 indicators with other
national data sources. Results. For the panel of older adults
in the sample, the rate of health care insurance coverage
increased greatly between 2001 and 2012, a significantly
higher change in rural compared to urban areas. The results
for 2012 are consistent with the previous two waves for the
main indicators of health and physical disability prevalence,
risk factors, and behaviors. Conclusions. The MHAS offers
a unique opportunity to study aging in Mexico, as well as to
complete cross-national comparisons.The cumulative number
of deaths in the cohort should support the study of mortality and its association with health outcomes and behaviors
(1)
(2)
(3)
(4)
(5)
(6)
(7)
Wong R, Michaels-Obregón A, Palloni A,
Gutiérrez-Robledo LM, González-González C,
López-Ortega M, Téllez-Rojo MM, Mendoza-Alvarado LR.
Progresión del envejecimiento en México:
Estudio Nacional de Salud y Envejecimiento
en México (Enasem) 2012.
Salud Publica Mex 2015;57 supl 1:S79-S89.
Resumen
Objetivo. Describir la tercera ronda del Estudio Nacional
de Salud y Envejecimiento en México (Enasem), completada
en 2012, y presentar algunos resultados preliminares. Material y métodos. Se presentan análisis descriptivos por
género y grupo de edad, de las características demográficas
y socioeconómicas, de las condiciones y comportamientos
de salud, así como de las medidas de apoyo social y de satisfacción con la vida. Además, se presentan los resultados de
validaciones externas realizadas comparando indicadores del
Enasem 2012 con los de otras fuentes de datos nacionales.
Resultados. Para el panel de los adultos mayores en la
muestra, la tasa de cobertura de aseguramiento en salud
aumentó considerablemente entre 2001 y 2012; el cambio
fue significativamente mayor en zonas rurales en comparación
con las urbanas. Los resultados de los principales indicadores
de salud, prevalencia de la discapacidad física, factores de
riesgo y comportamientos de salud son consistentes con
los de las dos rondas anteriores. Conclusiones. El Enasem
ofrece una oportunidad única para estudiar el envejecimiento
Sealy Center on Aging, WHO/PAHO Collaborating Center on Aging and Health, University of Texas Medical Branch. The United States.
Center for Demography and Ecology, University of Wisconsin. The United States.
Instituto Nacional de Geriatría. Mexico.
Instituto Nacional de Salud Pública. Mexico.
University of Texas Medical Branch. The United States.
Centro de Investigación en Nutrición y Salud, Instituto Nacional de Salud Pública. Mexico.
Centro de Investigación en Evaluación y Encuestas, Instituto Nacional de Salud Pública. Mexico.
Received on: March 24, 2015 • Accepted on: April 14, 2015
Corresponding author: Dr. Rebeca Wong, PhD. University of Texas Medical Branch.
301 University Blvd. 77555-0177 Galveston, TX, The United States of America.
E-mail: [email protected]
salud pública de méxico / vol. 57, suplemento 1 de 2015
S79
Artículo especial
Wong R y col.
over the life cycle. In addition, the sub-samples of objective
markers will enable methodological research on self-reports
and associations of biomarkers in old age with similar health
outcomes and behaviors.
en México así como para realizar comparaciones entre países.
El número acumulado de muertes en la cohorte permitirá
un mejor estudio sobre mortalidad y las consecuencias en
salud de los comportamientos a lo largo del ciclo de vida.
Además, los marcadores objetivos en la submuestra permitirán el análisis metodológico de los autorreportes y de las
asociaciones de los biomarcadores con los resultados y los
comportamientos de salud en la vejez.
Key words: older adult; longitudinal studies; health; aging;
Mexico
Palabras clave: adulto mayor; estudios longitudinales; salud;
envejecimiento; México
A
ll countries around the world are experiencing a
rapid growth in the population of older adults;
adults 60 years and older will be the largest group in
the population age pyramid of most countries by 2050, a
number reported to grow to 2 billion by 2050, surpassing
the population of children 0 to 14 years old.1,2
The current relatively fast pace of aging in Latin
America compared to that experienced by developed
countries in the past is an inevitable consequence of the
timing and pace of the demographic transition and the
shift due to rapid mortality and fertility declines. In addition to this peculiarity, it is important to note that the
decline of child and adult mortality rates in the developing countries was achieved mainly through successful
adoption of health policies and medical technology.3,4
Conversely, in developed countries that aged before,
the transition occurred mainly by improving the standards of living in populations that already enjoyed high
standards at the time that their aging process started.
Another factor is that this fast pace of aging is taking
place under insufficient economic development and
institutional infrastructure. Aging is thus premature,
given the level of economic development in Mexico,
as in other developing countries. This set of unique
features implies that we have a scientific opportunity
to make original contributions to the study of aging by
studying the population of countries like Mexico. The
current cohorts of older adults in Mexico survived childhood conditions characterized by infectious diseases
and generally low socioeconomic infrastructure. Future
cohorts will be vastly different, having lived their infancy
and adulthood with significant improvements in public
health and education compared to the current cohorts
of elderly. Thus, comparisons across birth cohorts over
time will provide insights on how aging can proceed in
rapidly changing societies in developing countries like
Mexico.
The Mexican Health and Aging Study (MHAS) is
the first longitudinal study of older adults in Mexico
with a broad socioeconomic perspective.5 The study was
S80
designed following the blueprints of the first longitudinal
study of this kind, the Health and Retirement Study of the
United States (HRS) that began in 1992,6 while incorporating unique features relevant to the Mexican context and
culture. Since the launch of the MHAS in 2001, more than
30 similar studies have been conducted in other countries
including England,7 China,8 India, South Korea, Ireland,9
Costa Rica, and other countries in Western Europe.
The MHAS primary objective is to collect information from a large representative panel of the Mexican
population 50 years old and over to examine the aging
process and its disease and disability burden using a wide
socioeconomic perspective.10 The MHAS was designed
to prospectively evaluate the impact of disease on the
health, function, and mortality of older adults in Mexico.
The study included a baseline survey in 2001 of a
national representative sample in both rural and urban
areas, of individuals born prior to 1951. The fieldwork
was conducted by trained personnel from the Instituto
Nacional de Estadística y Geografía (INEGI) in Mexico. The
baseline sample was drawn from the National Employment Survey (Encuesta Nacional de Empleo, ENE), carried
out by INEGI. Households with at least one resident aged
50 years or older were selected to be part of the sample; if
more than one person was age-eligible, one was randomly
selected. Also, if the selected subject was married or in a
consensual union, with the spouse residing in the same
household, the spouse or partner was also recruited for
the study regardless of his/her age. Six states accounting
for 40% of all migrants to the U.S. were over-sampled (ratio 1.7 to 1), and a random sub-sample was selected from
which to obtain anthropometric measures. The second
wave of the study took place in 2003, in which all study
subjects from 2001 were followed up and new spouses
were added to the study. During the follow-up interview,
a next-of-kin interview on deceased study subjects was
also completed. The thematic content of the MHAS survey instrument included: demographic data, household
residents and children’s rosters, self-reported health in
several dimensions (chronic diseases, perceived global
salud pública de méxico / vol. 57, suplemento 1 de 2015
Progression of aging in Mexico
health, physical function, cognition, depression), information on parents and children, help received from- and
given to- children, institutional support, life satisfaction,
time use, social support and social engagement, dwelling
conditions, economic aspects such as health expenditures,
health insurance coverage, pensions received or expected,
income by sources, and the value of accumulated assets.
Further details on the study can be found in Wong and
colleagues.11
The third wave of the MHAS was conducted in
2012, consisting of a third follow-up interview to all ageeligible subjects from the 2001 and 2003 surveys. This
wave added also a sample of people born in 1952-1961
(50 to 60 years old in 2012) to “refresh” the study sample,
as well as their spouses/partners regardless of age. The
new sample was drawn from the 2012 Mexican National
Employment and Occupation Survey (ENOE, previously named National Employment Survey, ENE). The
MHAS study protocol and instruments were approved
by the Institutional Review Board or Ethics Committee
of the University of Texas Medical Branch, the INEGI
in Mexico, and the Instituto Nacional de Salud Pública
(INSP) in Mexico. The MHAS thus far has obtained high
response and follow-up rates.11,12 A fourth wave of the
MHAS will be collected in 2015.
The MHAS offers a unique opportunity to examine
the dynamics of aging in Mexico. The sample size and
the periods between waves allow for full estimation of
the transitions in physical and mental health, functionality, labor force, and migration over time. In addition,
the cumulative number of deaths over time provides
enough statistical power to study the association between mortality, migration, physical and mental health,
and disability. Also unique to the timing of the three
waves is the ability to study the impact of health reforms
such as the introduction of Seguro Popular in 2003.13 Finally, also important to the longitudinal characteristics
of the study is the possibility to estimate cohort effects
thanks to the addition of younger-cohort samples over
time. In the rest of the article, we summarize the third
wave of the MHAS, completed in 2012, and present
select basic results.
Materials and methods
The MHAS 2012 aimed to re-contact the 2001 and 2003
respondents and add a representative sample of the
population from the 1952-1961 birth cohorts. In addition, similar to 2003, new spouses/partners of study
subjects were added to the study regardless of age, and
proxy and next-of-kin interviews were conducted when
applicable. A new sub-sample was selected for the 2012
survey in order to collect anthropometric measures,
salud pública de méxico / vol. 57, suplemento 1 de 2015
Artículo especial
blood pressure readings, performance tests, and blood
biomarkers. The fieldwork was completed once again
by trained personnel of the INEGI. The sub-sample
fieldwork was completed in collaboration with the
INSP. During the 2012 survey 18 465 interviews were
completed, including 12 569 follow-up and 5 896 new
sample interviews. Of the total, 14 448 were direct, 1 275
were proxy interviews, and 2 742 were next-of-kin. Over
the life of the panel, the cumulative number of reported
deaths with next-of-kin interviews is 3 288. The response
rate for the 2012 survey was 88.1% (i.e., interviews were
obtained corresponding to 88.1% of target individuals,
dead or alive). Also new to 2012 was that the survey was
conducted using a new Computer Assisted Personal
Interview (CAPI) system, as interviews were conducted
with paper-and-pencil in the first two waves.11
To provide an overview of the population 50 years
and older in 2012, we begin our analyses with descriptions of a selection of demographic and socioeconomic
characteristics, self-reported health conditions and
health behaviors, as well as social support and satisfaction items. We then conduct a brief external survey
validation of MHAS 2012 by comparing indicators with
the 2010 Census14 and the National Health and Nutrition
Survey (Encuesta Nacional de Salud y Nutrición, Ensanut)
2012.15 Both the descriptions and the survey validation
results are weighted statistics using individual sampling
weights.
Results
Demographic and socioeconomic
characteristics
Table I provides descriptive statistics by gender and by
age group (50-59 and 60 years and older). As in previous
waves of the study, the findings reflect greater survival
of women compared to men and a tendency for women
to remain without a partner in old age. The mean age
was relatively higher for men compared to women (67.8
versus 66.4 years). For both genders, approximately 8%
of the population 50 and older was aged 80+. Regarding
marital status, a higher percentage of women than men
reported being single, widowed, divorced, or separated:
41.1% of women compared to 18.6% of men.
The mean years of education was higher for men
(7.8 years) than for women (7.0 years); 10.5% of women
reported having no formal education compared to 9%
of men. Despite the consistent higher level of educational achievement for men compared to women, the
education gap by gender is closing as reflected by
comparisons of the younger cohort (ages 50-59) with the
older cohort (ages 60+). Regarding employment status,
S81
Wong R y col.
Artículo especial
Table I
Demographic and socioeconomic characteristics.
Mexico, Mexican Health and Aging Study, 2012*
Total %
Age
50-59
60-69
70-79
80+
Marital status
Married, union
Single, divorced, separated
Widowed
67.75 (41.33)
43.3
32.3
16.3
8.2
Males
50-59
%, Mean (SD)
100
-
60+
%, Mean (SD)
Total %
%, Mean (SD)
56.9
28.7
14.4
66.44 (37.98)
46.4
30.1
15.8
7.7
Females
50-59
%, Mean (SD)
100
-
60+
%, Mean (SD)
56.2
29.4
14.4
81.4
10.6
8.0
84.5
13.8
1.7
79.0
8.2
12.8
58.9
18.7
22.4
68.8
22.4
8.8
50.3
15.5
34.2
7.84 (5.87)
9.0
24.1
23.6
43.4
8.26 (5.18)
6.0
23.4
23.5
47.1
6.90 (7.11)
16.5
25.9
23.7
33.8
6.96 (6.07)
10.5
23.6
24.5
41.4
7.25 (6.03)
9.1
23.1
25.6
42.1
5.61 (6.11)
17.2
25.7
19.3
37.9
Locality size (population)
100 000+
15 000-100 000
2 500-15 000
<2 500
46.7
14.5
13.7
25.2
49.7
15.9
13.8
20.6
44.4
13.4
13.7
28.6
49.4
14.2
13.7
22.7
51.7
14.8
13.5
20.0
47.3
13.8
13.8
25.0
Migration
Ever migrant to the US
14.8
14.5
15.0
3.5
3.0
3.9
Education
0 years
1-5 years
6 years
7 years or more
Number of children
Number of children (alive)
4.68 (3.01)
3.77 (2.60)
5.37 (2.89)
4.63 (2.63)
3.78 (1.96)
5.37 (2.89)
Employment
Currently works
Is looking for job
Household work
Doesn’t work
68.5
2.1
1.4
27.9
88.5
2.8
1.2
7.4
52.3
1.5
1.6
44.5
27.2
0.6
57.4
14.7
40.2
1.1
53.0
5.7
16.4
0.3
61.1
22.3
Health insurance
Social security (IMSS)
ISSSTE/ State ISSSTE
Seguro Popular
Pemex/Defensa/Marina
Private medical insurance
Other
None
33.5
10.6
31.3
1.8
3.7
2.3
16.9
30.8
10.3
31.7
1.1
4.4
2.9
18.8
35.5
10.8
31.0
2.3
3.2
1.9
15.4
34.1
11.7
32.5
2.5
3.2
2.3
13.7
31.4
11.0
34.1
3.4
3.8
3.0
13.4
36.5
12.3
31.1
1.7
2.7
1.8
14.0
Other benefits
Social security (IMSS)
ISSSTE
SAR (Saving for retirement)
Accounts in “afores”
Housing credit
Private health insurance/ Insurance for medical expenses
Life insurance
Other
No other benefit
30.4
6.5
22.4
22.6
23.5
8.5
14.7
2.9
59.4
39.9
8.5
29.6
30.6
31.7
11.0
20.2
5.0
47.0
23.1
4.9
16.9
16.6
17.3
6.6
10.4
1.4
68.8
15.9
4.7
11.9
11.8
14.5
3.0
7.6
1.2
78.6
25.6
7.6
19.0
18.7
23.6
5.4
11.2
2.0
65.5
7.4
2.3
5.8
5.9
6.6
1.0
4.5
0.5
89.9
Total sample (n)
6 465
1 800
4 665
8 432
2 902
5 530
* Weighted averages and percentages
Source: Reference 5
ISSSTE: Instituto de Seguridad y Servicios Sociales de los Trabajadores del Estado
IMSS: Instituto Mexicano del Seguro Social
S82
salud pública de méxico / vol. 57, suplemento 1 de 2015
Progression of aging in Mexico
Artículo especial
57.4% of women were engaged in household work and
68.5% of men reported to work. The percentage of men
50 years and older who ever migrated (to live or work)
to the US was significantly higher compared to women
(14.8 versus 3.5%). This result is very similar to the one
obtained in 2001 with the baseline MHAS.16,17
Compared to the health insurance coverage reported in 2001, the 2012 data confirmed a significant
increase in insurance coverage among adults, particularly in rural areas. Figure 1 illustrates the insurance
changes by locality size between 2001 and 2012. Of
the total rural population aged 50 and older in 2001,
almost one-half (49.9%) were uninsured in 2001 but
had insurance by 2012. This gain was relatively lower
in urban areas (19.9%). The rise in insurance coverage
by 2012 is mainly explained by the introduction of the
Seguro Popular around 2003, a social protection policy
designed to provide access to health services to the
population who lacked other public or private health
care coverage, a measure which had higher impact
in rural areas.13 In 2001, 49.3% of men and 45.1% of
women had no health insurance coverage.18,19 In 2012,
only 16.9% of men and 13.7% of women reported having no insurance (table I).
3.5%
7.1%
1.5%
17.4%
31.8%
19.9%
69.5%
49.4%
Insured in 2012 and 2001
Insured in 2012, Uninsured in 2001
Uninsured in 2012, Insured in 2001
Uninsured in 2012 and 2001
* Weighted percentages using only follow-up sample. Results presented by
locality size in 2012
Source: reference 5
Figure 1. Insurance status in the MHAS panel
in 2001 and 2012 by locality size*
Health conditions
Table II provides descriptive statistics of health conditions
and health behaviors by gender and for two age groups
(50-59 and 60 years and older) in 2012. High percentages
of the population reported poor or fair global health
status: 57.1% of men and 67.5% of women. These results
salud pública de méxico / vol. 57, suplemento 1 de 2015
are consistent to those obtained with the MHAS 2001
cross-section, where 57.6% of men and 67.9% of women
of comparable ages reported poor and fair health status.20
Table II indicates also that the self-report of chronic health conditions was higher for the older age group
(60 years and older) compared to the younger counterparts. These self-reports were based on answers to
the question “has a doctor or medical personnel ever
told you that you have…” for each condition. These
age differences held for hypertension, diabetes, lung
disease, heart attack, stroke, and arthritis. One exception is self-reported cancer among women (those aged
50-59 have similarly low rates as do women aged 60+).
In addition, the self-report of chronic diseases was
consistently higher among women compared to men,
with two exceptions: in the older age group, more men
than women self-reported having had a heart attack
or stroke.
Physical disability
We used the functional dependence definition to capture
the concept of disability, traditionally measured through
surveys with self-reports on the ability to conduct the
basic activities of daily living (ADL) without help.21 We
focus on six basic ADLs: bathing, toileting, transferring
into and out of bed, walking, dressing, and eating. We
collapsed the number of disabilities into categories to
facilitate analysis: no ADLs, one ADL, two ADLs, and
three or more ADLs. Women reported more often than
men having difficulty with the six daily tasks. Results
also show that, with age, the percentage of men and
women reporting difficulty with ADLs was higher,
especially in the subgroup of women 60 and older.
As for the instrumental activities of daily living
(IADL), we included four IADL: preparing a hot meal,
shopping for groceries, taking medication, and managing own money. The 2012 results indicate that women
consistently had more difficulty than men with most of
the IADL, despite their being closely tied to activities
that are commonplace for women throughout their life.
Men reported higher percentage of limitations only in
“preparing a hot meal”, which can be due to their life
history, cultural practices, and the historical division of
labor between men and women in Mexico.
Risk factors: body mass index
and tobacco smoking
We used body mass index (BMI), which was calculated by dividing self-reported weight (kilograms)
by self-reported height (meters) squared.22,23 For the
descriptive analysis, we grouped BMI using the World
S83
Wong R y col.
Artículo especial
Table II
Health conditions and behaviors. Mexico, Mexican Health and Aging Study, 2012*
Total
%, Mean (SD)
Males
50-59
%, Mean (SD)
60+
%, Mean (SD)
Total
%, Mean (SD)
Females
50-59
%, Mean (SD)
60+
%, Mean (SD)
Self reported health
Excellent
Very good
Good
Fair
Poor
3.0
5.9
34.0
47.5
9.6
3.1
7.9
39.9
44.5
4.7
2.9
4.3
29.5
49.9
13.4
2.9
2.8
26.8
52.4
15.1
3.5
3.2
29.6
52.9
10.9
2.3
2.4
24.4
52.0
18.9
Health conditions
Hypertension
Diabetes
Cancer
Lung disease
Heart attack
Stroke
Arthritis
15.5
16.8
1.1
4.2
3.5
2.7
7.7
11.1
14.1
0.2
3.6
1.4
1.9
4.5
18.8
18.9
1.7
4.7
5.1
3.3
10.1
21.9
21.8
2.4
5.9
2.7
1.8
17.1
17.2
18.6
2.8
5.7
2.1
1.6
12.4
26.0
24.6
2.0
6.1
3.1
2.0
21.2
Disability
Number of ADL limitations
0
1
2
3 or more
Number of IADL limitations
0
1
2
3 or more
89.2
6.4
2.0
2.4
94.7
3.4
1.2
0.7
85.0
8.7
2.7
3.6
82.3
9.9
3.1
4.8
88.4
7.3
1.2
3.1
76.7
12.2
4.8
6.3
85.9
8.0
3.2
2.9
92.8
4.2
2.0
1.0
80.6
11.0
4.1
4.3
86.2
6.9
1.7
5.2
91.2
4.5
0.8
3.5
81.6
9.0
2.5
6.8
Body mass index
Underweight
Normal weight
Overweight
Obese
26.90 (4.31)
1.1
32.1
44.6
22.3
27.58 (4.31)
0.3
26.5
45.5
27.7
26.63 (4.29)
1.8
36.6
43.8
17.8
27.88 (5.43)
1.6
31.9
39.9
26.7
28.55 (5.35)
0.4
29.8
41.4
28.3
27.51 (5.44)
2.6
33.8
38.4
25.2
Health behaviors
Ever smoked
Current smoker
60.0
20.6
59.5
22.8
60.4
19.0
20.7
8.0
24.6
12.0
17.2
4.5
Total sample (n)
6 465
1 800
4 665
8 432
2 902
5 530
* Weighted averages and percentages
Source: Reference 5
ADL: activities of daily living
IADL: instrumental activities of daily living
Health Organization cut-off points24 into the following categories: <18.5=underweight, 18.5-24.9=normal,
25-29.9=overweight, and >30=obese. The mean BMI was
higher for women compared to men; this result is also
observed across age groups. The percentage of obesity
was significantly higher for women than for men (26.7
versus 22.3%). However, the combined percentage of
obese and overweight men was 66.9%, a result similar
to that for women (66.6%).
S84
Respondents were asked if they were “current
tobacco smokers”. The 2012 results (table II) confirmed
that cigarette smoking was more prevalent among
males (20.6%) than females (8.0%).25 The difference in
smoking prevalence between men and women was
higher in the 60 years and older cohort compared to the
younger cohort, reflecting an increasing propensity to
smoke among younger women (12%) compared to older
women (4.5%).
salud pública de méxico / vol. 57, suplemento 1 de 2015
Progression of aging in Mexico
Artículo especial
agreed with this statement. This result was similar for
the statement “conditions of life are excellent”, “satisfied
with life”, and “got things that are important”. In general, life satisfaction seemed similar or slightly higher
for older (aged 60+) adults compared to the younger
cohort (age 50-59).
Social support and satisfaction
An important addition introduced in MHAS 2012 was
the inclusion of several psychosocial measures. Table III
shows results for the main measures of the new section,
including health care decisions and life satisfaction.
A majority of both men and women (84-89%) perceived that they had a lot of power over personal health
decisions. In addition, both men and women indicated
a strong preference for making final decisions regarding
personal health, either by themselves (55-59%) or with
their doctor and family (30-38). Only 11.4% of men and
8.3% of women would leave the decisions to the doctor
only. Finally, the results indicate higher life satisfaction
among men compared to women. While 71.4% of men
believed their life was close to ideal, 67.8% of women
External survey validation
Table IV provides the results of the survey validation
exercise comparing indicators of MHAS 2012 with the
2012 Ensanut, for both age cohorts 50-59 years and 60
years and older. Despite the differences found across
studies, the validation exercise revealed satisfactory
comparisons. We present only a selection of measures
that were comparable across the two data sources.
Table III
Social support and satisfaction. Mexico, Mexican Health and Aging Study, 2012*
Total
%
Health decisions
Perception of power over personal health decision
A lot
86.2
Little
13.1
Not at all
0.7
Preferences over who makes final decision over personal health
Individual or his/her family
57.9
Between the doctor, individual and family
30.7
Doctor
11.4
Life satisfaction
Life is close to ideal
Agree
Neutral
Disagree
Conditions of life are excellent
Agree
Neutral
Disagree
Satisfied with life
Agree
Neutral
Disagree
Got things that are important
Agree
Neutral
Disagree
Would change almost nothing from life
Agree
Neutral
Disagree
Total sample (n)
Males
50-59
%
60+
%
Total
%
Females
50-59
%
60+
%
89.0
10.5
0.4
84.0
15.0
1.0
87.4
11.8
0.8
89.1
10.3
0.6
85.8
13.2
1.0
56.0
30.1
13.9
59.4
31.1
9.5
55.5
36.2
8.3
54.5
37.7
7.8
56.4
34.8
8.8
71.4
17.0
11.6
70.6
15.7
13.7
72.0
18.0
10.0
67.8
18.9
13.3
65.7
18.6
15.7
69.8
19.1
11.1
59.8
28.1
12.1
59.4
27.2
13.4
60.1
28.7
11.2
54.6
27.7
17.7
51.0
29.0
20.0
58.0
26.6
15.5
83.7
10.7
5.7
80.8
11.0
8.2
85.9
10.4
3.7
79.8
11.9
8.4
77.2
11.8
11.0
82.1
12.0
5.9
79.6
14.0
6.4
80.3
13.2
6.5
79.1
14.6
6.3
78.0
14.1
7.9
78.3
12.5
9.2
77.8
15.5
6.7
64.4
18.1
17.5
61.6
19.9
18.5
66.6
16.7
16.7
61.5
16.7
21.8
59.0
14.8
26.2
63.8
18.5
17.7
6 465
1 800
4 665
8 432
2 902
5 530
* Weighted averages and percentages
Source: Reference 5
salud pública de méxico / vol. 57, suplemento 1 de 2015
S85
Wong R y col.
Artículo especial
Regarding chronic health conditions, the prevalence
reported in Ensanut was close to that obtained with
the MHAS for diabetes, heart attack, and stroke. The
most noticeable difference was hypertension, which
was almost 11% age points higher for adults aged
50 to 59 years in Ensanut and 17 percentage points
higher among adults 60 years and older in Ensanut
compared to MHAS. The employment status statistics also differed across studies; both studies showed
similar percentages of older adults currently working,
but larger differences for other categories: household
work, doesn’t work, and other. Finally, the results for
BMI measures were quite similar across the two studies. The mean BMI for the younger cohort in Ensanut
was 29.5 (standard deviation 5.4) compared to 27.8
(standard deviation 4.9) in MHAS. For the older age
group, the mean BMI was 26.9 in MHAS compared to
27.9 in Ensanut. In terms of average weight and height,
the two studies yielded close measures. For example,
average weight for MHAS (ages 50-59) was 71.7 kilos
compared to 73.1 kilos in Ensanut. Regarding these
comparisons, it is important to note that height and
Table IV
MHAS 2012 external survey validation: comparisons with Ensanut 2012. Mexico
Ensanut 2012
MHAS 2012*
50-59
%, Mean (SD)
60+
%, Mean (SD)
50-59
%, Mean (SD)
60+
%, Mean (SD)
Health conditions
Diabetes
Hypertension
Heart attack
Stroke
16.57
14.47
1.80
1.74
21.83
22.5
4.08
2.63
19.24
25.45
2.22
1.97
24.23
39.85
5.22
3.65
Health behaviors
Current smoker
21.07
14.83
21.76
12.21
27.83 (4.86)
0.36
28.29
43.32
28.03
71.69 (13.59)
160.64 (9.20)
26.86 (4.92)
2.19
35.19
41.12
21.51
68.12 (13.62)
159.28 (9.88)
29.48 (5.41)
0.52
18.24
42.33
38.91
73.07 (14.63)
157.36 (9.22)
27.93(5.09)
1.5
28.2
40.2
30.0
66.60 (14.36)
154.48 (9.88)
85.39
31.13
10.68
32.98
2.35
4.10
2.93
15.83
88.32
36.00
11.58
31.04
1.98
2.92
1.84
14.65
79.6
35.22
9.99
31.68
1.4
0.49
0.60
20.4
83.42
40.82
10.18
29.81
1.53
0.32
0.59
16.58
58.25
1.75
27.55
6.40
6.05
4 702
30.55
0.78
30.62
30.94
7.11
10 195
56.01
2.8
32.12
5.1
3.97
6 813
25.98
1.31
39.32
16.93
16.46
8 894
Anthropometrics‡
Body mass index (BMI)
Underweight
Normal weight
Overweight
Obese
Weight (kg)
Height (cm)
Health insurance
Seguro social (IMSS)
ISSSTE/ State ISSSTE
Seguro Popular
Pemex/Sedena/Semar
Private medical insurance
Other
None
Employment
Currently works
Is looking for job
Household work
Doesn’t work
Other
Total sample (n)
* Weighted averages and percentages
The BMI results for MHAS are based on self-reported height and weight, while the Ensanut indicators are based on objective measurements of height and
weight
‡
Source: References 5 and 15
ISSSTE: Instituto de Seguridad y Servicios Sociales de los Trabajadores del Estado
IMSS: Instituto Mexicano del Seguro Social
S86
salud pública de méxico / vol. 57, suplemento 1 de 2015
Progression of aging in Mexico
weight measures were self-reported in MHAS and
objective measures used in Ensanut.
In addition, the external validation exercise included
a comparison of the MHAS 2012 with the 2010 Census
(results not shown). The exercise focused on gender,
age, and marital status statistics. Overall we found no
major discrepancies. For example, for Mexican adults
aged 60 and older, while according to the Census 53.5%
of the population was female, the percentage is 54.9 in
the MHAS. Also, the mean age was 69.9 in the MHAS,
while in the Census the mean was 70.8. Finally, regarding
marital status, the MHAS reported that 64.1% were married or in union versus 59.6% in the Census. Some of these
differences could be explained by the 2-year difference
between the collection of the Census data and the MHAS.
Objective markers sub-sample
Most health conditions in the survey are measured with
self-reports from the respondents. However, limited contact with the health system could lead to under-detection
and under-report of major chronic conditions and could
therefore influence self-report.26 Thus, for MHAS 2012, a
sub-sample was selected for additional data collection to
foster research that takes into account the possible bias
introduced by self-reports.
The objective markers collected included anthropometric measures (weight, height, waist, hip and calf
circumference, knee length), timed one-leg stands,
blood pressure readings, and performance tests (grip
strength and timed walk). Blood samples were taken
to obtain the following biomarkers with venous blood:
C-reactive protein (CRP), a biomarker related to immune system function, a common marker of inflammation and infection; total and high-density lipoprotein
(HDL) cholesterol, recognized risk factors for cardiovascular disease; thyroid-stimulating hormone (TSH),
a biomarker used to diagnose a thyroid disorder; and
vitamin D, a common antioxidant. In addition, markers
of anemia and diabetes –hemoglobin and glycosylated
hemoglobin (HbA1c) tests– were completed with capillary blood. The combination of the anthropometric
measures such as waist to hip ratios, and biomarkers,
including glucose, blood pressure and lipids, will help
researchers assess the extent to which this population
has metabolic syndrome. Also, some biomarkers, such
as CRP, in combination with anthropometric assessment, such as leg length, can be used to assess the
validity of conjectures linking early exposure and adult
disease. These biomarkers were selected because they
addressed important research concerns for the Mexican
population and because the blood tests require no fasting and are stable tests given that the blood samples
salud pública de méxico / vol. 57, suplemento 1 de 2015
Artículo especial
were obtained in households distributed across urban
and rural areas.
The sub-sample was limited to four states to maximize the standardization of collection procedures. The
sub-sample included the full sample of completed direct
interviews in four selected states (n=2 086), including
a relatively poor state, a highly urban state, a high USmigration state and a high-diabetes state. The health
visit for this sub-sample was completed by trained
INSP personnel about 1-2 weeks after the main MHAS
survey interview conducted by INEGI. The blood was
centrifuged, covered, and stored in special refrigeration containers, and shipped to the INSP laboratories
in Cuernavaca, Mexico.
Table V provides select results comparing the subsample for objective markers with the rest of the interviewed sample (including proxy interviews). In general,
the findings indicate no significant differences between
the two groups in demographic and health characteristics. However, while the mean age of the sub-sample
was 62.1 years, it was 64.7 for the rest of the sample; the
age difference was significant (p-value=0.000). Also, participants from the sub-sample were slightly more likely
to report fair or poor health compared to the rest of the
sample (63.3% compared to 61.2%, p-value=0.002). On
the other hand, the results did not indicate significant
gender or rural/urban location differences, or differences in main self-reported health conditions such as
diabetes, high blood pressure, or self-reported BMI.
Discussion
The MHAS is a national longitudinal study that includes
adults aged 50 and older, to examine the aging process
in populations that survived infectious diseases during
their childhood, with large socioeconomic disparities
and low institutional support over their life cycle.
Support of both the family and the social network are
particularly important for old-age security and care in
this context. Thus, databases that support these areas
of research provide valuable information to inform the
design of policies and to examine the impact of reforms
addressing the needs of the rapidly aging population
of countries like Mexico. With wave 1 as the baseline in
2001 and the completion of wave 3 in 2012, the MHAS
established itself as a powerful analytical tool, a longitudinal study of older adults that spans 11 years. The
study design follows a life course approach for the
study of health and its trajectory over time among older
adults, and now the analysis of mortality is statistically
powered in the MHAS as well. As with all longitudinal
studies, the losses to follow-up represent an important
limitation for researchers.27,28 Despite the relatively high
S87
Wong R y col.
Artículo especial
Table V
MHAS 2012 Characteristics of sub-sample
compared to the rest of the sample.* Mexico
Age
Gender
Male
Sub-sample‡ Rest of sample p-values§
%, Mean (SD) %, Mean (SD) %, Mean (SD)
62.13 (10.61) 64.67 (10.76)
0.000
43.47
45.35
56.53
54.65
Size of location
100 000+ people
52.70
46.58
15 000-99 999
2 500-14 999
11.36
11.54
15.00
14.43
<2 500
24.39
23.98
1.37
3.57
Very good
Good
Fair
3.05
32.27
51.66
4.59
30.65
49.04
Poor
11.65
12.14
17.96
18.97
0.213
Self-reported high blood pressure
Yes
17.07
18.50
0.148
Female
Self-reported health
Excellent
Self-reported diabetes
Yes
Body mass index
Self-reported
27.48 (4.93)
Measured (sub-sample only) 28.89 (5.28)
Total sample
2 086
0.077
0.748
Acknowledgments
-
-
The MHAS is supported by the National Institutes of
Health/National Institute on Aging (R01AG018016, R
Wong, PI) and by the INEGI in Mexico. The study is a
collaborative effort of the University of Texas Medical
Branch (UTMB), the Instituto Nacional de Estadística y
Geografía (INEGI, Mexico), the University of Wisconsin,
the Instituto Nacional de Geriatría (Inger, Mexico), and
the Instituto Nacional de Salud Pública (INSP, Mexico).
We appreciate the assistance of Dr. Brian Downer with
the analysis of the anthropometrics and biomarkers
sub-sample. We also appreciate the contributions of
Dr. Sarah Toombs with comments to an earlier version
of this article.
13 673
Declaration of conflict of interests. The authors declare that they have no
conflict of interests.
0.002
27.50 (5.02)
-
0.868
* Percentages, mean, and standard deviations are weighted statistics; sample
sizes may vary due to missing values
‡
Sub-sample refers to the sub-sample that was selected for objective
measures (anthropometrics, blood pressure, performance measures, and
blood samples).The rest of sample refers to those that were not selected
for objective measures
§
p-values indicate significance of the difference across the two sample groups
using Chi-squared tests for categorical variables and T-tests for continuous
variables
Source: Reference 5
response rates that the MHAS has enjoyed, researchers
using the data need to understand the consequences and
possible biases introduced by losses when conducting
longitudinal analyses with the MHAS. Another area to
consider is item non-response and the nature of the data
collection, based mostly on self-reports by the target
S88
individuals. In this regard, the sub-samples in which
objective measures were gathered in each wave of the
study have the main purpose of supporting methodological enquires about issues such as self-report, by
enabling the comparison of self-reported data with the
objective measures (anthropometric measures, performance tests, and blood samples). While the sub-samples
are not representative of the national population, they
enable studies of associations and covariates.
In conclusion, the MHAS 2012 wave, with the
companion 2001 and 2003 waves, offers a unique opportunity to examine the dynamics of aging in Mexico and
more generally in developing societies that are aging
fast, enabling cross-national comparisons with similar
studies such as the Health and Retirement Study in the
United States.*
References
1. Mirkin B, Weinberger M. The demography of population ageing. United
Nations Population Bulletin, special Issue Nos. 42/43, 2001. [online
document]. [accessed: October 2014]. Available at: http://www.un.org/esa/
population/publications/bulletin42_43/weinbergermirkin.pdf
2. Shamah-Levy T, Cuevas-Nasu L, Mundo-Rosas V, Morales-Ruán C,
Cervantes-Turrubiates L,Villalpando-Hernández S. Estado de salud y
nutrición de los adultos mayores en México: resultados de una encuesta
probabilística nacional. Salud Publica Mex 2008;50:383-389.
* The MHAS study databases and documentation can be accessed freeof-charge from the MHAS study website, a platform both in English
(www.mhasweb.org) and in Spanish (www.enasem.org). The website
is a user-friendly environment designed to enhance the usability of
the data files and enhance access to the study products, including a
searchable database of publications using MHAS data and a Discussion Forum for questions and answers from users of the data.5
salud pública de méxico / vol. 57, suplemento 1 de 2015
Progression of aging in Mexico
3. Palloni A, Pinto-Aguirre G, Pelaez M. Demographic and health conditions of ageing in Latin America and the Caribbean. Int J Epidemiol
2002;31:762-771.
4. Wong R, Palloni A. Aging in Mexico and Latin America. In: Uhlenberg
P, ed. International handbook of population aging. Netherlands: Springer,
2009:231-252.
5. MHAS. Mexican Health and Aging Study (MHAS) 2012 Data files
[online files]. December 2013 [accesed: October 2014]. Available at: www.
mhasweb.org
6. Sonnega A, Faul JD, Ofstedal MB, Langa KM, Phillips JWR, Weir DR.
Cohort profile: the Health and Retirement Study (HRS). Int J Epidemiol
2014;43:576-585.
7. Steptoe A, Breeze E, Banks J, Nazroo J. Cohort profile: the English Longitudinal Study of Ageing. Int J Epidemiol 2013;42:1640-1648.
8. Zhao Y, Hu Y, Smith JP, Strauss J, Yang G. Cohort profile: the China
Health and Retirement Longitudinal Study (CHARLS). Int J Epidemiol
2014;43:61-68.
9. Kearney PM, Cronin H, O’Regan C, Kamiya Y, Savva GM, Whelan B,
Kenny R. Cohort profile: the Irish Longitudinal Study on Ageing. Int J
Epidemiol 2011;40:877-884.
10. Wong R, Espinoza M, Palloni A. Mexican older adults with a wide
socioeconomic perspective: health and aging. Salud Publica Mex
2007;49:s436-s447.
11. Wong R, Michaels-Obregon A, Palloni A. Cohort profile: the Mexican
Health and Aging Study (MHAS). Int J Epidemiol. First published online:
January 27, 2005. doi: 10.1093/ijeldyu263
12. MHAS. Mexican Health and Aging Study (MHAS) 2012 - Sample
design [online document]. [Accessed: October, 2014]. Available at: http://
mhasweb.org/Resources/DOCUMENTS/2012/Methodological_Document_2012–SEC.pdf
13. Knaul FM, Frenk J. Health insurance in Mexico: achieving universal
coverage through structural reform. Health Aff 2005;24:1467-1476.
14. Instituto Nacional de Estadística y Geografía (Inegi) [online files].
Censo de Población y Vivienda 2010 [accessed: October 2014]. Available
at: http://www.inegi.org.mx.
15. Instituto Nacional de Salud Pública (INSP) [online files]. Encuesta Nacional de Salud y Nutrición 2012 [accessed: October 2014]. Available at:
http://ensanut.insp.mx.
salud pública de méxico / vol. 57, suplemento 1 de 2015
Artículo especial
16. Riosmena F, Wong R, Palloni A. Migration selection, protection and
acculturation in health: a binational perspective on older adults. Demography 2013;50:1039-1064.
17. Riosmena F, Gonzalez-Gonzalez C, Wong R. Recent returns from the
United States: health, wellbeing and vulnerability of older adults. Coyuntura Demografica 2012;2:63-67.
18. Pagan JA, Puig A, Soldo BJ. Health insurance coverage and the use of
preventive services. Health Econ 2007;12:1359-1369.
19. Wong R, Diaz JJ, Higgins M. Health care use among elderly Mexicans
in the United States and Mexico the role of health insurance. Res Aging
2006;28:393-408.
20. Wong R. La relación entre salud y nivel socioeconómico entre adultos
mayores: diferencias por género. En: Envejeciendo en la pobreza: género,
salud y calidad de vida. Mexico: INSP, 2003:97-122.
21. Katz S, Ford A, Moskowitz R, Jackson B, Jaffe M. Studies of illness in the
aged. The index of ADL: a standardized measure of biological and psychosocial function. JAMA 1963;185:914-919.
22. Avila-Funes JA, Gutierrez-Robledo LM, Ponce de Leon-Rosales S.Validity of height and weight self-report in Mexican adults: results from the
National Health and Aging Study. J Nutr Health Aging 2004;8:355-361.
23. Ruiz-Arregui L, Castillo-Martinez L, Orea-Tejeda A, Mejia-Arango S,
Miguel-Jaimes A. Prevalence of self-reported overweight-obesity and its
association with socioeconomic and health factors among older Mexican
adults. Salud Publica Mex 2007;49:s482-s487.
24. World Health Organization. Body mass index - BMI classification 2006
[online document]. [accessed: February, 2015]. Available at: http://apps.
who.int/bmi/index.jsp?introPage=intro_3.html
25. Wong R, Ostedal MB,Yount K, Agree EM. Unhealthy lifestyles among
older adults: exploring transitions in Mexico and the US. Eur J Ageing
2008;5:311-326.
26. Angel RJ, Angel JL, Hill TD. A comparison of the health of older Hispanics in the United States and Mexico methodological challenges. J Aging
Health 2008;20:3-31.
27. Ferraro KF, Kelley-Moore JA. A half century of longitudinal methods in
social gerontology: evidence of change in the journal. J Gerontol B Psychol
Sci Soc Sci 2003;58:s264-s270.
28. Marcellus L. Are we missing anything? Pursuing research on attrition.
Can J Nurs Res 2004;36:82-98.
S89
© Copyright 2026 ExpyDoc