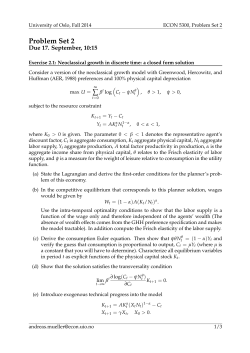
Improving Aggregate Removal from a
Monoclonal Antibody Feedstream Using
High-Resolution Cation Exchange Chromatography
Tech
Note
Paul Ng, PhD, Randy Jacinto, PhD, and Mark Snyder, PhD
Bio-Rad Laboratories, 2000 Alfred Nobel Drive, Hercules, CA 94547
Protein Purification
Bulletin 6439
Abstract
Nuvia™ HR-S Resin, a hydrophilic open-pore, high-resolution cation exchange (CEX) resin (media), was shown to reduce
aggregate content to <0.3% with >80% monomer recovery from a monoclonal antibody feedstream containing 8.9%
aggregates. In a side-by-side comparison with a high-resolution agarose-based resin, Nuvia HR-S showed comparable
aggregate removal but at significantly higher recovery levels. Furthermore, aggregate content and overall recovery were
shown to be functions of the conductivity of the elution buffer at the end of collection.
Introduction
Ever increasing performance demands in protein purification
require more selective chromatography methods to effectively
remove aggregates and other impurities. At high titer levels,
aggregates often present a unique purification challenge.
One emerging approach to address this challenge is the
use of new, smaller-particle chromatography resins that
are optimized for high resolution and capacity. Such resins
can be particularly productive in challenging situations and
during final polishing steps (He et al. 2010). Nuvia HR-S is
the latest member of this new class of high-resolution resins;
it features a hydrophilic polymer matrix with an open-pore
structure designed for fast and efficient mass transfer and
superior flow properties at high flow rates. Here, we compare
the performance of Nuvia HR-S to that of a high-resolution
agarose-based resin. We also describe the relationship
between elution buffer conductivity, monomer recovery,
and aggregate content.
Materials and Methods
Test solution
The test solution contained a mixture of aggregates and
monomers obtained from a purified monoclonal antibody
solution (mAb G). Aggregates were generated as follows:
500 µl 5 M NaCl and 1 ml 1 M glycine were added to 100 ml
of previously prepared mAb G solution in 5 mM Na phosphate,
pH 7.0. The pH was adjusted to 2.95 with 900 µl 1 M HCl. This
solution was held at 37°C for 20 min. The pH was then raised
to ~5.0 and sterile-filtered through a 0.22 µm membrane filter.
Column
Nuvia HR-S and an agarose-based resin (Resin 1) were
packed in a Bio-Scale™ MT2 Chromatography Column
(Bio-Rad Laboratories, Inc.) to give a final dimension of
7 x 56 mm (2.1 ml volume).
Chromatography system and protocol
Chromatography steps were carried out using the
BioLogic Duoflow™ Chromatography System (Bio-Rad
Laboratories, Inc.), which is capable of monitoring multiple
variables, including absorbance (A 280 /A260), conductivity,
pressure, and pH.
Aggregate removal conditions on the BioLogic Duoflow
Chromatography System:
Buffer A1: 40 mM Na acetate, pH 5
Solution A2: 1 M NaOH
Buffer B1: 40 mM Na acetate with 1 M NaCl, pH 5
Flow rate: 0.96 ml/min
Isocratic hold: 100% A1 (3 column volumes, CV)
Inject 20 ml aggregate and monomer mixture
Gradient: 0–100% B1 (20 CV)
Isocratic hold: 100% B1 (2 CV)
Isocratic hold: 100% A2 (5 CV)
Recovery calculation
Monomer recovery calculation was based on total absorbance
in the pool and the load and was normalized to the monomer
percentage in both.
Total A 280 in pool x % monomer in pool
Monomer recovery =
Total A280 in load x % monomer in load
Size exclusion chromatography (SEC)
Analytical SEC was performed with an Agilent Bio SEC-5
Column (Agilent Technologies, Inc.) at a flow rate of
0.35 ml/min on the BioLogic Duoflow Chromatography System.
Sterile-filtered PBS with 0.02% Na azide was used as the
equilibration buffer. Ten microliters of sample were injected into
the BioLogic Duoflow Chromatography System. Aggregates
were defined as the front eluting peak on the SEC profile.
Protein Purification
Results and Discussion
The in vitro generation of aggregates was designed to obtain a
final composition of ~10% aggregates. Several initial attempts
were made with varying ratios of monomeric to aggregated
antibody. A final ratio of 2.5 volumes of monomeric antibody
solution to 1 volume of aggregated antibody solution was
chosen to yield a composition with the following properties:
8
10
12
14
3
100
2
80
1.5
60
1
40
0.5
0
20
0
20
30
Conductivity, mS/cm
120
2.5
100
75
4
50
2
25
0
Conductivity, mS/cm
125
6
0
0 3060
Time, min
Fig. 3. Elution profiles of Nuvia HR-S (—) vs. Resin 1 (—) after optimization.
140
17 18 19 20 21 22
A loading level of 46 mg IgG/ml resin was employed to
challenge the binding capacity of Nuvia HR-S and Resin 1,
and aggregate clearance by each resin was evaluated.
A comparison of the elution profiles obtained from each
chromatography run using the conditions described in the
Materials and Methods section is shown in Figure 3.
As indicated by the absorbance profile, the chromatography
conditions resulted in a low yield for Resin 1 due to incomplete
binding during the loading phase. In contrast, Nuvia HR-S was
able to quantitatively retain the antibody before elution.
Absorbance units
During initial development, a protocol that deviated from that in
the Materials and Methods section was used. It involved a flow
rate of 2 ml/min and a gradient of 0–1 M NaCl in the running
buffer. As shown in Figure 1, there was considerable overlap
of the monomer and aggregate peaks (fractions (Fr) 17–22).
Depending on the fraction pooling method, monomer recovery of
66–81% was achieved with an aggregate content of 0.46–0.85%.
This observation is consistent with the premise that greater
recovery results in higher aggregate content. The quality of the
recovered pools (Figure 2) is shown in the overlay of the enlarged
front shoulders of each SEC profile. The results demonstrated
the feasibility of using Nuvia HR-S to separate aggregates from
the monomer and showed that the extent of residual aggregates
depended on the fractions included in the pool. Additionally, the
overlap of monomer and aggregates in the Nuvia HR-S elution
profile suggested that a lower flow rate and a shallower gradient
(0.1–0.4 M NaCl) could be beneficial.
Absorbance units
0
Comparison of Nuvia HR-S with a commercial small particle
size CEX resin
Initial separation of aggregate from monomer using Nuvia HR-S
10
0.0050
Fig. 2. SEC profiles of the load (—), selected pools (Fr 17+18+19+20) (—)
and (Fr 17+18+19) (—), and aggregated pool (Fr 21+22) (—).
A plot of log MW of six protein standards vs. their retention
times yielded a straight line (R2 = 0.96). Using this plot and
the retention times of the aggregates, the apparent MW of the
aggregate was calculated to be 386 kD.
0
0.0150
0.0100
Time, min
A280 = 6.3 or 4.56 mg/ml
pH = 4.91
Conductivity = 2.6 mS/cm
Aggregate = 8.9%
3.5
Absorbance units
0.0200
Preparation of aggregate and monomer test solution
Rather than subjectively determining the pertinent fractions,
a strategy was designed to measure the aggregate content
and the monomer recovery as fractions were progressively
pooled during elution. As shown in Figure 4, both resins show
an increase in aggregates as the pooling was extended to
increase monomer recovery. While Nuvia HR-S was able to
deliver a final aggregate content of <0.3% and a recovery of
>80%, Resin 1 recovered less than 70% of total monomer at
the same target aggregate content. This is due to the lower
binding capacity of Resin 1, as confirmed by the increase in its
absorbance during loading (Figure 3).
Time, min
Fig. 1. Separation of aggregates from monomer by Nuvia HR-S before
optimization.
© 2014 Bio-Rad Laboratories, Inc.
Bulletin 6439
Protein Purification
Actual by Predicted Plot
90
1.2
0.8
0.4
0
0 10 20 30 40 50 60 70 80 90100
Monomer recovery, %
Fig. 4. Performance of Nuvia HR-S ( ) vs. Resin 1 ( ).
70
Monomer recovery, % actual
Aggregate, %
1.6
50
30
Correlation between monomer recovery, aggregate content,
and target conductivity
Aggregate, %
As depicted in Figure 4, aggregate recovery increases with
increasing monomer recovery. In the Nuvia HR-S gradient
elution, conductivity of the last fraction added to the pool
was determined as the cutoff target of the pool. As shown,
recovery is a function of the acceptable aggregate percentage
and the target conductivity (Figure 5). Using the Fit Model
function in JMP Software (SAS Institute Inc.), recovery could
be correlated to those two measurements. A summary of
actual and predicted data is shown in Figure 6.
-10
-20
0
20
40
60
80
100
120
Monomer recovery, % predicted
P = 0.0154, REq = 0.94, RMSE = 12.508
Summary of Fit
R2
0.938098
R2 adj
0.89683
Root mean square error
12.50828
Mean of response
59.78333
Observations (or sum wgts)
6
0.5
Fig. 6. Fit model of monomer recovery on Nuvia HR-S.
0.4
The model yielded excellent correlation (R2 = 0.94). This finding
confirms the need to determine conductivity for elution so that
both recovery and aggregate levels are within acceptable limits.
0.3
0.2
Conclusion
The data presented here demonstrate that Nuvia HR-S
High-Resolution Cation Exchange Resin effectively clears
aggregates from an antibody feedstream with high initial
aggregate content. In addition, Nuvia HR-S provides
significantly higher percent recovery than a comparable
agarose-based small-particle CEX resin. Finally, aggregate
removal and final recovery are shown to be functions of buffer
conductivity measured at the end of eluate collection.
0.1
0
-0.1
35
Conductivity limit, mS/cm
10
30
References
25
He X et al. (2010) Nuvia S Media. BioProcess International 8, 59–61.
20
15
0102030405060708090
Monomer recovery, %
Fig. 5. Scatter plot matrix of aggregate content or conductivity
vs. monomer recovery on Nuvia HR-S.
© 2014 Bio-Rad Laboratories, Inc.
Bulletin 6439
JMP is a trademark of SAS Institute, Inc.
Bio-Rad
Laboratories, Inc.
Web site www.bio-rad.com USA 800 424 6723 Australia 61 2 9914 2800 Austria 01 877 89 01 Belgium 09 385 55 11 Brazil 55 11 3065 7550
Canada 905 364 3435 China 86 21 6169 8500 Czech Republic 420 241 430 532 Denmark 44 52 10 00 Finland 09 804 22 00
France 01 47 95 69 65 Germany 089 31 884 0 Greece 30 210 9532 220 Hong Kong 852 2789 3300 Hungary 36 1 459 6100 India 91 124 4029300
Israel 03 963 6050 Italy 39 02 216091 Japan 81 3 6361 7000 Korea 82 2 3473 4460 Mexico 52 555 488 7670 The Netherlands 0318 540666
New Zealand 64 9 415 2280 Norway 23 38 41 30 Poland 48 22 331 99 99 Portugal 351 21 472 7700 Russia 7 495 721 14 04
Singapore 65 6415 3188 South Africa 27 861 246 723 Spain 34 91 590 5200 Sweden 08 555 12700 Switzerland 026 674 55 05
Taiwan 886 2 2578 7189 Thailand 1800 88 22 88 United Kingdom 020 8328 2000
Life Science
Group
Bulletin 6439 Rev B
US/EG
14-1602
1014
Sig 1213
© Copyright 2026 ExpyDoc