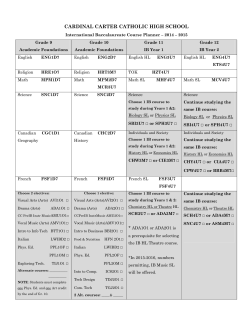
REPORT TO: BLYTH AREA BOARD REF: 14/04/8.3 FROM: Paul Harrison, Director of Corporate Services DATE: 23 April 2014 ACTION: DISCUSSION AGENDA ITEM: 8.3 CONFIDENTIAL: No CIRCULATION RESTRICTIONS: None TITLE: Tenant Satisfaction Survey – Summary of Blyth Valley Results. SUMMARY: This report summarises the results of a 2014 Tenant Satisfaction Survey, isolating those results that relate solely to the Blyth Valley Area. RECOMMENDATION: 1. Members are requested to note and discuss the report. APPENDICES: CONTACT: Appendix A: How to Read the Survey Results Paul Harrison, Director of Corporate Services Direct line: 01670 622869 Mobile: 07946 374777 Direct email: [email protected] IMPLICATIONS: CONSULTATION AND BENEFITS TO CUSTOMERS: ENVIRONMENTAL: This report presents the results of a tenant survey. The results will enable us to improve services to customers. The full satisfaction report includes a section on customer views on their neighbourhoods. EQUALITIES/DIVERSITY: The full satisfaction report includes an analysis of respondent profiles and analyses the results by different groups, such as age, disability, sexual orientation, etc. FINANCE AND VFM: Following an analysis of the full report, HfN may consider moving resources, financial and human, between services or between geographical areas to address shortfalls in Board: Blyth Area Board – 23 April 2014 Item No: 8.3 Report Title: Tenant Satisfaction Survey – Summary of Blyth Valley Results Report by: Paul Harrison, Director of Corporate Services HEALTH & SAFETY: LEGAL: PERSONNEL: RISK: CORPORATE OBJECTIVES: performance. None specifically arising from this report. None specifically arising from this report. Following an analysis of the full report, HfN may consider moving resources, financial and human, between services or between geographical areas to address shortfalls in performance. The Corporate Risk Register flags the maintenance of core services as a key risk associated with diversification. The intelligence gathered through the Tenant Satisfaction Survey will assist HfN to identify failing performance. We will deliver improving services We will be a well-run and cost effective business We will empower tenants We will build a stronger future 1. 1.1. PURPOSE This report summarises the results of a recent Tenant Satisfaction Survey focussing specifically on those that relate specifically to the Blyth Valley Area. 2. REPORT Background 2.1. Homes for Northumberland (HfN) commissioned ARP Research to undertake a Tenant Satisfaction Survey using a standardised methodology which allows responses to be compared across housing providers. In total, 3,196 tenants took part in the survey (including approximately 2,400 from the Blyth Valley area). This represents a 38% response rate across both Blyth and Alnwick. The scale of the survey was sufficiently large for the results to be statistically significant. 2.2. ARP’s full report reflects on the results of a 2009 survey which serve to illustrate the way that tenant satisfaction with services has changed over the past five years. 2.3. The presentation of the results in the report is complex. Appendix A illustrates how the results should be read. 2.4. The full report will be presented to the Strategic Board in May/June and will be made available in full to Area Board members after that. 2.5. The responses to some of the questions in the survey have been analysed separately for the Blyth Valley and Alnwick Areas. These questions relate to: Overall satisfaction with HfN services; Satisfaction with repairs and maintenance; and Information and involvement. 2.6. This report presents the highlight results of the survey for the Blyth Valley Area. Board: Blyth Area Board – 23 April 2014 Item No: 8.3 Report Title: Tenant Satisfaction Survey – Summary of Blyth Valley Results Report by: Paul Harrison, Director of Corporate Services Overall Satisfaction with HfN services 2.7. The chart below shows the headline overall satisfaction rating for Blyth Valley tenants: 2.8. In summary: 89% of respondents were satisfied with the service provided by HfN; This puts HfN in the top 25% of benchmarked housing providers; The benchmark median score was 87%; HfN’s 2014 (89%) result is significantly better than that from 2009 (84%). Satisfaction with Repairs and Maintenance 2.9. The chart below shows the satisfaction with repairs and maintenance for Blyth Valley tenants: 2.10. In summary: 84% of respondents were satisfied with the repairs and maintenance service provided by HfN; This puts HfN in the bottom 50% of benchmarked housing providers; The benchmark median score was 84%; HfN’s 2014 (84%) result is significantly worse than that from 2009 (86%). Board: Blyth Area Board – 23 April 2014 Item No: 8.3 Report Title: Tenant Satisfaction Survey – Summary of Blyth Valley Results Report by: Paul Harrison, Director of Corporate Services Information and Involvement 2.11. The chart below shows Blyth Valley tenants’ satisfaction with the provision of information by HfN (specifically “being informed about the things that affect you”): 2.12. In summary: 81% of respondents were satisfied with the way they were kept informed by HfN; This puts HfN in the top 50% of benchmarked housing providers; The benchmark median score was 81%; HfN’s 2014 (81%) result is not significantly different to that from 2009 (83%). 2.13. The chart below shows Blyth Valley tenants’ satisfaction with the way HfN listens to their views: 2.14. In summary: 73% of respondents were satisfied with the way their views were listened to by HfN; This puts HfN in the top 25% of benchmarked housing providers; The benchmark median score was 68%; HfN’s 2014 (73%) result is significantly better than that from 2009 (63%). Next Steps 2.15. Overall, the results of the survey are very positive. In particular, the overall satisfaction (including Blyth and Alnwick) with the services provided by HfN is up from 79% in 2009 to 88% in 2014. This puts HfN in the top 50% of benchmarked providers. However, the detail in the survey has highlighted areas in which we Board: Blyth Area Board – 23 April 2014 Item No: 8.3 Report Title: Tenant Satisfaction Survey – Summary of Blyth Valley Results Report by: Paul Harrison, Director of Corporate Services need to improve performance. As reported above, these include repairs and maintenance in the Blyth Valley Area where HfN is in the bottom 50% of providers. HfN’s Customer Insight Team will use the detail in the report to drill down into areas of underperformance to identify specific concerns that can be remedied in order to improve satisfaction for the next survey which is due to be conducted in two years’ time. 3. 3.1. CONCLUSION Members are requested to note and discuss the report. APPENDIX A – How to Read the Survey Results Number of tenants answering this question – this is the base number for calculating percentages Aggregate percentage either fairly or very satisfied in 2014 survey Aggregate percentage of 2014 respondents who are either fairly or very satisfied Percentage response in each response category This upward-pointing triangle indicates that the 2014 result is significantly better than the 2009 result The error margin represents the amount by which the result could vary due to chance: in this case, the error margin indicates that the true 2014 result could actually lie at any point between 86.8% and 89.2% 87% is the median result for all of the benchmarked housing providers. This means that half of the businesses in the benchmarked group scored over 87% and half lower than 87%. Benchmark results from other housing providers are ranked into four categories referred to as quartiles. nd This result (2 ) for HfN would fall into the second quartile (first is best) meaning that HfN’s result is worse than the top 25% of providers but better than the bottom 50%.
© Copyright 2026 ExpyDoc