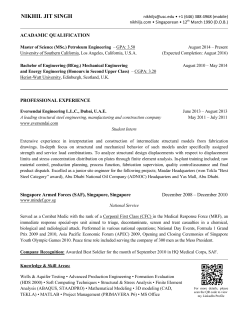
l Equity Research l Singapore l Real Estate Investment Trusts l 16 July 2014 Singapore REITs Closer regulation of industrial REITs to further raise vacancy rates Industrial REITs are now required to lease 70% of each JTC leased property to approved tenants, from 50%. We spoke with industrial REITs to assess the impact, as 6-100% of their assets are on JTC allocated land. We expect the new rule to raise REITs’ vacancy rates, and AREIT and CREIT to be the most vulnerable, in our view. Industrial REITs operate in a sector as tightly regulated as the residential sector, in our view. We reiterate our ACT call to underweight industrial REITs. In July 2014, JTC revised its policy to require industrial REITs to lease 70% (from 50% currently) of the GFA of each JTC property to qualified anchor tenants. Anchor tenants have to satisfy JTC’s criteria on value-add, skills and remuneration per worker and a minimum size of 1,500sqm. Industrial REITs have until end-2017 to comply, but no new leases can be signed at assets where anchor tenants take up less than 70% of GFA. Some REITs have reported higher vacancy rates due to difficulties in meeting JTC’s criteria. Industrial sector as regulated as residential JTC allocates land at significant discounts to companies in sectors that the government wants to promote. We estimate that 6-100% of industrial REITs’ assets are on JTC allocated land and have to comply with current and future JTC regulation. Industrial capital values have doubled since 2009. Since 2011, the government has introduced measures to curb industrial rents and prices every three-to-six months, including restrictions on strata subdivision, stamp duties and shorter land tenure. We expect further regulation until prices fall. Portfolio breakdown by valuation – land ownership JTC Private Others 100% The bulk of industrial REITs’ portfolios are on JTC land 80% % of valuation JTC tightens policy on industrial leasing 60% 99% 40% 75% 72% 68% 63% 20% 36% 6% 0% CACHE CREIT AREIT AAREIT VIT MLT MINT Source: Companies, Standard Chartered Research Industrial REITs’ expected portfolio occupancy rates 100% 98% 96% 94% 92% 90% 88% 86% The bottom line Due to tighter regulation, average occupancy rates for REITs’ non-logistics assets have declined 10-12ppt since 2011. We expect occupancies to fall another 5-10ppt in 2014-16 due to the new rules. We expect AREIT and CREIT to be the most vulnerable and we lower our valuations by 2.9% and 1.5%, respectively. We reiterate our ACT call to overweight office REITs and underweight industrial REITs, as we expect (1) industrial rents to fall 11-22% in 2014-16 due to high supply and low demand; (2) rising industrial vacancy rates as singleleases are converted to multi-tenancies on expiry; (3) poor 84% AAREIT CREIT CACHE 82% AREIT MINT MLT 80% 2011 2012 2013 2014E 2015E 2016E 2017E Source: Companies, Standard Chartered Research estimates Did you know… New measures to curb industrial rents and prices have been introduced every threeto-six months since 2011? quality acquisitions at lower yields; and (4) leasing restrictions by JTC. Regina Lim Meenal Kumar Kai Yip Chaw Meng Tan +65 6596 8502 Equity Research Standard Chartered Bank, Singapore Branch +65 6596 8507 Equity Research Standard Chartered Bank, Singapore Branch +65 6596 8506 Equity Research Standard Chartered Bank, Singapore Branch +65 6596 4440 Equity Research Standard Chartered Bank, Singapore Branch Important disclosures can be found in the Disclosures Appendix All rights reserved. Standard Chartered Bank 2014 http://research.standardchartered.com Equity Research l Singapore REITs Impact of latest policy change on industrial REITs We spoke to each manager of the industrial REITs under our coverage over the past week on the implications of the latest policy change by JTC. We also consulted policy makers and property consultants on the issue. Based on the information gathered, we assume that 100% of business park assets on JTC land will be affected by JTC regulations, and 50% of high-tech and light industrial properties on JTC land could be affected by JTC regulations. Based on asset type, share of assets with JTC leases and average tenant size, we expect AREIT and CREIT to be impacted the most and we cut our valuations for these REITs by 2.9% and 1.5%, respectively. We maintain our PT for CREIT at 1.0x P/NAV, as we continue to see the possibility for a change in management or fee structure due to the high free float and low manager stake. Figure 1: Changes to our valuations Price (SGD) Mkt cap Old (SGD PT mn) (SGD) New PT % (SGD) change Up/ Down to PT Rating 2014E DPU yield NAV/ unit (SGD) P/NAV (x) Industrial REITs Ticker Ascendas REIT AREIT SP 2.32 5,577 2.04 1.98 -2.9% -14.7% UP 6.4% 1.98 1.17 Mapletree Logistics Trust MLT SP 1.16 2,850 1.11 1.11 0.0% -4.3% UP 6.4% 0.95 1.22 Mapletree Industrial Trust MINT SP 1.43 2,431 1.44 1.44 0.0% 1.1% UP 6.7% 1.20 1.19 Cambridge Industrial Trust CREIT SP 0.76 954 0.69 0.69 0.0% -9.2% UP 6.8% 0.69 1.10 Cache Logistics Trust CACHE SP 1.23 954 1.06 1.06 0.0% -13.5% UP 7.1% 0.98 1.25 AIMS-AMP Capital Industrial REIT AAREIT SP 1.45 901 1.39 1.38 -0.7% -4.8% IL 7.3% 1.47 0.99 Viva Industrial Trust 0.80 477 0.69 0.69 0.0% -13.8% UP 8.9% 0.76 1.06 VIT SP Prices as of 15 July 2014. Source: Bloomberg, Standard Chartered Research estimates We reiterate our ACT call to sell industrial REITs, as we expect (1) Rents to fall 11-22% in 2014-16 due to high supply and low demand: For business parks, supply is expected to rise 9% p.a. in 2014-16, compared to historical demand of 5-6% p.a. We expect the business park vacancy rate to rise to 24% from 16% and rents to fall 8% p.a. in this period. Business parks contribute 40% of AREIT’s earnings. (2) Rising vacancy rates as single-leases are converted to multi-tenancies on expiry: Industrial REITs have reported rising portfolio vacancy rates, as assets with single leases are converted to multi-tenancies on lease expiry and we estimate that the underlying occupancy of single leases is c.80%. Over the past three years, AREIT’s portfolio vacancy rate has risen to 11% from 4% as the proportion of single leases in the portfolio fell to 30% from 44%. We expect vacancy rates to rise as this trend continues. (3) More poor quality acquisitions at lower yields: Industrial REITs have taken on more risks in the past six months by buying lower quality assets. 37% of assets bought in the past 12 months had occupancies below 85% and the average acquisition yield has fallen to 5.9% from 7.8% a year ago. On 30 June 2014, AREIT bought its first Singapore asset with income support, which boosted NPI yield to 6.98% from 5.9%. (4) More regulation for the industrial sector until prices decline: Since 2011, the government has introduced measures to curb industrial rents and prices every threeto-six months, including restrictions on strata subdivision, stamp duties and shorter land tenure. We expect further regulation until prices fall. 16 July 2014 2 Equity Research l Singapore REITs Figure 2: Industrial REITs’ expected occupancy rates AAREIT CREIT CACHE AREIT MINT MLT 100% 98% 96% 94% 92% 90% 88% 86% 84% 82% 80% 2011 2012 2013 2014E 2015E 2016E 2017E Source: Companies, Standard Chartered Research estimates Impact of latest policy change on industrial REITs Properties on JTC allocated land make up 6-100% of industrial REITs’ portfolios: Among the industrial REITs, CACHE, CREIT and AREIT have the highest proportion of assets on JTC land. Of these, some sites were directly allocated by JTC to end-users, who subsequently sold the properties to REITs. These have to comply with the latest requirements on leasing to qualified anchor tenants, as well as any future JTC policies that may be imposed. Some properties on JTC land were sold through open tenders with no restrictions on specific uses. These will not be subject to detailed JTC regulations. For MINT, we have excluded the ready-built factories acquired from JTC. Figure 3: Portfolio breakdown by valuation – by land ownership JTC 100% Private Others 90% 80% % of valuation 70% 60% 50% 99% 40% 75% 72% 30% 68% 63% 20% 36% 10% 6% 0% CACHE CREIT AREIT AAREIT VIT MLT MINT * For MINT, we have excluded the ready-built factories from the JTC category. Source: Companies, Standard Chartered Research Logistics least affected, business parks most affected: Logistics tenants are likely to be least affected, in our view, as they generally take up over 1,500 sqm. On the other hand, business parks are likely to be the most affected, given that land for these properties tend to be directly allocated by JTC and are subject to JTC regulation. Ready-built factories owned by MINT were sold on a multitenanted basis and will not be subject to JTC lessee rules. 16 July 2014 3 Equity Research l Singapore REITs Figure 4: Portfolio breakdown by valuation – by property type Business park Hi-tech Industrial Factories/light industrial Logistics/warehouse Others 100% 90% 80% 39% % of valuation 41% 14% 70% 60% 13% 21% 64% 51% 4% 26% 50% 100% 100% CACHE MLT 40% 30% 57% 20% 19% 59% 39% 10% 9% 27% 17% 0% VIT AREIT MINT CREIT AAREIT * Not under our coverage Source: Companies, Standard Chartered Research A slew of measures to cool industrial prices Since 2009, industrial capital values have risen 100%, faster than the rise in hotel, residential, office and retail capital values that rose 90%, 63%, 38% and 20%, respectively. As the government sought to cool the residential market from 2010, investors bought strata-titled industrial spaces. Primary sale of industrial spaces below 200sqm rose 3.5x in 2011-12 from 2010 levels, while prices rose 67% to SGD 424psf in the same period. Figure 5: Primary sale of industrial space below 200sqm Figure 6: Prices of industrial spaces SGDpsf 800 600 700 500 600 400 500 SGD psf 700 300 200 <100sm 100-200sm Overall 400 300 200 100 100 1Q08 2Q08 3Q08 4Q08 1Q09 2Q09 3Q09 4Q09 1Q10 2Q10 3Q10 4Q10 1Q11 2Q11 3Q11 4Q11 1Q12 2Q12 3Q12 4Q12 1Q13 2Q13 3Q13 4Q13 1Q14 2Q14 0 Source: Urban Redevelopment Authority, Standard Chartered Research 0 1Q08 3Q09 1Q11 3Q12 1Q14 Source: Urban Redevelopment Authority, Standard Chartered Research The government sought to cool the industrial market with a slew of measures, including restrictions on strata subdivision, shorter land tenure, seller stamp duties and longer minimum occupation periods before asset sales. 16 July 2014 4 Equity Research l Singapore REITs Figure 7: Policy measures to regulate industrial properties in Singapore Date Policy Feb-09 Due to the recession, JTC lifts 50% cap on subletting till Dec 2011 Dec-09 Government land sales of industrial land via confirmed list resumed in 1H10 as economy recovers Dec-11 JTC reinstates 50% cap on subletting For multi-user developments, the GFA in a single unit shall not be less than 150 sqm. Minimum requirements are imposed for good lifts and loading bays Strata subdivision of development is not allowed for the first 10 years after completion for selected Govt land sale sites near MRT stations. Upon expiry of the first 10-year period, the GFA in a single strata unit should not be less than 150 sqm Mar-12 Developers have to provide information on type of development and allowable use of industrial property in the sale and purchase agreement to ensure buyers awareness Jun-12 All industrial government land sale sites will have land tenure of a maximum term of 30 years, down from 60 years Jan-13 REITs have to pay land premium upfront upon acquisition of industrial properties, instead of an annual land rent Jan-13 Seller's stamp duty of 15%/10%/5% will be imposed on all industrial properties sold within 1/2/3 years of purchase Apr-13 Minimum GFA for a JTC anchor tenant reduced to 1,500sqm from 3,000sqm. Anchor tenants are still required to meet JTC's criteria on operating income, profit margins, proportion of skilled employees and R&D expenditure Jul-13 JTC introduces Small Footprint Standard Factory, aimed at small and medium enterprises. These have a smaller footprint with GFA from 700sqm to 1,400sqm and lower rental costs Nov-13 Industrialists can sell JTC properties to third parties such as REITs only 5 years after completion, from 3 years previously JTC anchor tenants have to continue to operate for 5 years after a sale and lease back transaction, up from 3 years previously Jul-14 REITs are required to lease 70% of GFA to qualified anchor tenants, up from 50% previously Source: JTC, Standard Chartered Research Since regulations on the use of industrial properties were tightened from 2011, the average occupancy rate of REITs’ non-logistics assets fell 10-12ppt. Figure 8: Occupancy rate of AREIT assets Light Industrial Business & Science Parks 100% Logistics & Distribution Hi-Tech Properties 98% 96% 94% 92% 90% 88% 86% 84% 82% 80% YE Mar 10 YE Mar 11 YE Mar 12 YE Mar 13 YE Mar 14 Source: Company, Standard Chartered Research 16 July 2014 5 Equity Research l Singapore REITs Latest JTC policy change indicates how detailed regulation can affect industrial REITs JTC, Singapore’s government agency for the industrial sector, announced a revision to its subletting policies for industrial properties on 2 July 2014. For third-party providers such as REITs, anchor tenants (meeting JTC requirements and occupying at least 1,500sqm of space) must now occupy a minimum aggregate 70% of GFA, from 50% previously. End-user lessees building new premises on JTC land can still sublet up to 50% of their space within five years of completion, but only 30% thereafter. The policy takes effect from 1 October 2014 with a grace period of three years. Figure 9: JTC’s revised subletting policy with effect from 1 October 2014 Affected parties Current policy Revised policy with effect from 1 October 2014 End-user lessees Can sublet up to 50% of GFA to non-related companies within five years after obtaining TOP, and up to 30% thereafter Can sublet up to 50% of GFA per allocation upon Temporary Occupation Permit (TOP), to non-related companies Third-party Can sublet up to 50% of GFA per allocation to non-anchor facility subtenants providers (such as REITs) Must sublet at least 50% of GFA per allocation to anchor subtenants JTC’s Tenants Can sublet up to 50% of GFA per allocation to non-anchor subtenants within five years after obtaining TOP, and up to 30% thereafter Must sublet at least 50% of GFA to anchor subtenants within five years from obtaining TOP, and 70% thereafter No minimum occupation period for subsequent anchor subtenants Minimum occupation period of three years for subsequent anchor subtenants Can sublet up to 50% of GFA to non-related companies Not allowed to sublet Note: All subletting applications are subject to JTC's consent. Source: JTC JTC allocates land to companies at a significant discount to market prices to promote selected industries that the government is targeting. To qualify for land allocation, JTC assesses the industrialist’s operating income, profit margins, proportion of skilled and unskilled employees and R&D expenditure. REITs that buy properties from industrialists have to continue to comply with current and any future regulations that JTC imposes. Our channel checks with REIT managers indicate that JTC’s qualitative requirements are not transparent. Some REITs have faced higher vacancy rates due to difficulties in meeting JTC’s criteria. We expect industrial REITs to take time to adjust their existing tenant compositions from the current 50% minimum anchor tenant requirement, to the new 70% minimum. We believe industrial landlords could face difficulties in maintaining occupancy rates at these properties given: Landlords will have to compete to secure such anchor tenants, which need to take up at least 1,500sqm of space and meet JTC requirements, to reach the 70% minimum requirement within the three-year grace period. This is challenging as we expect an oversupply of industrial space in the next few years. For current vacancies at properties that have not met the 70% requirement and existing anchor tenants’ whose leases are expiring, landlords will have to be more selective when signing new leases as they will not able to sign new smaller tenants until they meet the anchor tenant requirements. For properties that have already met JTC’s minimum requirement, landlords could potentially seek larger, quality tenants, to have a buffer above the 70% requirement. 16 July 2014 6 Equity Research l Singapore REITs Industrial rents have started to fall The government cut its posted industrial land rents and prices by 5% h/h on 1 July 2014, in line with falling market rents. As of May, business park and factory rents had fallen 2-3% q/q. This is in line with our forecasts for factory rents to decline 11% and business park rents to fall 22% over 2014-16. We expect business park supply to grow 9% p.a. amid weak demand. On our estimates, the average business park occupancy rate could fall to 76%, from 84% in 2013. Forty percent of AREIT’s portfolio is made up of business parks. Figure 10: Industrial rent forecasts Multi-user factory vacancy rate Multi-user factory rents % ch Business park vacancy Business park rents 2008 9.0% 1.80 2009 11.7% 2010 2011 Warehouse vacancy Warehouse % ch rate rents 28% 6.2% 4.27 64% 7.2% 1.64 0% 1.62 -10% 19.2% 3.33 -22% 10.0% 1.38 -16% 10.3% 1.74 7% 24.5% 3.60 8% 8.6% 1.63 18% 9.2% 1.90 9% 17.2% 3.90 8% 5.7% 1.85 13% 2012 9.7% 2.00 5% 19.1% 3.81 -2% 7.1% 1.85 0% 2013 11.4% 1.98 -1% 15.9% 3.85 1% 9.2% 1.95 5% % chg. 2014E 12.2% 1.90 -4% 17.6% 3.55 -8% 11.8% 1.85 -5% 2015E 12.7% 1.84 -3% 21.9% 3.25 -8% 12.2% 1.76 -5% 2016E 12.8% 1.76 -4% 24.2% 3.00 -8% 13.0% 1.67 -5% Source: CBRE, Urban Redevelopment Authority, Standard Chartered Research estimates Over the past 12 months, vacancy rates in industrial REITs’ portfolios have increased sharply. In AREIT and MINT’s portfolios, business park vacancy rates have risen to 18-21%, from 7-8%, while high-tech vacancy rates have climbed to 18-25%, from 515%. Figure 11: AREIT assets’ occupancy rates Business & science parks Hi-Specs industrial 96% Figure 12: MINT assets’ occupancy rates Business park Stack-up/ramp-up Light industrial Logistics & distribution centre Light industrial Flatted factories Hi-tech 100% 94% 92% 90% 90% 88% 86% 80% 84% 82% 80% 70% 31-Mar-13 30-Jun-13 30-Sep-13 Source: AREIT, Standard Chartered Research 31-Dec-13 31-Mar-14 31-Mar-13 30-Jun-13 30-Sep-13 31-Dec-13 31-Mar-14 Source: MINT, Standard Chartered Research Business parks’ high pre-commitment levels not a source for comfort We estimate that about 1.86msf of new business park space was completed in 2013. However, due to some demolitions, supply increased by only 0.04msf. While the new assets were 65% pre-committed, tenants moved into these buildings from older business parks. 16 July 2014 7 Equity Research l Singapore REITs 4.5 24% 25% 4.0 3.00 80% 3.0 75% 70% 2.5 65% Source: Urban Redevelopment Authority, Standard Chartered Research estimates 2016E 2015E 2013 2014E 2012 2011 60% 2002 2.0 2016E 2015E 2014E 2013 2012 2011 2010 2009 2008 0% 2007 0.0 2006 5% 2005 0.5 85% 3.5 2010 10% 90% 3.85 2009 msf 15% 1.0 100% 95% 2008 16% 1.5 Occupancy rate (RHS) 2007 20% Rent 2006 2.0 30% 2005 Vacancy rate (RHS) 2004 Demand SGD psfpm Supply 2.5 Figure 14: Business park occupancy rate and rents 2003 Figure 13: Business park supply and demand Source: Urban Redevelopment Authority, Standard Chartered Research estimates We expect new business park supply of around 1.7msf p.a. (9% growth) in 2014-16, much higher than the average demand growth of 5-6% p.a. in the past five years. We also expect the tighter policy on foreign employment to lead to lower offshoring demand among financial institutions and IT companies. This would curb demand for business parks (Squeeze on middle-income expats could hurt business park demand, 7 April 2014). We think this could result in a rise in vacancy rates in SREITs’ portfolios. In 2014-16, we estimate that average business park rents could decline by 8% p.a. to SGD 3.00psfpm, from SGD 3.85psfpm currently. High-tech industrial rents are likely to follow suit, in our view. Multi-tenanted factory rents could fall 11% over 2014-16 For multi-tenanted factories, we expect supply growth of 4.5% p.a. in 2014-16, following a 4% p.a. rise in 2012-13. This supply increase is a result of the large amount of land sold by the government in 2010-13. Over the past two years, the industrial vacancy rate has risen by 200bps to 11.4%, from 9.2%, as demand increased by only 2.8% p.a. We expect vacancy rates to increase to 13% in 2016, with rents falling 4% p.a. in 2014-16. 6 4.0 12% 5 9% 4 0 2016E 2015E 2014E 2013 2012 2011 2010 2009 2008 2007 2006 Source: Urban Redevelopment Authority, Standard Chartered Research estimates 16 July 2014 2H14 -3% 1H14 -2.0 2H13 1 1H13 0% 2H12 -1.0 1H12 2 2H11 3% 0.0 GLS sold 3 1H11 6% 1.0 Reserve 2H10 2.0 Confirmed 1H08 msf 3.0 msf 15% 1H10 Vacancy rate (RHS) 2H09 Demand 5.0 1H09 Supply Figure 16: Industrial land sold by the government 2H08 Figure 15: Multi-tenanted industrial supply and demand Source: JTC 8 Equity Research l Singapore REITs Disclosures appendix The information and opinions in this report were prepared by Standard Chartered Bank (Hong Kong) Limited, Standard Chartered Bank Singapore Branch, Standard Chartered Securities (India) Limited, Standard Chartered Securities Korea Limited and/or one or more of its affiliates (together with its group of companies, ”SCB”) and the research analyst(s) named in this report. THIS RESEARCH HAS NOT BEEN PRODUCED IN THE UNITED STATES. Analyst Certification Disclosure: The research analyst or analysts responsible for the content of this research report certify that: (1) the views expressed and attributed to the research analyst or analysts in the research report accurately reflect their personal opinion(s) about the subject securities and issuers and/or other subject matter as appropriate; and (2) no part of his or her compensation was, is or will be directly or indirectly related to the specific recommendations or views contained in this research report. On a general basis, the efficacy of recommendations is a factor in the performance appraisals of analysts. Where “disclosure date” appears below, this means the day prior to the report date. All share prices quoted are the closing price for the business day prior to the date of the report, unless otherwise stated. Recommendation Distribution and Investment Banking Relationships % of covered companies currently assigned this rating % of companies assigned this rating with which SCB has provided investment banking services over the past 12 months OUTPERFORM 55.8% 10.4% IN-LINE 33.0% 10.1% UNDERPERFORM As of 30 June 2014 11.2% 8.1% Research Recommendation Terminology OUTPERFORM (OP) IN-LINE (IL) UNDERPERFORM (UP) Definitions The total return on the security is expected to outperform the relevant market index by 5% or more over the next 12 months The total return on the security is not expected to outperform or underperform the relevant market index by 5% or more over the next 12 months The total return on the security is expected to underperform the relevant market index by 5% or more over the next 12 months SCB uses an investment horizon of 12 months for its price targets. Additional information, including disclosures, with respect to any securities referred to herein will be available upon request. Requests should be sent to [email protected]. Global Disclaimer: Standard Chartered Bank and/or its affiliates ("SCB”) makes no representation or warranty of any kind, express, implied or statutory regarding this document or any information contained or referred to in the document. The information in this document is provided for information purposes only. It does not constitute any offer, recommendation or solicitation to any person to enter into any transaction or adopt any hedging, trading or investment strategy, nor does it constitute any prediction of likely future movements in rates or prices or represent that any such future movements will not exceed those shown in any illustration. The stated price of the securities mentioned herein, if any, is as of the date indicated and is not any representation that any transaction can be effected at this price. While all reasonable care has been taken in preparing this document, no responsibility or liability is accepted for errors of fact or for any opinion expressed herein. The contents of this document may not be suitable for all investors as it has not been prepared with regard to the specific investment objectives or financial situation of any particular person. Any investments discussed may not be suitable for all investors. Users of this document should seek professional advice regarding the appropriateness of investing in any securities, financial instruments or investment strategies referred to in this document and should understand that statements regarding future prospects may not be realised. Opinions, forecasts, assumptions, estimates, derived valuations, projections, and price target(s), if any, contained in this document are as of the date indicated and are subject to change at any time without prior notice. Our recommendations are under constant review. The value and income of any of the securities or financial instruments mentioned in this document can fall as well as rise and an investor may get back less than invested. Future returns are not guaranteed, and a loss of original capital may be incurred. Foreign-currency denominated securities and financial instruments are subject to fluctuation in exchange rates that could have a positive or adverse effect on the value, price or income of such securities and financial instruments. Past performance is not indicative of comparable future results and no representation or warranty is made regarding future performance. While we endeavour to update on a reasonable basis the information and opinions contained herein, there may be regulatory, compliance or other reasons that prevent us from doing so. Accordingly, information may be available to us which is not reflected in this material, and we may have acted upon or used the information prior to or immediately following its publication. SCB is not a legal or tax adviser, and is not purporting to provide legal or tax advice. Independent legal and/or tax advice should be sought for any queries relating to the legal or tax implications of any investment. SCB, and/or a connected company, may have a position in any of the securities, instruments or currencies mentioned in this document. SCB and/or any member of the SCB group of companies or its respective officers, directors, employee benefit programmes or employees, including persons involved in the preparation or issuance of this document may at any time, to the extent permitted by applicable law and/or regulation, be long or short any securities or financial instruments referred to in this document and on the website or have a material interest in any such securities or related investment, or may be the only market maker in relation to such investments, or provide, or have provided advice, investment banking or other services, to issuers of such investments. SCB has in place policies and procedures and physical information walls between its Research Department and differing public and private business functions to help ensure confidential information, including ‘inside’ information is not disclosed unless in line with its policies and procedures and the rules of its regulators. Data, opinions and other information appearing herein may have been obtained from public sources. SCB makes no representation or warranty as to the accuracy or completeness of such information obtained from public sources. You are advised to make your own independent judgment (with the advice of your professional advisers as necessary) with respect to any matter contained herein and not rely on this document as the basis for making any trading, hedging or investment decision. SCB accepts no liability and will not be liable for any loss or damage arising directly or indirectly (including special, incidental, consequential, punitive or exemplary damages) from use of this document, howsoever arising, and including any loss, damage or expense arising from, but not limited to, any defect, error, imperfection, fault, mistake or inaccuracy with this document, its contents or associated services, or due to any unavailability of the document or any part thereof or any contents or associated services. This material is for the use of intended recipients only and in any jurisdiction in which distribution to private/retail customers would require registration or licensing of the distributor which the distributor does not currently have, this document is intended solely for distribution to professional and institutional investors. Country-Specific Disclosures - If you are receiving this document in any of the countries listed below, please note the following: United Kingdom and European Economic Area: SCB is authorised in the United Kingdom by the Prudential Regulation Authority and regulated by the Financial Conduct Authority and the Prudential Regulation Authority. This communication is not directed at Retail Clients in the European Economic Area as defined by Directive 2004/39/EC. Nothing in this document constitutes a personal recommendation or investment advice as defined by Directive 2004/39/EC. Australia: The Australian Financial Services Licence for Standard Chartered Bank is Licence No: 246833 with the following Australian Registered Business Number (ARBN: 097571778). Australian investors should note that this document was prepared for “wholesale clients” only within the meaning of section 761G of the Australian Corporations Act 2001 (Act) and the Corporations Regulations. This document is not directed at persons who are “retail clients” as defined in the Australian Corporations Act 2001. Brazil: SCB disclosures pursuant to the Securities and Exchange Commission of Brazil (“CVM”) Instruction 483/10: This research has not been produced in Brazil. The report has been prepared by the research analyst(s) in an autonomous and independent way, including in relation to SCB. THE SECURITIES MENTIONED IN THIS DOCUMENT HAVE NOT BEEN AND WILL NOT BE REGISTERED PURSUANT TO THE REQUIREMENTS OF THE SECURITIES AND EXCHANGE COMMISSION OF BRAZIL AND MAY NOT BE OFFERED OR SOLD IN BRAZIL EXCEPT PURSUANT TO AN APPLICABLE EXEMPTION FROM THE REGISTRATION REQUIREMENTS AND IN COMPLIANCE WITH THE SECURITIES LAWS OF BRAZIL. Germany: In Germany, this document is being distributed by Standard Chartered Bank Germany Branch which is also regulated by the Bundesanstalt für Finanzdienstleistungsaufsicht (BaFin). Hong Kong: This document, except for any portion advising on or facilitating any decision on futures contracts trading, is being distributed in Hong Kong by, and is 16 July 2014 9 Equity Research l Singapore REITs attributable to, Standard Chartered Bank (Hong Kong) Limited which is regulated by the Hong Kong Monetary Authority. India: This document is being distributed in India by Standard Chartered Securities (India) Limited, which is a SEBI-registered broker and a member of the Bombay Stock Exchange Limited and The National Stock Exchange of India Limited. Registered Address: 2nd Floor, 23-25 M. G. Road, Fort, Mumbai - 400 001. India | Telephone No: 022 - 6135 5999 | Fax No: 022 6135 5900| http://www.standardcharteredtrade.co.in | Email: [email protected]. | CIN: U65990MH1994PLC079263. Korea: This document is being distributed in Korea by, and is attributable to, Standard Chartered Securities Korea Limited which is regulated by the Financial Supervisory Service. Malaysia: This document is being distributed in Malaysia by Standard Chartered Bank Malaysia Berhad only to institutional investors or corporate customers. Recipients in Malaysia should contact Standard Chartered Bank Malaysia Berhad in relation to any matters arising from, or in connection with, this document. Singapore: This document is being distributed in Singapore by Standard Chartered Bank Singapore Branch only to accredited investors, expert investors or institutional investors, as defined in the Securities and Futures Act, Chapter 289 of Singapore. Recipients in Singapore should contact Standard Chartered Bank Singapore Branch in relation to any matters arising from, or in connection with, this document. South Africa: SCB is licensed as a Financial Services Provider in terms of Section 8 of the Financial Advisory and Intermediary Services Act 37 of 2002. SCB is a Registered Credit Provider in terms of the National Credit Act 34 of 2005 under registration number NCRCP4. United States: Except for any documents relating to foreign exchange, FX or global FX, Rates or Commodities, distribution of this document in the United States or to US persons is intended to be solely to major institutional investors as defined in Rule 15a-6(a)(2) under the US Securities Act of 1934. All US persons that receive this document by their acceptance thereof represent and agree that they are a major institutional investor and understand the risks involved in executing transactions in securities. Any US recipient of this document wanting additional information or to effect any transaction in any security or financial instrument mentioned herein, must do so by contacting a registered representative of Standard Chartered Securities (North America) Inc., 1095 Avenue of the Americas, New York, N.Y. 10036, US, tel + 1 212 667 0700. WE DO NOT OFFER OR SELL SECURITIES TO U.S. PERSONS UNLESS EITHER (A) THOSE SECURITIES ARE REGISTERED FOR SALE WITH THE U.S. SECURITIES AND EXCHANGE COMMISSION AND WITH ALL APPROPRIATE U.S. STATE AUTHORITIES; OR (B) THE SECURITIES OR THE SPECIFIC TRANSACTION QUALIFY FOR AN EXEMPTION UNDER THE U.S. FEDERAL AND STATE SECURITIES LAWS NOR DO WE OFFER OR SELL SECURITIES TO U.S. PERSONS UNLESS (i) WE, OUR AFFILIATED COMPANY AND THE APPROPRIATE PERSONNEL ARE PROPERLY REGISTERED OR LICENSED TO CONDUCT BUSINESS; OR (ii) WE, OUR AFFILIATED COMPANY AND THE APPROPRIATE PERSONNEL QUALIFY FOR EXEMPTIONS UNDER APPLICABLE U.S. FEDERAL AND STATE LAWS. © Copyright 2014 Standard Chartered Bank and its affiliates. All rights reserved. All copyrights subsisting and arising out of all materials, text, articles and information contained herein is the property of Standard Chartered Bank and/or its affiliates, and may not be reproduced, redistributed, amended, modified, adapted, transmitted in any form, or translated in any way without the prior written permission of Standard Chartered Bank. 16 July 2014 10
© Copyright 2026 ExpyDoc