LETTER
doi:10.1038/nature13198
Nicotinamide N-methyltransferase knockdown
protects against diet-induced obesity
Daniel Kraus1*{, Qin Yang1*{, Dong Kong1, Alexander S. Banks2, Lin Zhang1, Joseph T. Rodgers2, Eija Pirinen3{,
Thomas C. Pulinilkunnil1{, Fengying Gong1{, Ya-chin Wang1, Yana Cen4, Anthony A. Sauve4, John M. Asara5, Odile D. Peroni1,
Brett P. Monia6, Sanjay Bhanot6, Leena Alhonen3{, Pere Puigserver2 & Barbara B. Kahn1
In obesity and type 2 diabetes, Glut4 glucose transporter expression
is decreased selectively in adipocytes1. Adipose-specific knockout or
overexpression of Glut4 alters systemic insulin sensitivity2. Here we
show, using DNA array analyses, that nicotinamide N-methyltransferase
(Nnmt) is the most strongly reciprocally regulated gene when comparing gene expression in white adipose tissue (WAT) from adiposespecific Glut4-knockout or adipose-specific Glut4-overexpressing mice
with their respective controls. NNMT methylates nicotinamide (vitamin B3) using S-adenosylmethionine (SAM) as a methyl donor3,4.
Nicotinamide is a precursor of NAD1, an important cofactor linking cellular redox states with energy metabolism5. SAM provides propylamine for polyamine biosynthesis and donates a methyl group
for histone methylation6. Polyamine flux including synthesis, catabolism and excretion, is controlled by the rate-limiting enzymes ornithine
decarboxylase (ODC) and spermidine–spermine N1-acetyltransferase
(SSAT; encoded by Sat1) and by polyamine oxidase (PAO), and has
a major role in energy metabolism7,8. We report that NNMT expression is increased in WAT and liver of obese and diabetic mice. Nnmt
knockdown in WAT and liver protects against diet-induced obesity
by augmenting cellular energy expenditure. NNMT inhibition increases adipose SAM and NAD1 levels and upregulates ODC and
SSAT activity as well as expression, owing to the effects of NNMT on
histone H3 lysine 4 methylation in adipose tissue. Direct evidence
for increased polyamine flux resulting from NNMT inhibition includes elevated urinary excretion and adipocyte secretion of diacetylspermine, a product of polyamine metabolism. NNMT inhibition
in adipocytes increases oxygen consumption in an ODC-, SSAT- and
PAO-dependent manner. Thus, NNMT is a novel regulator of histone methylation, polyamine flux and NAD1-dependent SIRT1 signalling, and is a unique and attractive target for treating obesity and
type 2 diabetes.
Nnmt is expressed at high levels in adipose tissue and liver and at lower
levels in other organs3,4. Nnmt is increased in multiple cancers9,10, neurodegenerative diseases11, and also in obesity and diabetes12–14. For example,
Nnmt expression is increased in adipocytes of obese, compared to nonobese Pima Indians12. Metabolomic analyses reveal elevated levels of urinary N1-methylnicotinamide, the product of NNMT, in humans with type
2 diabetes, and in db/db mice and obese Zucker rats13, indicating increased
NNMT activity in obesity and type 2 diabetes. Quantitative trait loci mapping in mice suggests a causative role of Nnmt in type 2 diabetes14. Therefore, we investigated the regulation and roles of NNMT in obesity and
type 2 diabetes.
Adipose Nnmt messenger RNA levels were increased twofold in insulinresistant adipose-specific Glut4-knockout mice (Fig. 1a), and reduced
by 62% in insulin-sensitive adipose-specific Glut4-overexpressing mice
(Fig. 1b). NNMT protein was increased 1.5- to 2-fold in WAT of ob/ob,
db/db mice and high-fat diet (HFD)-fed mice (Fig. 1c–e), compared
with lean, insulin-sensitive controls. Hepatic NNMT protein levels were
increased in ob/ob and db/db mice (Fig. 1f, g) and tended to be higher in
HFD-fed mice (Fig. 1h). Thus, NNMT is upregulated in adipose tissue
and liver of mouse models of obesity and insulin resistance.
Adipose and hepatic Nnmt expression varies highly among 25 different mouse strains15 (Supplementary Fig. 1). Adipose Nnmt expression is
high in obesity-prone strains and low in obesity-resistant strains15–17 (Supplementary Fig. 1a). In contrast, liver Nnmt expression does not parallel
the propensity for obesity (Supplementary Fig. 1b). Adipose Nnmt expression correlates highly with per cent fat mass in diet-induced obesity
across 20 different mouse strains18, and with expression of retinol-binding
protein 4 (Rbp4) (r 5 0.90, P , 0.0001 by Pearson correlation coefficient,
two-tailed test), an adipokine that contributes to insulin resistance2 (Supplementary Fig. 2a, b). Thus, we proposed that elevated NNMT levels
in adipose tissue and/or liver may have a causative role in insulin resistance and obesity.
We knocked down Nnmt with antisense oligonucleotides (ASOs) in
HFD-fed mice. ASOs regulate gene expression primarily in liver and
fat19,20. Treating HFD-fed mice with Nnmt ASO reduced Nnmt mRNA
and NNMT protein by 60 to 75% in WAT and 60% (protein) to 90%
(mRNA) in liver (Fig. 2a–d), but not in brown adipose tissue and kidney
(Fig. 2e, f). Serum transaminases and creatinine were normal, indicating
no hepatic or renal toxicity with ASO treatment (Supplementary Fig. 3a–c).
Nnmt knockdown in adipose tissue and liver protected mice from
diet-induced obesity (Fig. 2g), causing a 47% reduction in relative fat mass
and a 15% increase in relative lean mass (Fig. 2h, i). Free body water and
hepatic glycogen content were not different (not shown) between control- and Nnmt-ASO-treated mice. Subcutaneous and epididymal fat-pad
weights were lower in Nnmt-knockdown mice than in controls (Fig. 2j, k),
largely owing to reduced adipocyte size (44% reduced area, Fig. 2l, and
70% reduced volume, Supplementary Fig. 4). Insulin sensitivity was enhanced, as evidenced by approximately 50 to 60% lower serum insulin
levels and glucose-insulin product (Fig. 2m, n). Nnmt knockdown also
improved glucose tolerance (Fig. 2o, p), prevented HFD-induced hepatic
steatosis (Fig. 2q, r), and decreasedserum triglycerides and free fatty acids (Supplementary Fig. 5a, b). Thus, Nnmt knockdown in WAT and liver protects
against diet-induced obesity and its deleterious metabolic consequences.
1
Division of Endocrinology, Diabetes, and Metabolism, Department of Medicine, Beth Israel Deaconess Medical Center and Harvard Medical School, 330 Brookline Avenue, Boston, Massachusetts 02215,
USA. 2Department of Cancer Biology, Dana-Farber Cancer Institute, Harvard Medical School, Boston, Massachusetts 02115, USA. 3Biotechnology and Molecular Medicine, A.I. Virtanen Institute for
Molecular Sciences, Biocenter Kuopio, University of Eastern Finland, Kuopio Campus, PO Box 1627, FI-70211 Kuopio, Finland. 4Department of Pharmacology, Weill Medical College of Cornell University,
1300 York Avenue, New York, New York 10065, USA. 5Division of Signal Transduction, Beth Israel Deaconess Medical Center and Harvard Medical School, 330 Brookline Ave, Boston, Massachusetts 02215,
USA. 6Isis Pharmaceuticals, 1896 Rutherford Road, Carlsbad, California 92008-7326, USA. {Present addresses: Division of Nephrology, Department of Internal Medicine I, Wu¨rzburg University Hospital,
Oberdu¨rrbacher Straße 6, 97080 Wu¨rzburg, Germany (D.K.); Department of Medicine, Physiology and Biophysics, Center for Diabetes Research and Treatment, and Center for Epigenetics and Metabolism,
University of California, Irvine, California 92697, USA (Q.Y.); Research Programs Unit, Molecular Neurology, Biomedicum Helsinki, University of Helsinki, 00290, Helsinki, Finland (E.P.); Department of
Biochemistry and Molecular Biology, Faculty of Medicine, Dalhousie Medicine New Brunswick, Dalhousie University, Saint John, New Brunswick E2L4L5, USA (T.C.P.); Department of Endocrinology, Key
Laboratory of Endocrinology of Ministry of Health, Peking Union Medical College Hospital, Chinese Academy of Medical Sciences and Peking Union Medical College, Beijing 100730, China (F.G.); School of
Pharmacy, University of Eastern Finland, P.O. Box 1627, FI-70211 Kuopio, Finland (L.A.) .
*These authors contributed equally to this work.
2 5 8 | N AT U R E | VO L 5 0 8 | 1 0 A P R I L 2 0 1 4
©2014 Macmillan Publishers Limited. All rights reserved
LETTER RESEARCH
e
1.0
0.5
*
2.0
1.0
1.0
0.5
Chow
h
Liver
Le
dban
Le/db
dban
/
Le db
dban
/d
b
Le
an
Le
an
ob
/o
ob b
/o
b
db/db
HFD
Liver
i
20
10
l
Con
ASO
NNMT
ASO
Adipocyte size
Area (mm2)
*
2.0
2.0
ob/ob
40
20
0
Con NNMT
ASO ASO
NNMT protein (AU)
25
k
SQWAT
0.6
*
0.4
0.2
0.0
Vehicle
Control ASO
NNMT ASO
20
Con
ASO
EWAT
NNMT
ASO
NNMT ASO
1.5
1.0
*
0.5
0.0
Con NNMT
ASO ASO
Chow
*
Con NNMT
ASO ASO
m
Lean
db/db
0.0
Chow
HFD
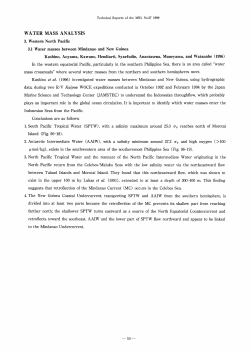
Figure 1 | NNMT expression is increased in WAT and liver of obese
and insulin-resistant mice. a, b, Nnmt mRNA expression normalized by
cyclophilin in WAT of adipose-specific Glut4 knockout (AG4KO) mice
and aP2-Cre controls (n 5 4 per group) (a) and adipose-specific Glut4
overexpressing (AG4OX) and wild-type littermate controls (n 5 6 per
group) (b). c–e, NNMT protein levels in WAT of ob/ob mice (n 5 8)
and lean controls (n 5 4) (c); db/db mice and lean controls (n 5 7 per group)
(d), and high-fat diet (HFD)-fed (n 5 6) and chow-fed mice (n 5 7) (e).
f–h, NNMT protein levels in liver of ob/ob mice (n 5 9) and lean controls (n 5 6)
(f); db/db mice and lean controls (n 5 7 per group) (g); and HFD-fed and chowfed mice (n 5 6 per group) (h). Actin was used as a control for western blot
analysis and the levels were not different between lean and obese mice.
AU, arbitrary units. Error bars, 6 s.e.m; *P , 0.05.
We sought to determine whether the leanness with Nnmt knockdown
is due to reduced energy intake or increased energy expenditure. The
NNMT substrate, nicotinamide, at pharmacological doses may suppress
food intake and cause weight loss in rats21. However, Nnmt-ASO-treated
mice consumed the same amount of calories as controls (Fig. 3a). Food
intake was measured before body weights diverged, in order to eliminate
confounding by body-weight differences. Feed efficiency (body weight
change per kcal of food eaten) was reduced by approximately 50% in
Nnmt-knockdown mice (Fig. 3b). Although control-ASO-treated mice
gained about 7 mg of fat per kcal of food intake, Nnmt-ASO-treated mice
gained no fat (Fig. 3c). Thus, body weight and fat gain were disproportionally low for the calorie intake in Nnmt-ASO-treated compared
with control-ASO-treated mice. Faecal lipid excretion was not changed between control- and Nnmt-ASO-treated mice (Fig. 3d). Therefore,
increased energy expenditure rather than decreased food intake or steatorrhoea explains the leanness in Nnmt-knockdown mice. This was
further demonstrated by increased oxygen consumption (expressed per
kg body weight or per mouse) during comprehensive laboratory animal
monitoring system (CLAMS) analysis performed before body weights
started to diverge (Fig. 3e and Supplementary Fig. 6a). Comparison of mice
with similar body weight showed that Nnmt-ASO-treated mice had higher
energy expenditure than control-ASO-treated mice (Supplementary
Fed insulin
n
2.0
1.5
*
1.0
0.5
0.0
Insulin × glucose
o
p
Control ASO
NNMT ASO
300
Product
Lean
0.0
*
60
*
30
0.01
1.0
1.0
0.0
0.02
80
Con NNMT
ASO ASO
15
–14 0 14 28 42 56
Treatment day
NNMT
ASO
j
0.0
0.00
1.0
Serum insulin (ng ml–1)
NNMT protein (AU)
3.0
*
Con
ASO
Control ASO
0.03
2.0
0.5
Lean mass
*
0
1.0
0.0
*
0.4
35
200
*
100
0
Con NNMT
ASO ASO
Con NNMT
ASO ASO
250
200
150
AUC
800
300
*
mg dl–1 × min
g
Liver
Lean
Fat mass
30
g
Kidney
NNMT
ASO
0.8
Con NNMT
ASO ASO
600
200
100
0
0 30 60 90 120
Time (min)
q
*
400
Con
ASO
NNMT
ASO
r
Control ASO
NNMT ASO
Chow
Triglycerides
(mg dl–1 per mg tissue)
ob/ob
0.0
Con
ASO
0.0
*
1.5
Glucose (mg dl–1)
f
Lean
0.0
ho
w
C
ho
w
H
FD
H
FD
0.0
Per cent of body weight
h
1.0
C
NNMT protein (AU)
1.5
*
2.0
0.5
NNMT
ASO
f
BAT
0.0
*
Con
ASO
NNMT protein (AU)
WAT
0.0
1.5
NNMT protein (AU)
Le
Le
an
Le
ob an
Le/ob
ob an
Le/ob
ob an
/o
b
e
WAT
an
db
/d
db b
/d
b
d
WAT
Control AG4OX
NNMT
ASO
Liver
1.2
Fat-pad weight (g)
Con
ASO
*
1.0
Body weight (g)
0.0
0.5
d
Liver
Nnmt mRNA (AU)
*
0.5
0.0
0.0
Control AG4KO
c
*
0.5
1.0
1.0
c
WAT
1.0
Fat-pad weight (g)
1.0
b
WAT
NNMT protein (AU)
2.0
a
WAT
C
ho
w
C
ho
w
H
FD
H
FD
Nnmt mRNA (AU)
*
Per cent of body weight
b
WAT
Nnmt mRNA (AU)
a
40
30
*
20
10
0
Con
ASO
NNMT
ASO
Figure 2 | Nnmt knockdown prevents diet-induced obesity and insulin
resistance. a–f, Knockdown efficiency of Nnmt-ASO. mRNA expression was
normalized by cyclophilin and protein levels were corrected with actin levels:
Nnmt mRNA (a) and NNMT protein in WAT (b); Nnmt mRNA (c) and
NNMT protein in liver (d); NNMT protein in brown adipose tissue (BAT)
(e) and kidney (f). g, Body weights of C57BL/6 mice fed a high-fat diet and
treated with Nnmt ASO, control ASO, or vehicle (saline) for 8 weeks. h, Fat
mass as a percentage of body weight. i, Lean mass as a percentage of body
weight. j, Subcutaneous WAT (SQWAT) fat-pad weights. k, Epididymal WAT
(EWAT) fat-pad weights. l, Epididymal adipocyte cross-sectional area and
haematoxylin and eosin (H&E)-stained sections of SQWAT. m, Serum insulin
levels. n, Glucose 3 insulin product (ng ml21 3 mg dl21) in the fed state.
o, Intraperitoneal glucose tolerance test. p, Area under the curve (AUC) of the
glucose tolerance. q, H&E stain of liver sections of HFD-fed Nnmt-ASOand control-ASO-treated mice, and of chow-fed mice. r, Hepatic triglyceride
levels in Nnmt- and control-ASO-treated mice. The scale bars in l and
q represent 100 mm; n 5 8 per group for a–p, n 5 13 per group for r. AU,
arbitrary units. Error bars, 6 s.e.m.; *P , 0.05.
Fig. 6b). Energy expenditure per gram of fat mass, but not per gram
of lean mass was increased in Nnmt-ASO-treated mice compared with
control-ASO-treated mice (Supplementary Fig. 6c, d). There was no
measurable difference in food intake expressed per mouse or per g
body weight, locomotor activity or respiratory exchange ratio (RER)
(Supplementary Fig. 7a–d). As a third approach to assess the energy
1 0 A P R I L 2 0 1 4 | VO L 5 0 8 | N AT U R E | 2 5 9
©2014 Macmillan Publishers Limited. All rights reserved
RESEARCH LETTER
b
Body-weight gain
(mg per kcal eaten)
(cal per day per
g body weight)
600
400
200
0
Feed efficiency
20
Con
ASO
NNMT
ASO
15
*
10
5
0
c
d
Fat gain
Faecal lipids
12
8
6
4
2
0
–2
Lipid excretion
(mg per day)
Energy intake
800
Fat gain
(mg per kcal eaten)
a
*
10
8
6
4
2
–4
Con
ASO
NNMT
ASO
Con
ASO
0
NNMT
ASO
Con NNMT
ASO ASO
e
Control ASO
4,500
4,000
4,000
3,500
3,500
3,000
3,000
Dark Light Dark Light Dark
High-fat diet
0
Body weight
(per cent change)
24
Chow
0
–4
–8
*
–12
*
–16
–25
*
–75
–100
6
h
High-fat diet Chow
4
4
2
2
2
0
Con
ASO
NNMT
ASO
0
Control NNMT
ASO ASO
–5
–10
*
*
6
4
0
Dark
k
*
*
Light
–15
*
j
6
*
96
High-fat diet Chow
Control NNMT
ASO ASO
–50
*
2,500
72
g
Control NNMT
ASO ASO
i
O2 consumption
(nmol min–1 per 106 cells)
48
Con ASO
NNMT ASO
Lean mass
(per cent change)
2,500
Time (h) 0
f
NNMT ASO
4,500
Body fat
(per cent change)
Vol. O2 (ml kg–1 h–1)
5,000
*
0
Control
Control
me-Nam
NNMT
Figure 3 | NNMT regulates energy expenditure. a, Energy intake of HFD-fed
control-ASO- and Nnmt-ASO-treated mice. b, Feed efficiency (body-weight
gain per kilocalorie (kcal) consumed) of HFD-fed control-ASO- and Nnmt–
ASO-treated mice. c, Fat mass gain per kcal consumed in HFD-fed mice treated
with Nnmt ASO or control ASO. n 5 12 per group for a–c. d, Faecal lipid
excretion (n 5 10 per group). e, Oxygen consumption (Vol. O2) measured
by CLAMS (n 5 7 per group). f–h, Effects of a 16-h fast on body weight (f),
fat mass (g), and lean body mass (n 5 8 per group) (h). i–k, Oxygen
consumption in 3T3-L1 adipocytes transfected with control or Nnmt ASO
(n 5 6 per group) (i), treated with 10 mM N1-methylnicotinamide (me-Nam)
(n 5 6 per group) (j), or transfected with Nnmt cDNA (n 5 10 per group) (k).
Error bars, 6 s.e.m.; *P , 0.05.
expenditure, we measured body weight and body composition before and
after an overnight fast. In the absence of energy intake, increased loss of
body fat indicates increased energy expenditure. After fasting, Nnmtknockdown mice on HFD lost more body weight, body fat and lean mass
than control-ASO-treated mice, and the response resembled that of
chow-fed lean mice (Fig. 3f–h). Core body temperature, BAT weight,
and uncoupling protein-1 levels in BAT (Supplementary Fig. 8a–c) were
unchanged. Thus, Nnmt knockdown in WAT and liver increases energy
expenditure, and this is likely to be independent of BAT-induced energy
dissipation or heat production.
We asked whether NNMT regulates energy expenditure in a cellautonomous manner. Nnmt knockdown in adipocytes led to a 60%
increase in oxygen consumption (Fig. 3i). NNMT inhibition by N1methylnicotinamide—the NNMT reaction product and a specific, potent
inhibitor of NNMT at pharmacological doses3—also increased oxygen
consumption (Fig. 3j). Conversely, Nnmt overexpression decreased
oxygen consumption (Fig. 3k) in adipocytes. Similar results were obtained
in cultured hepatoma cells (Supplementary Fig. 9). Therefore, NNMT
regulates oxygen consumption in a cell-autonomous fashion in both
adipocytes and hepatocytes.
We sought to determine the molecular mechanisms for increased energy
expenditure with NNMT inhibition. NNMT methylates nicotinamide
using SAM as a methyl donor and generates S-adenosylhomocysteine
(SAH). Adipose SAM, and the SAM:SAH ratio were increased by 50%
in Nnmt-ASO-treated mice (Fig. 4a). In liver, SAM was not changed,
but the SAM:SAH ratio was increased by 2.2-fold owing to a 48%
reduction of SAH levels in Nnmt-ASO-treated mice (Supplementary Fig. 10). The unchanged hepatic SAM with Nnmt knockdown
contrasts with knockdown of glycine N-methyltransferase (Gnmt), a
dominant methyltransferase that accounts for .1% of total cytosolic
protein in liver. Gnmt knockdown increases SAM by 40-fold and induces
hepatic steatosis and fibrosis22. Hepatic Nnmt knockdown did not cause
fibrosis as evidenced by normal expression of tissue inhibitor of metalloproteinase 1 (Timp1) and collagen type 1 (Colla1), markers for hepatic fibrosis (Supplementary Fig. 11a, b).
SAM has two major functions: first, providing propylamine groups
for polyamine biosynthesis; and second, donating methyl groups to
substrates including histones6. Polyamines (putrescine, spermine and
spermidine) are organic polycations that are essential for multiple cellular functions affecting cell growth, cancer and ageing23. Polyamine
metabolism is tightly controlled (Supplementary Fig. 12)23. Synthesis is
controlled by ODC producing putrescine, and by adenosylmethionine
decarboxylase (AMD1) providing decarboxylated SAM for the synthesis
of spermidine and spermine. Catabolism is controlled by spermidine–
spermine N1-acetyltransferase (SSAT), which acetylates spermidine and
spermine using acetyl-CoA as a substrate. The acetylated products including N1-acetylspermine, N1,N12-diacetylspermine, and N1-acetylspermidine,
are either oxidized by PAO or excreted intact in urine. Polyamine flux
has a major role in energy homeostasis. Genetic knockout of SSAT results
in increased diet-induced obesity and transgenic SSAT overexpression
causes leanness owing to altered energy expenditure7,8,24. As Nnmt
knockdown increases adipose SAM levels (Fig. 4a), we reasoned that
this may cause a ‘substrate shunt’ of SAM from the NNMT reaction to
polyamine flux leading to increased energy expenditure in NnmtASO-treated mice (Fig. 3). In support of this, Nnmt expression correlates negatively with Odc and Ssat expression in adipose tissue, but not
in liver in 25 different mouse strains15 (Supplementary Fig. 13a–d).
Nnmt-ASO treatment in vivo augmented adipose ODC and SSAT
activity (Fig. 4b, c) and mRNA expression (Fig. 4d). The expression of
adenosylmethionine decarboxylase Amd1, which provides decarboxylated SAM for spermidine and spermine synthesis, was also increased
(Fig. 4d). In liver, Nnmt ASO increased ODC, but not SSAT activity,
or Odc or Ssat expression (Supplementary Fig. 14a–d). ODC and SSAT
activation drives polyamine flux, which consumes the metabolic substrate, acetyl-CoA, for polyamine acetylation7. Consistent with reduced
acetyl-CoA availability for lipogenesis, acetyl-CoA carboxylase 1 expression and fatty acid synthase expression and activity were decreased in
adipose tissue of Nnmt-ASO-treated mice (Supplementary Fig. 15a–c).
In addition, adipose Nnmt knockdown also decreased ATP, increased
the AMP:ATP ratio and enhanced AMPK threonine 172 phosphorylation (Supplementary Fig. 16a–d). Increased urinary diacetylspermine
provides direct evidence for enhanced adipose polyamine flux in
Nnmt-ASO-treated mice (Fig. 4e). Furthermore, reduction in Nnmt
increased Odc and Ssat expression in cultured adipocytes (Fig. 4f, g).
N1-methylnicotinamide treatment promoted diacetylspermine secretion from adipocytes in a dose-dependent manner (Fig. 4h), complementing the increased urinary diacetylspermine excretion in NnmtASO-treated mice (Fig. 4e). These data convincingly show that NNMT
directly regulates polyamine flux in adipocytes.
In addition to being a substrate for polyamine metabolism, SAM is
a methyl donor for numerous methylation reactions including histone
methylation, which is important for transcriptional regulation6. We measured eight types of histone methylation; the amounts of mono-, di- or
tri-methylated lysine 4 of histone H3 (H3K4) were increased in adipose
tissue of Nnmt-ASO-treated mice (Fig. 4i). Chromatin immunoprecipitation followed by quantitative PCR (ChIP–qPCR) revealed enrichment
of methylated H3K4 on Odc and Ssat genes with NNMT inhibition in
adipocytes (Fig. 4j). Thus, NNMT inhibition modifies histone methylation
and increases Odc and Ssat expression, leading to activation of polyamine flux.
2 6 0 | N AT U R E | VO L 5 0 8 | 1 0 A P R I L 2 0 1 4
©2014 Macmillan Publishers Limited. All rights reserved
LETTER RESEARCH
150
0
250
*
200
*
0
Ssat
Per cent of input
†
0
Odc
*
Con
meNam
*
2.4
1.2
0.0
l
me2
Odc
me3
Ssat
*
0
p
100
50
50
10
10
–
20
1.6
0.0
10
20
NAD+
Energy
expenditure
d4
5a
hb
0
Sd
Con NNMT
ASO ASO
Nam
Epigenetic changes
(histone methylation)
Polyamine flux
ad
Con NNMT
ASO ASO
*
Excrete
Urine
Me-Nam
NNMT
SAM
SAH
Acetylpolyamines
Acetyl-CoA
G
0
NAD+
Oxidize
100
–
10
*
*
150
at
*
C
150
10
3.2
*
*
5
q
WAT
Con ASO
NNMT ASO
6
Nampt
d3
o
10
–
0
n
*
0
me-Nam (mM) –
MDL (μM) –
me- DFMO me-Nam +
Nam
DFMO
10
Con me- SSAT me-Nam +
Nam siRNA SSAT siRNA
2
Con
20
2
4
0
*
30
*
6
2
*
40
4
8
4
Adipocytes
Oxygen consumption
Oxygen consumption
10
6
Ssat
6
Igx1a
m
Oxygen consumption
Odc
50
0
me-Nam
(mM)
Ssat
k
ChIP-qPCR
3.6
*
1
me1
Control
me-Nam
50
Nnmt Odc
j
WAT H3K4
h
Adipocytes
100
*
50
Con NNMT
ASO ASO
*
Amd1
150
100
0
Con ASO
NNMT ASO
2
mRNA levels (AU)
Activity
(pmol mg–1 h–1)
6
*
*
*
0
Con NNMT
ASO ASO
g
Con ASO
NNMT ASO
200
*
100
0
Con NNMT
ASO ASO
Adipocytes
mRNA levels (AU)
Diacetylspermine:creatinine
(nmol mg–1)
Methyl-H3K4/H3 (AU)
12
5
2
0
f
*
18
10
4
SAH SAM:SAH
Urine
15
6
*
Con ASO
NNMT ASO
200
Diacetylspermine (nM)
SAM
8
*
WAT
pmol per mg tissue
0.0
d
SSAT
20
*
10
1.0
i
nmol min–1 per 106 cells
*
*
c
ODC
nmol min–1 per 106 cells
2.0
e
mRNA levels (AU)
b
WAT
C
SAM and SAH levels (AU)
a
To determine whether the increased energy expenditure with NNMT
inhibition (Fig. 3) is polyamine-dependent, we used N1-methylnicotinamide
to inhibit NNMT activity in adipocytes. This induced oxygen consumption
(Fig. 4k–m). Knocking down Ssat (Supplementary Fig. 17), inhibiting ODC
activity8 or blocking PAO activity abolished N1-methylnicotinamideinduced oxygen consumption (Fig. 4k–m). Thus, NNMT inhibition in
adipocytes autonomously enhances oxygen consumption, and this depends
on polyamine flux.
The other substrate of the NNMT reaction is nicotinamide, an NAD1
precursor. Nnmt ASO treatment did not alter adipose and hepatic nicotinamide levels (Supplementary Fig. 18a, b). This is likely to be because
nicotinamide is metabolized to NAD1 in a salvage pathway, which is
controlled by the rate-limiting enzymes nicotinamide phosphoribosyltransferase (NAMPT) and three isoforms of nicotinamide mononucleotide adenylyltransferase (NMNAT1, NMNAT2 and NMNAT3)5.
Nnmt knockdown increased NAD1 levels per mg of adipose tissue
(Fig. 4n) and the expression of Nampt (Fig. 4o), cytosolic Nmnat2 and
mitochondrial Nmnat3, but not nuclear Nmnat1 (Supplementary Fig. 19).
NAD1 is a cofactor of SIRT1 deacetylase activity, and SIRT1 affects energy
metabolism5. Expression of SIRT1 target genes, including Cd36, catalase
(Cat), succinate dehydrogenase B (Sdhb) and growth-arrest and DNAdamage-inducible protein, were increased in adipose tissue of NnmtASO-treated mice25–28 (Fig. 4p), consistent with SIRT1 activation. As
Figure 4 | NNMT regulates SAM and NAD1 pathways in adipose tissue.
a, Adipose S-adenosylmethionine (SAM), S-adenosylhomocysteine (SAH) and
SAM:SAH ratio measured by LC–MS/MS (n 5 8 for control-ASO-treated
mice; n 5 12 for Nnmt-ASO-treated mice). b, c, ODC (b) and SSAT (c) activity
(n 5 10 per group). d, Amd1, Odc and Ssat mRNA expression in adipose
tissue of Nnmt-ASO- and control-ASO-treated mice (n 5 12 per group).
e, Urinary diacetylspermine:creatinine ratio (n 5 22 for control-ASO-treated
mice; n 5 29 for Nnmt-ASO-treated mice). f, g, Odc and Ssat mRNA levels
in 3T3-L1 adipocytes with Nnmt knockdown (n 5 9 per group) (f) and
N1-methylnicotinamide (me-Nam) (g) treatment (n 5 6 per group).
h, Diacetylspermine secretion from 3T3-L1 adipocytes treated with me-Nam
(n 5 10 per group). i, Expression of mono-, di- and tri-methylation of lysine
histone 3 (H3K4) normalized to total H3 levels in adipose tissue (n 5 8 per
group). j, H3K4me2 occupancy on Odc, Ssat genes and an open reading frame
free region (Igx1a) as a negative control in adipocytes measured by ChIP-qPCR
(n 5 12 per group). k–m, Oxygen consumption in adipocytes transfected
with control or Ssat siRNA, and treated with or without 10 mM me-Nam
(n 5 6 per group) (k); treated with 10 mM me-Nam with or without 5 mM
difluoromethylornithine (DFMO), a specific ODC inhibitor (n 5 6 per
group) (l); or treated with 10 mM me-Nam with or without MDL72527,
a specific PAO inhibitor (n 5 6 per group) (m). n, NAD1 levels (n 5 7
Con-ASO; n 5 12 Nnmt ASO). o, mRNA levels of nicotinamide
phosphoribosyltransferase (Nampt) (n 5 11 per group). p, mRNA levels of
SIRT1 target genes: Cd36, catalase (Cat), succinate dehydrogenase B (SdhB)
and growth arrest and DNA-damage-inducible protein (Gadd45a) in adipose
tissue of NNMT-ASO- and control-ASO treated mice (n 5 11 per group). Error
bars, 6 s.e.m., *P , 0.05, {P 50.06. q, Model of NNMT-regulated energy
expenditure in adipocytes. NNMT methylates nicotinamide (Nam), a
precursor of NAD1, using SAM as a methyl donor. SAM regulates polyamine
flux by providing substrates and modulating histone methylation. Polyamine
flux utilizes acetyl-CoA to generate acetyl-polyamines, which are oxidized
or excreted in the urine. Taken together, this results in adipose metabolic
substrate consumption and loss coupled with systemic alteration of energy
expenditure.
Nnmt-ASO-treated mice are leaner, NAD1 levels per adipocyte may
not be as elevated as per mg of adipose tissue. However, the increased
gene expression upstream and downstream of NAD1 strongly supports enhanced NAD1 flux in Nnmt-ASO-treated adipocytes. In liver,
Nnmt knockdown did not alter NAD1 levels or the expression of Nampt,
Nmnat1, Nmnat2 or Nmnat3 (Supplementary Fig. 20a, b). In spite of
this, Cd36, Cat and SdhB expression was decreased (Supplementary
Fig. 20c), indicating reduced SIRT1 activity. Consistent with this, PGC-1a
acetylation was enhanced in liver with Nnmt knockdown29 (Supplementary Fig. 20d). The decreased hepatic Sirt1 expression (Supplementary
Fig. 20e) may contribute to the reduced SIRT1 activity with Nnmt knockdown. Despite the changes in SIRT1 and PGC-1a activity, hepatic Pck1
and G6pc expression were not altered by Nnmt ASO treatment (Supplementary Fig. 21).
We discovered that NNMT is a novel regulator of adiposity and energy
expenditure. This involves modulating adipose SAM and NAD1, two
fundamental metabolites for energy metabolism. NNMT also regulates
hepatic energy metabolism (Supplementary Fig. 9), but most likely with
different mechanisms, as Nnmt knockdown did not alter hepatic SAM
and NAD1 levels. In adipocytes, SAM provides substrate for polyamine synthesis, and also modulates Odc and Ssat expression by modifying H3K4 methylation (Fig. 4q). SAM availability may alter histone
methylation in a methylation-site-specific manner rather than affecting global histone methylation10. For example, threonine-regulated
SAM specifically affects H3K4me3 in mouse embryonic stem cells30.
NNMT-regulated H3K4 methylation may have broader effects on gene
expression including effects associated with cancer10 and dementia, conditions in which NNMT activity is enhanced10,11.
Activation of adipose polyamine flux causes leanness by catalysing
polyamine acetylation to generate acetylpolyamines using acetyl-coA
as a metabolic substrate7. Acetylpolyamines are oxidized in a futile cycle
or excreted in the urine, thereby reducing acetyl-CoA in cells (Fig. 4q
and Supplementary Fig. 12). Although urinary excretion of acetylpolyamines may not cause significant total-body calorie loss, the metabolic
substrate consumption or loss in adipocytes seems to impact systemic
1 0 A P R I L 2 0 1 4 | VO L 5 0 8 | N AT U R E | 2 6 1
©2014 Macmillan Publishers Limited. All rights reserved
RESEARCH LETTER
energy expenditure. This is clearly demonstrated by leanness and increased
energy expenditure in adipose Ssat transgenic mice24. Promoting consumption or loss of adipose acetyl-CoA as a metabolic substrate in the
form of acetylpolyamines may be a novel strategy for obesity treatment
(Fig. 4q).
NNMT regulates SAM and NAD1 primarily in adipose tissue, but
not in liver, which has redundant regulatory pathways for SAM and
NAD1 metabolism. Hepatic SAM is largely regulated by glycine Nmethyltransferase22 and by methionine, an abundant SAM precursor
in liver. When methionine is abundant, NNMT regulates only SAH,
not SAM10. Liver NAD1 synthesis is controlled by a salvage pathway using
nicotinamide as a precursor and a de novo pathway using tryptophan5.
In contrast, adipose tissue barely expresses the key enzymes in the de
novo NAD1 synthesis pathway (data not shown). Therefore, adipose
NAD1 synthesis primarily relies on the salvage pathway using nicotinamide, for which NNMT is the only catabolic enzyme. The adiposeselective effects of NNMT inhibition on SAM and NAD1 levels are
advantageous for drug development because increased SAM in liver
causes hepatic steatosis and fibrosis22, and increased NAD1 may
enhance hepatic gluconeogenesis29.
In summary, NNMT is a unique regulator of adiposity by directly
altering NAD1 and SAM, which affect histone methylation, polyamine
flux and SIRT1 signalling. NNMT inhibition leads to metabolic substrate consumption or loss from adipocytes coupled with increased
energy expenditure in a cell-autonomous manner (Fig. 4q). These unique
features render NNMT an attractive target for treating obesity and type 2
diabetes.
METHODS SUMMARY
Online Content Any additional Methods, Extended Data display items and Source
Data are available in the online version of the paper; references unique to these
sections appear only in the online paper.
Received 25 January 2012; accepted 3 March 2014.
2.
3.
4.
5.
6.
7.
8.
10.
11.
12.
13.
14.
15.
16.
17.
18.
19.
20.
21.
22.
23.
Two Nnmt ASOs were selected from 80 ASOs based on Nnmt knockdown efficiency and no hepatic or renal toxicity. Treatment of HFD-fed mice with either of
the Nnmt ASOs resulted in leanness. The most potent Nnmt ASO was used for
subsequent studies. An ASO (ISIS 425851) with no complementarity to any known
gene sequence was used as the control. Nnmt ASOs and control ASOs were injected
(37.5 mg kg21 intraperitoneally) twice per week, starting 2 weeks after initiation of
HFD feeding. ODC and SSAT activities were measured under initial rate conditions with non-limiting substrate concentrations as described8. Metabolites were
measured using high-performance liquid chromatography (HPLC) with mass
spectrometry (MS) using isotope dilution or targeted tandem mass spectrometry
(LC–MS/MS)30. Diacetylspermine was measured using enzyme-linked immunosorbant assay (ELISA; Abnova). Two-tailed student’s t-tests were used for single
comparisons and analysis of variance (ANOVA) with Bonferroni-Holm post-hoc
tests for multiple comparisons. Statistical significance is assumed if P , 0.05. Data
are mean 6 s.e.m.
1.
9.
Shepherd, P. R. & Kahn, B. B. Glucose transporters and insulin action—
implications for insulin resistance and diabetes mellitus. N. Engl. J. Med. 341,
248–257 (1999).
Yang, Q. et al. Serum retinol binding protein 4 contributes to insulin resistance in
obesity and type 2 diabetes. Nature 436, 356–362 (2005).
Aksoy, S., Szumlanski, C. L. & Weinshilboum, R. M. Human liver nicotinamide
N-methyltransferase. cDNA cloning, expression, and biochemical
characterization. J. Biol. Chem. 269, 14835–14840 (1994).
Riederer, M., Erwa, W., Zimmermann, R., Frank, S. & Zechner, R. Adipose tissue as a
source of nicotinamide N-methyltransferase and homocysteine. Atherosclerosis
204, 412–417 (2009).
Houtkooper, R. H., Canto, C., Wanders, R. J. & Auwerx, J. The secret life of NAD1: an
old metabolite controlling new metabolic signaling pathways. Endocr. Rev. 31,
194–223 (2010).
Teperino, R., Schoonjans, K. & Auwerx, J. Histone methyl transferases and
demethylases; can they link metabolism and transcription? Cell Metab. 12,
321–327 (2010).
Jell, J. et al. Genetically altered expression of spermidine/spermine N1acetyltransferase affects fat metabolism in mice via acetyl-CoA. J. Biol. Chem. 282,
8404–8413 (2007).
Pirinen, E. et al. Enhanced polyamine catabolism alters homeostatic control of
white adipose tissue mass, energy expenditure, and glucose metabolism. Mol. Cell.
Biol. 27, 4953–4967 (2007).
24.
25.
26.
27.
28.
29.
30.
Sartini, D. et al. Nicotinamide N-methyltransferase in non-small cell lung cancer:
promising results for targeted anti-cancer therapy. Cell Biochem. Biophys. 67,
865–873 (2013).
Ulanovskaya, O. A., Zuhl, A. M. & Cravatt, B. F. NNMT promotes epigenetic
remodeling in cancer by creating a metabolic methylation sink. Nature Chem. Biol.
9, 300–306 (2013).
Williams, A. C., Cartwright, L. S. & Ramsden, D. B. Parkinson’s disease: the
first common neurological disease due to auto-intoxication? QJM 98, 215–226
(2005).
Lee, Y. H. et al. Microarray profiling of isolated abdominal subcutaneous
adipocytes from obese vs non-obese Pima Indians: increased expression of
inflammation-related genes. Diabetologia 48, 1776–1783 (2005).
Salek, R. M. et al. A metabolomic comparison of urinary changes in type 2 diabetes
in mouse, rat, and human. Physiol. Genomics 29, 99–108 (2007).
Yaguchi, H., Togawa, K., Moritani, M. & Itakura, M. Identification of candidate genes
in the type 2 diabetes modifier locus using expression QTL. Genomics 85,
591–599 (2005).
Wu, C. et al. BioGPS: an extensible and customizable portal for querying and
organizing gene annotation resources. Genome Biol. 10, R130 (2009).
Alexander, J., Chang, G. Q., Dourmashkin, J. T. & Leibowitz, S. F. Distinct phenotypes
of obesity-prone AKR/J, DBA2J and C57BL/6J mice compared to control strains.
Int. J. Obes. (Lond.) 30, 50–59 (2006).
Svenson, K. L. et al. Multiple trait measurements in 43 inbred mouse strains
capture the phenotypic diversity characteristic of human populations. J. Appl.
Physiol. 102, 2369–2378 (2007).
Grubb, S. C., Maddatu, T. P., Bult, C. J. & Bogue, M. A. Mouse phenome database.
Nucleic Acids Res. 37, D720–D730 (2009).
Bennett, C. F. & Swayze, E. E. RNA targeting therapeutics: molecular mechanisms
of antisense oligonucleotides as a therapeutic platform. Annu. Rev. Pharmacol.
Toxicol. 50, 259–293 (2010).
Erion, D. M. et al. SirT1 knockdown in liver decreases basal hepatic glucose
production and increases hepatic insulin responsiveness in diabetic rats.
Proc. Natl Acad. Sci. USA 106, 11288–11293 (2009).
Kang-Lee, Y. A. et al. Metabolic effects of nicotinamide administration in rats.
J. Nutr. 113, 215–221 (1983).
Varela-Rey, M. et al. Fatty liver and fibrosis in glycine N-methyltransferase
knockout mice is prevented by nicotinamide. Hepatology 52, 105–114 (2010).
Pegg, A. E. & Casero, R. A., Jr. Current status of the polyamine research field.
Methods Mol. Biol. 720, 3–35 (2011).
Koponen, T. et al. The activation of hepatic and muscle polyamine catabolism
improves glucose homeostasis. Amino Acids 42, 427–440 (2011).
Alcendor, R. R. et al. Sirt1 regulates aging and resistance to oxidative stress in the
heart. Circ. Res. 100, 1512–1521 (2007).
Finley, L. W. et al. Succinate dehydrogenase is a direct target of sirtuin 3
deacetylase activity. PLoS ONE 6, e23295 (2011).
Kobayashi, Y. et al. SIRT1 is critical regulator of FOXO-mediated transcription in
response to oxidative stress. Int. J. Mol. Med. 16, 237–243 (2005).
Stein, S. et al. SIRT1 decreases Lox-1-mediated foam cell formation in
atherogenesis. Eur. Heart J. 31, 2301–2309 (2010).
Rodgers, J. T. et al. Nutrient control of glucose homeostasis through a complex of
PGC-1a and SIRT1. Nature 434, 113–118 (2005).
Shyh-Chang, N. et al. Influence of threonine metabolism on S-adenosylmethionine
and histone methylation. Science 339, 222–226 (2013).
Supplementary Information is available in the online version of the paper.
Acknowledgements We thank R. Weinshilboum for NNMT antibody; P. Woster for
DFMO; M. Yuan for tandem mass spectrometry; A. Karppinen, A. Korhonen, T. Reponen,
A. Uimari, S. Pirnes-Karhu and T. Koponen for measurements of ODC and SSAT activity;
C. Semenkovich and S. Fried for protocols for FAS activity measurements; and
P. Aryal for assistance with real-time qPCR. D.Kr. is supported by the Deutsche
Forschungsgemeinschaft (KR 3475/1-1) and American Heart Association (AHA)
(09POST2250499); Q.Y. is a Klarman Scholar at the Beth Israel Deaconess Medical
Center. This work is supported by grants from the NIH (R37 DK43051, P30 DK57521)
and a grant from the JPB foundation to B.B.K.; grants from the NIH (KO8 DK090149,
R01 DK100385, BNORC P30 DK046200 and NORCH P30 DK040561) to Q.Y.; grant
RO1 DK69966 to P.P.; P01CA120964 and P30CA006516-46 to J.M.A.; AHA
13SDG14620005 and P&F P30 DK0460200 to D.K.; the Ellison Medical Foundation
New Scholar in Aging Award to A.A.S.; and academy of Finland grant 118590 to L.A.
Author Contributions Q.Y. discovered NNMT from the initial microarray analysis. D.Kr.,
Q.Y. and B.B.K designed the experiments, interpreted the data and wrote the paper.
D.Ko. performed oxygen consumption experiments in adipocytes. A.S.B. performed
CLAMS studies. L.Z., T.C.P., F.G., YC.W. and O.D.P. provided assistance with cell culture
and animal experiments. O.D.P. also performed the microarray studies. J.T.R. and P.P.
performed PGC-1a acetylation experiments. E.P. and L.A. provided expertise on
polyamines and measured ODC and SSAT activity. Y.C. and A.A.S. measured
nicotinamide and metabolites. J.M.A. performed metabolomics studies. B.P.M and S.B.
provided Nnmt and control ASOs.
Author Information The microarray data from adipose tissue of adipose-specific
knockout and adipose-specific overexpression have been published by our laboratory
and are available in NCBI Gene Expression Omnibus under accession number
GSE35378. Reprints and permissions information is available at www.nature.com/
reprints. The authors declare competing financial interests: details are available in the
online version of the paper. Readers are welcome to comment on the online version of
the paper. Correspondence and requests for materials should be addressed to B.B.K.
([email protected]) or Q.Y. ([email protected]).
2 6 2 | N AT U R E | VO L 5 0 8 | 1 0 A P R I L 2 0 1 4
©2014 Macmillan Publishers Limited. All rights reserved
LETTER RESEARCH
METHODS
Mice. Adipose-specific Glut4-knockout and Glut4-overexpressing mice were described
previously31,32. All other mice were purchased from Jackson Laboratories or Charles
River Laboratories. For measurements of Nnmt expression in adipose tissue and
liver, the ob/ob and db/db mice were killed at 10 to 12 weeks of age. High-fat diet
(HFD)-fed male mice in C57BL/6 background were treated with a HFD for 12
weeks starting at 6 to 8 weeks of age. For Nnmt ASO experiments, mice were fed
standard chow providing 17% calories from fat (LabDiet Formulab 5008) or a HFD
providing 55% calories from fat (Harlan Teklad, TD93075) starting at 6 to 7 weeks
of age. Nnmt and control ASOs were injected at a dose of 37.5 mg kg21 intraperitoneally twice per week starting 2 weeks after the initiation of HFD feeding. Mouse
studies were conducted in accordance with federal guidelines and were approved
by the Beth Israel Deaconess Medical Centre (BIDMC) Institutional Animal Care
and Use Committee.
Selection of mouse Nnmt ASO. Rapid-throughput screens were performed in
primary hepatocytes to identify mouse Nnmt antisense oligonucleotides. In brief,
80 ASOs were designed to the Nnmt mRNA sequence and tested in primary hepatocytes to identify Nnmt antisense oligonucleotides. Nnmt gene knockdown was
screened by quantitative PCR. Eight ASOs were selected and further characterized
in a dose–response screen in vivo. Two Nnmt ASOs with greatest effects on Nnmt
knockdown in liver and adipose tissue with no toxicity to liver and kidney were
used to treat mice on a HFD. Treatment with either of the Nnmt ASOs resulted
in leanness compared with a control-ASO-treated group. The most potent Nnmt
ASO (GAAATGAACCAGCAGGCCTT) was chosen for subsequent studies. A control ASO (ISIS 425851), which has no complementarity to any known gene sequence,
was used for the control group. Nnmt and control ASOs have a uniform phosphorothioate backbone and a 20-base chimaeric design with a 2’-O-(methoxy)-ethyl (2’MOE) modification on the first five and the last five bases. This modification enhances
their binding affinity to complementary sequences and their resistance to the action
of nucleases. ASOs may downregulate their target genes through an RNase H-dependent
cleavage mechanism or a non-RNA-degrading mechanism by blocking translation
of mRNA. Two pathways may be involved ASO entry into cells: first, a productive
pathway using a vesicular transport system; and second, a non-productive pathway
that results in accumulation of ASOs in lysosomal structures19.
CLAMS. Energy expenditure was evaluated using a Comprehensive Lab Animal
Monitoring System (Columbia Instruments)33. HFD-fed mice were treated with
Nnmt- or control-ASO for 3 weeks. Body weights were not significantly different
when the mice were subjected to CLAMS study. The mice were acclimated in the
metabolic chambers for 2 days before the experiments. CO2 and O2 levels were
collected every 32 min for each mouse during a period of 3 days. Food intake and
activity were measured at regular intervals.
RNA extraction and quantitative PCR. RNA extraction and Taqman quantitative PCR were performed as described previously2. All Taqman primers were purchased from Applied Biosytems, except for the probe for adenosylmethionine
decarboxylase (Amd1), which was designed using IDT software: forward 59-GAG
AGTGGAATTCGTGACCTG-39; probe 59-ACTGTTCAATCCTTGTGGCTAC
TCGATG-39; reverse 59-TTCTGGTTCTGGAGTGATGTG-39.
Western blot analysis and immunoprecipitation. NNMT was detected using a
chicken anti-NNMT antibody from GenWay Biotech or the rabbit anti-NNMT
antibody kindly provided by R. Weinshilboum34. Goat anti-UCP1 (M-17) and rabbit
anti-PGC1a (H-300) were from Santa Cruz Biotechnology. Rabbit anti-acetylated
lysine was from Cell Signaling Technology. For detecting PGC-1a acetylation,
PGC-1a was immunoprecipitated from liver or cultured-cell lysates with antiPGC-1a. The precipitated protein was subjected to western blot analysis using
anti-acetylated lysine.
Body composition, body temperature, and faecal lipid excretion. Body composition was analysed in mice treated with Nnmt and control ASO for 5 weeks
using an EchoMRI 3-in-1 instrument (Echo Medical Systems). To measure body
composition after fasting, food was removed from Nnmt-ASO- or control-ASOtreated mice for 16 h. Body temperature was measured intrarectally using a Thermalert
TH-5 thermometer (Physitemp). To analyse faecal lipid excretion, lipid content of
faeces was extracted using chloroform:methanol (2:1) and air-dried under a fume
hood.
Histology and determination of cell size. Tissues were fixed in 10% buffered
formalin and subjected to H&E staining. To measure adipocyte cross-sectional area,
four fields of vision of H&E-stained adipose tissue were digitally photographed
under a microscope. Images were analysed using the software ImageJ (National
Institutes of Health) using a previously published technique35. Images were converted to 16-bit grayscale and inverted; a threshold was applied to identify cell
boundaries, and the cells were analysed with the ‘Analyze Particles’ command to
obtain adipocyte area. Adipocyte volume was calculated from the radius using the
formula v 5 4/3pr3.
Intraperitoneal glucose tolerance test. The food was removed from mice for 5 h.
Intraperitoneal glucose tolerance test (IPGTT) was performed by intraperitoneal
injection of 1 mg glucose per g of body weight. Glucose levels were measured at the
indicated times.
Feed efficiency. Total calorie intake was computed from the measured food intake
during the second and third weeks of ASO treatment. Feed efficiency was expressed
as the body weight gain divided by the total calorie intake between the start and the
end of the food intake measurement36.
Urinary diacetylspermine measurement. Spot urine was collected from NnmtASO- and control-ASO treated mice. Urinary diacetylspermine levels were measured
using an ELISA kit from Abnova. An enzymatic mouse creatinine assay (Crystal
Chem) was used for measuring creatinine levels. Because the mice drank water ad
libitum, the urinary diacetylspermine levels were corrected by creatinine levels.
Urinary creatinine levels were not different between Nnmt-ASO- and controlASO-treated mice.
ODC and SSAT activity. ODC and SSAT activities were assayed from tissue supernatant fractions under initial rate conditions with non-limiting substrate concentrations as described previously37,38. In brief, ODC was assayed by measuring the
release of 14CO2 in a reaction with DL-[1-14C]ornithine as the substrate. SSAT was
assayed by measuring the formation of acetylated spermidine in a reaction with
14
C-CoA and spermidine as co-substrates.
NAD1 measurement. NAD1 levels were determined according to instructions
provided with the NAD/NADH assay kit purchased from Abcam.
Histone methylation and ChIP-qPCR. Histone protein was extracted from adipose tissue treated with Nnmt ASO and control ASO using the EpiQuik Total Histone
Extraction Kit from Epigentek. Eight types of histone methylation were measured
by western blot analysis using the following antibodies: H3K4me2, H3K9me2,
H3K27me2, H3K36me2 and H3K79me2 from Cell Signaling; and H3K4me1,
H3K4me3 and H3K9me3 from Abcam. The levels of histone methylation were
normalized to total H3 expression. For ChIP, chromatin was first extracted from
3T3-L1 adipocytes treated with or without 10 mM N-methylnicotinamide for 48 h.
Immunoprecipitation was performed using EpiQuik Methyl-Histone H3-K4 ChIP
kit from Epigentek. Enrichment of methylated H3K4 on Odc and Ssat genes was
measured by real-time PCR using EpiTect ChIP qPCR primers from Qiagen (Odc,
GPM1030188(1)01A; Ssat, GPM1055920(1)01A). An open reading frame free
region (Igx1a) was used as a negative control for ChIP-qPCR. Control IgG showed
minimum background among all the regions analysed.
Targeted mass spectrometry. Metabolites nicotinamide, S-adenosylmethionine
(SAM), S-adenosylhomocysteine (SAH), AMP and ATP were measured using tandem mass spectrometry30,39. Metabolite extracts using 80% methanol (280 uC)
were dried by nitrogen. Samples were re-suspended using 20 ml LC/MS grade
water, of which 10 ml were injected and analysed using a 5500 QTRAP triple
quadrupole mass spectrometer (AB/Sciex) coupled to a Prominence HPLC system
(Shimadzu) via selected reaction monitoring (SRM). The dwell time was 4 ms per
SRM transition and the total cycle time was 1.89 s. Approximately 8 to 11 data
points were acquired per detected metabolite. Samples were delivered to the MS
using a 4.6 mm internal diameter 3 10 cm Amide XBridge HILIC column (Waters)
at 300 ml min21. Gradients were run starting from 85% buffer B (HPLC grade
acetonitrile) to 35% B from 0 to 3.5 min; 35% B to 2% B from 3.5 to 11.5 min; 2% B
was held from 11.5 to 16.5 min; 2% B to 85% B from 16.5 to 17.5 min; 85% B was
held for 7 min to re-equilibrate the column. Buffer A consisted of 20 mM ammonium hydroxide and 20 mM ammonium acetate (pH 9.0) in 95:5 water:acetonitrile. Peak areas from the total ion current for each metabolite SRM transition were
integrated using MultiQuant v2.0 software (AB/Sciex).
Cell culture. 3T3-L1 cells were differentiated to adipocytes using a standardized
protocol40. Five to six days after differentiation, cells were transfected using Amaxa
electroporation41. Hepatoma H2.35 cells were transduced with NNMT or b-galactosidase adenovirus for 24 h, and oxygen consumption was measured as described
below.
Oxygen consumption. Oxygen consumption was measured with a Clark-type oxygen electrode (Rank Brothers). Cultured cells were trypsinized, counted in a hemocytometer, spun down, and resuspended in respiration buffer (PBS, 2% BSA, 4.5 g
l-1 glucose, 120 mg l21 sodium pyruvate) to 1 3 106 ml21. Partial oxygen pressure
was recorded using a Rank Brothers digital model 10 controller and a PowerLab
4/30 data acquisition system (ADInstruments)42.
Statistical test. All data are expressed as mean mean 6 s.e.m. Two-tailed Student’s
t-tests were used for single comparisons. Analyses of variance were performed
followed by Bonferroni-Holm post-hoc tests for multiple comparisons. Statistical
significance is assumed at P , 0.05. Sample size was chosen based on results from
pilot studies and our extensive experience in investigating metabolic physiology in
mice. The sample exclusion criteria were determined before experiments for technical failures such as mis-injection of glucose in glucose tolerance test. For randomization, experimental groups of mice were stratified according to body weight
©2014 Macmillan Publishers Limited. All rights reserved
RESEARCH LETTER
using an algorithm based on Kullback–Leibler divergences43. The CLAMS study,
metabolic analyses and oxygen consumption in adipocytes were carried out in a
blinded fashion, others were not.
31. Abel, E. D. et al. Adipose-selective targeting of the GLUT4 gene impairs insulin
action in muscle and liver. Nature 409, 729–733 (2001).
32. Shepherd, P. R. et al. Adipose cell hyperplasia and enhanced glucose disposal in
transgenic mice overexpressing GLUT4 selectively in adipose tissue. J. Biol. Chem.
268, 22243–22246 (1993).
33. Bubolz, A. H. et al. Activation of endothelial TRPV4 channels mediates flowinduced dilation in human coronary arterioles: role of Ca21 entry and
mitochondrial ROS signaling. Am. J. Physiol. Heart Circ. Physiol. 302, H634–H642
(2012).
34. Yan, L., Otterness, D. M., Craddock, T. L. & Weinshilboum, R. M. Mouse liver
nicotinamide N-methyltransferase: cDNA cloning, expression, and nucleotide
sequence polymorphisms. Biochem. Pharmacol. 54, 1139–1149 (1997).
35. Chen, H. C. & Farese, R. V., Jr. Determination of adipocyte size by computer image
analysis. J. Lipid Res. 43, 986–989 (2002).
36. Bence, K. K. et al. Neuronal PTP1B regulates body weight, adiposity and leptin
action. Nature Med. 12, 917–924 (2006).
37. Bernacki, R. J. et al. Preclinical antitumor efficacy of the polyamine analogue N1,
N11-diethylnorspermine administered by multiple injection or continuous
infusion. Clin. Cancer Res. 1, 847–857 (1995).
38. Ja¨nne, J. & Williams-Ashman, H. G. On the purification of L-ornithine decarboxylase
from rat prostate and effects of thiol compounds on the enzyme. J. Biol. Chem. 246,
1725–1732 (1971).
39. Yang, X. et al. Using tandem mass spectrometry in targeted mode to identify
activators of class IA PI3K in cancer. Cancer Res. 71, 5965–5975 (2011).
40. Yan, Q. W. et al. The adipokine lipocalin 2 is regulated by obesity and promotes
insulin resistance. Diabetes 56, 2533–2540 (2007).
41. Eguchi, J. et al. Interferon regulatory factors are transcriptional regulators of
adipogenesis. Cell Metab. 7, 86–94 (2008).
42. Pulinilkunnil, T. et al. Adrenergic regulation of AMP-activated protein kinase in
brown adipose tissue in vivo. J. Biol. Chem. 286, 8798–8809 (2011).
43. Endo, A., Nagatani, F., Hamada, C. & Yoshimura, I. Minimization method for
balancing continuous prognostic variables between treatment and control groups
using Kullback–Leibler divergence. Contemp. Clin. Trials 27, 420–431 (2006).
©2014 Macmillan Publishers Limited. All rights reserved
© Copyright 2026 ExpyDoc