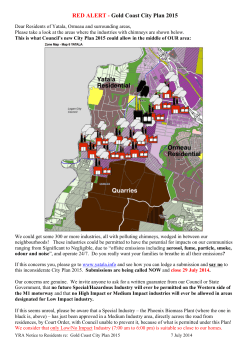
[OIL ]
www.platts.com
NORTH AMERICAN CRUDE AND PRODUCTS SCAN
Volume 2 / Issue 236 / December 9, 2014
US Gulf Coast waterborne 3:15 Eastern Time
Change
RVP
Gasoline (¢/gal)
Unl 87
PGACU00 161.61–161.71161.660+3.550
PGACURV13.5
PGAAZ00 168.03–168.13168.080+3.270
PGAAZRV13.5
Unl 89
PGAIX00 177.66–177.76177.710+2.850
PGAIXRV13.5
Unl 93
AAWES00 157.41–157.51157.460+2.850
AAWESRV13.5
CBOB 87*
AAWET00 177.56–177.66177.610+1.750
AAWETRV13.5
CBOB 93*
Market Commentary
(PGA page 330)
*RVP after 10% ethanol blend
Middle Distillates (¢/gal)
Jet Kero 54
Jet Kero 55
Jet Kero ULS
ULSD
Gasoil No.2
Heavy Ends ($/barrel)
Slurry
Resid 1%
Resid 3%
RMG 380
(PGA page 430)
PJABM00 189.80–189.90189.850-2.950
PJABN00 193.30–193.40193.350-2.950
AAVTK00 204.05–204.15204.100-2.950
AATGZ00 192.80–192.90192.850+2.600
POAEE00 187.05–187.15187.100+7.300
(PGA page 530)
PPAPW0053.59–53.61
PUAAI0057.24–57.26
PUAFZ0052.54–52.56
PUBDM0053.81–53.83
53.600
+0.070
57.250
+0.020
52.550
+0.120
53.820
+0.040
US Blendstocks at 3:15 pm Eastern Time (¢/gal)
(PGF page 760)
Change
Change
Change
USGC
FOB Cargo
Naphtha AAXJP00 151.61–151.71151.660+4.050
Naphtha ($/mt)
AAXJU00 530.79–530.89530.840
+14.180
USGC Cargo
Naphtha
PAAAC00 149.61–149.71149.660+4.050
Heavy Naphtha
AAKWL00 152.36–152.46152.410+3.550
Benzene
PHAAE00 275.95–276.05276.000
-11.000
USGC FOB Parcel (¢/gal)
vs Mt Belvieu non-Targa natural gasoline
Light Straight Run Naphtha
AAXQK00126.000
-1.500
AAXQN003.000
-2.000
Light Straight Run Naphtha ($/mt) AAXQM00505.260
-6.020
USGC Barge (¢/gal)
vs Mt Belvieu non-Targa natural gasoline
Naphtha
AALPG00 150.61–150.71150.660+4.050
Heavy Naphtha
AALPI00 153.36–153.46153.410+3.550
Paraffinic Naphtha
AAYEU00 464.90–465.00464.950-5.500
AAYEW003.750
-2.000
MTBE
PHAKY00 237.00–237.10237.050+5.900
Xylene
PHBHN00 229.95–230.05230.000 0.000
Toluene
PHAAR00 234.95–235.05235.000 0.000
FOB USGC pipeline
vs USGC waterborne
vs USGC pipeline
87 unleaded
87 unleaded
Alkylate
AAXBA00197.990
+3.690
AAFIE0036.0000.000
AAXBD0037.7500.000
Raffinate
AAXBB00135.240
+3.690
AAJMU00--26.7500.000
AAXBE00-25.0000.000
Reformate
AAXBC00223.740
+3.690
AAJMV0061.7500.000
AAXBF0063.5000.000
US Gulf Coast Sweet Crude (PGA page 290)
The cash differentials for offshore US Gulf Coast sweet
crudes were unchanged Tuesday, despite the NYMEX
crude/ICE Brent spread narrowing, due to a wellbalanced market, sources said. The NYMEX crude/ICE
Brent spread narrowed 17 cents/b to $2.98/b, as of
the Platts 3:15 pm EST assessment. A narrower NYMEX
crude/ICE Brent spread typically indicates that US crude
differentials should decrease, in order for WTI-based
crudes to remain competitive with Brent-based crudes.
The narrower spread came as the NYMEX crude contract
was supported by a weaker dollar. The US Dollar Index
on ICE fell to 88.16 early on in the session, and was
trading around 88.7 around the NYMEX settle. The index
Subscriber notes
(PGA page 1500)
Platts wishes to clarify that during its Market on Close
assessment process, it will only consider for publication
and assessment transactional interest that is expressed
by participants for bids or offers that have already been
published by Platts. Interest in bids or offers at prices that
have not been published, and therefore may not be fully
available for testing in the marketplace as a whole, may be
disregarded. Should a buyer lower its bid or a seller increase
its offer, an expression to trade at a previously published
level will not be considered. Platts’ editorial processes require
full clarity when communicating bids/offers and intentions
to trade. When expressing an intention to hit a bid or lift an
offer in the MOC processes, any message must include the
specific price of the trade and the name of the counterparty.
Platts’ MOC assessment process considers firm bids, firm
offers, and transactions that are transparent and firm. Buyers
(continued on page 8)
NORTH AMERICAN CRUDE AND PRODUCTS SCAN
US Gulf Coast FOB cargo 3:15 Eastern Time
had rallied to 89.55 Monday, the highest since March
Change
2009. The differential for Light Louisiana Sweet — the
(PGA page 156)
Middle Distillates (¢/gal)
light sweet benchmark for US Gulf Coast crude — was
Export ULSD
AAXRV00188.923
+0.947
NEW
assessed flat on the day at WTI plus $2.55/b, where
AAXRW00591.141
+2.963
Export ULSD ($/mt)
it traded, and Heavy Louisiana Sweet remained at WTI
US Feedstocks
(PGF page 764)
minus 50 cents/b, following a regrade trade at $3.05/b
Change
below LLS. Meanwhile, the WTI Midland differential
US Gulf Coast (¢/gal)
VGO 0.5% vs 70/30 midpoint PKAAO00-0.48/-0.38 -0.430-3.070
softened on a slight decline in demand, falling 5 cents/b
VGO 1% vs 70/30 midpoint
PKAAQ00-1.67/-1.57 -1.620
-3.070
to be assessed at WTI minus 95 cents/b, following a
VGO 2.0% vs 70/30 midpoint PKAAS00-2.27/-2.17 -2.220-3.080
trade at WTI minus $1/b and then was bid there. Light
US Atlantic Coast (¢/gal)
VGO 0.5% vs 70/30 midpoint AAJMW00-0.98/-0.88 -0.930-3.070
Houston Sweet increased 10 cents/b to be assessed
VGO 1% vs 70/30 midpoint
PKAAR00-2.17/-2.07 -2.120
-3.070
at $1.30/b below the Light Louisiana Sweet differential,
VGO 2.0% vs 70/30 midpoint PKAAT00-2.77/-2.67 -2.720-3.080
following a bid at LLS minus $1.40/b for West Texas
US West Coast (¢/gal)
VGO 0.5% vs 70/30 midpoint AAJMX005.90/6.00 5.950
+1.460
Intermediate quality crude from Midland, Texas, in
VGO 2.0% vs 70/30 midpoint AAJNA004.12/4.22 4.170
+1.460
Magellan’s East Houston terminal. The differentials for
US Gulf Coast ($/barrel)
Bakken at Clearbrook and Bakken at Guernsey weakened
VGO 0.5% vs WTI M1
AAJNY00 7.000
0.000
VGO 1% vs WTI M1
AAWLU00 6.500
0.000
Tuesday on the back of a deal, while the Williston Basin
VGO 2.0% vs WTI M1
AAWLV00 6.250
0.000
Bakken crude followed the market structure of similar
LS straight Run vs WTI M1
AALFS002.95/3.05 3.000
+0.500
HS straight Run vs WTI M1
AALGC00-5.55/-5.45 -5.500
+0.500
crudes in the Canadian market, which weakened slightly.
LS straight Run vs WTI M2
AALFT002.95/3.05 3.000
+0.500
The differential for Bakken at Clearbrook was assessed
HS straight Run vs WTI M2
AALGE00-5.55/-5.45 -5.500
+0.500
down 25 cents at WTI CMA minus $5.90/b, based on
US Atlantic Coast ($/barrel)
a deal at that level and the differential for Bakken at
LS straight Run vs WTI M1
AALFU002.45/2.55 2.500
+0.500
HS straight Run vs WTI M1
AALGG00-6.05/-5.95 -6.000
+0.500
Guernsey followed suit, falling 25 cents as well to WTI
LS straight Run vs WTI M2
AALFV002.45/2.55 2.500
+0.500
CMA minus $3.40/b. The decrease in light Canadian
HS straight Run vs WTI M2
AALGI00-6.05/-5.95 -6.000
+0.500
crudes pushed down the Williston Basin Bakken crude.
US Gulf Coast Benchmarks at 3:15 pm
The differential for Williston Basin Bakken crude fell by 5
US Gulf Coast (¢/gal)
(PGF page 752)
cents given the decrease in Mixed Sweet. Williston Basin
No. 2 Waterborne
POAEE00187.100
Bakken crude was assessed at $54.43/b Tuesday.
PGACU00161.660
Gasoline Waterborne
70-30 Midpoint*
US Gulf Coast Sour Crude
(PGA page 292)
The differentials for offshore US Gulf Coast sour crudes
softened Tuesday, due to a decline in demand and a
narrower NYMEX crude/ICE Brent spread. The Mars
differential was assessed 15 cents/b lower at WTI
minus $1.35/b, after it traded at WTI minus $1.40/b
and then was bid there. The Poseidon differential
dropped 25 cents/b to be assessed at WTI minus
$2.30/b, where it traded. Southern Green Canyon
declined 15 cents/b to WTI minus $2/b, following
a trade at that level. The Bonito and Eugene Island
differentials each fell 5 cents/b to be assessed at WTI
AAJNW00169.292
US Gulf Coast Barge (¢/gal)
Naphtha vs USGC unleaded gasoline
AASGZ00-11.000
Heavy naphtha vs USGC unleaded gasoline AASHD00-8.250
US Gulf Coast Cargo (¢/gal)
Naphtha vs USGC unleaded gasoline
AAJNC00-12.000
Heavy naphtha vs USGC unleaded gasoline AASHC00-9.250
US Gulf Coast ($/barrel)
WTI Cushing M2 (Feb)
Naphtha vs WTI
No. 2 vs. USGC 3% resid*
Straight run vs. USGC VGO
HS VGO vs Maya**
Naphtha vs Maya
3-2-1 settlement (JAN –JAN )
3-2-1 3:15pm ET
PCACH0063.920
AAJND00-1.063
AAJNZ0026.032
AAJNE00-4.002
AASHB0017.714
AASHA006.127
AAJNX0013.620
AAUHD0013.550
* ¢/gal prices converted to barrels before comparison. ** Differential reached
by taking VGO differential to 70-30 midpoint, calculating outright price, converting
it to barrels, and comparing to WTI or Maya.
Copyright © 2014, McGraw Hill Financial
december 9, 2014
European feedstocks and blendstocks
Change
(PGF page 1760)
CIF Northwest Europe cargo ($/mt)
VGO 0.5-0.6%
AAHMZ00462.50–463.50 463.000+7.500
VGO 2%
AAHND00453.50–454.50 454.000+7.000
Straight Run 0.5-0.7% AAJNT00398.75–399.25 399.000+1.250
FOB Northwest Europe cargo ($/mt)
VGO 0.5-0.6%
AAHMX00454.50–455.50 455.000+7.500
VGO 2%
AAHNB00445.50–446.50 446.000+7.000
Straight Run 0.5-0.7% PKABA00407.00–408.00 407.500+7.000
FOB Rotterdam barge ($/mt)w
MTBE*
PHALA00805.75–806.25 806.000
+21.000
VGO 0.5-0.6%
AAHNF00458.00–459.00 458.500
+11.000
VGO 2%
AAHNI00445.50–446.50 446.000+7.000
* FOB Amsterdam-Rotterdam-Antwerp
Blend value
Change
(¢/gal)
MTBE
Alkylate
Raffinate
Reformate
Xylene
Toluene
(PGF page 760)
AATAR0067.18
AASFE0031.39
AATAS00--55.34
AASFG0062.92
AASFH0068.27
AASFI0067.15
-2.340
-0.090
+3.610
-0.750
-0.990
-1.010
US crudes at 16:30 London MOC close
Change
($/barrel)
WTI M1 (Jan)
WTI M2 (Feb)
WTI M3 (Mar)
LLS M1 (Jan)
LLS M2 (Feb)
Mars M1 (Jan)
Mars M2 (Feb)
WTI EFP* M1 (Jan)
WTI EFP* M2 (Feb)
WTI EFP* M3 (Mar)
LLS M1 v WTI M1
LLS M2 v WTI M2
Mars M1 v WTI M1
Mars M2 v WTI M2
(PGA page 1240)
AAQAR0063.89–63.91
AAQAT0064.05–64.07
AAQAV0064.21–64.23
AAQBB0066.33–66.37
AAQBD0066.44–66.48
AAQAX0062.48–62.52
AAQAZ0062.64–62.68
AAQAS00-0.01/0.01
AAQAU00-0.01/0.01
AAQAW00-0.01/0.01
AAQBC002.44/2.46
AAQBE002.39/2.41
AAQAY00-1.41/-1.39
AAQBA00-1.41/-1.39
63.900
+0.390
64.060
+0.420
64.220
+0.400
66.350
+0.290
66.460
+0.320
62.500
+0.140
62.660
+0.220
0.000
0.000
0.000
0.000
0.000
0.000
2.450
-0.100
2.400
-0.100
-1.400
-0.250
-1.400
-0.200
*EFP vs NYMEX light sweet crude futures
US crudes at 3:15 pm Eastern Time
Change
($/barrel)
WTI M1 (Jan 15)
WTI M2 (Feb 15)
WTI M3 (Mar 15)
2
(PGA page 210)
PCACG0063.76–63.78
PCACH0063.91–63.93
AAGIT0064.06–64.08
63.770
+0.660
63.920
+0.670
64.070
+0.630
NORTH AMERICAN CRUDE AND PRODUCTS SCAN
plus 65 cents/b, following an offer for Bonito at WTI
plus 70 cents/b. Thunder Horse was unchanged at WTI
plus 55 cents/b. In the Permian Basin, the West Texas
Sour differential was 5 cents/b lower, to be assessed
at WTI minus 60 cents.
Canada East Coast crudes
(PGA page 296)
Differentials for crude produced off the coast of
Newfoundland and Labrador fell 3 cents/b for a second
day in a row Tuesday on weakness in similar West
African grades. Despite softer freight rates, Nigerian
crudes are still under pressure, with more than 40
cargoes available for loading from the December and
January programs. That abundant supply has been
bearish for similar waterborne crudes like those
produced off the Canadian East Coast. Hibernia was
assessed at Dated Brent plus 8 cents/b, Terra Nova
was assessed at Dated Brent minus 44 cents/b, and
White Rose was assessed at Dated Brent plus $1.56/b.
There are currently a total of eight crude oil cargoes
headed for Canadian East Coast locations, according
to Platts cFlow ship-tracking software. Two cargoes
are heading to Quebec, two to Nova Scotia, three to
Newfoundland, and one to New Brunswick.
Canada pipeline crudes
(PGA page 298)
Abundant supply continued to push down Canadian
crude differentials Tuesday, though the source of
the weakness came from an unusual place: West
Africa. More than 40 available cargoes of light sweet
Nigerian crude are still available, pressuring the
entire crude complex, including a virtually land-locked
one on the other side of the globe. “There’s a lot of
alternatives for buyers out there,” one trader said.
december 9, 2014
US crudes at 3:15 pm Eastern Time (cont.)
Change
(PGA page 210)
($/barrel)
Light Houston Sweet AAXEW00 65.020
+0.760
Bakken
AAXPP00 54.430
+0.600
Americas Crude
+0.410
Marker M1 (Jan 15) AAQHN0061.46–61.48 61.470
Americas Crude
+0.420
Marker M2 (Feb 15) AAQHO0061.56–61.58 61.570
Americas Crude
+0.330
Marker M3 (Mar 15) AAQHP0061.56–61.58 61.570
Mars M1 (Jan 15)
AAMBR0062.41–62.43 62.420
+0.510
Mars M2 (Feb 15)
AAMBU0062.51–62.53 62.520
+0.520
Mars M3 (Mar 15)
AAMBX0062.51–62.53 62.520
+0.430
P-5 WTI Average*
AAFEN00 60.320
+0.700
Americas Dated Brent AAQBF0066.03–66.05 66.040
+0.560
WTI EFP (Jan 15)
AAGVT00-0.01/0.01
0.000
0.000
WTI EFP (Feb 15)
AAGVU00-0.01/0.01
0.000
0.000
Mars/WTI M1 (Jan 15) AAGWH00-1.36/-1.34
-1.350
-0.150
Mars/WTI M2 (Feb 15) AAKTH00-1.41/-1.39
-1.400
-0.150
Mars/WTI M3 (Mar 15)AAMBO00-1.56/-1.54
-1.550
-0.200
WTI P-Plus
PCACI003.17/3.19
3.180
0.000
WTI-Delta
AAEJK00-0.21/-0.19
-0.200
0.000
* P-5 WTI is a crude oil postings-based index as of 5:30 p.m. local New York
time. Posted prices by the following companies are used in the index: Phillips66,
Plains, Sunoco, Shell, and Valero.
US crudes at 3:15 pm Eastern Time (cont.)
Change
Change
Crudes ($/barrel)
WTI Midland
LLS M1
LLS M2
HLS M1
HLS M2
WTS Midland M1
WTS Midland M2
Poseidon
Thunder Horse
Wyoming Sweet
Bonito
SGC
Eugene Island
ANS (California)
Basrah Light
Thums
Line 63
Kern River
WTI CMA
PCACJ0062.81–62.83
PCABN0066.31–66.33
AAURC0066.31–66.33
PCABD0063.26–63.28
AAURE0063.26–63.28
PCACK0063.16–63.18
AAURG0062.76–62.78
AABHK0061.46–61.48
AAWZK0064.31–64.33
PCACM0061.06–61.08
PCAIE0064.41–64.43
AASOI0061.76–61.78
PCAFC0064.41–64.43
PCAAD0064.68–64.72
AAEJH0059.76–59.78
PCACD0058.06–58.08
PCABM0063.42–63.46
PCABJ0056.06–56.08
AAVSN00
62.820 +0.610
66.320 +0.660
66.320 +0.670
63.270 +0.660
63.270 +0.120
63.170 +0.610
62.770 +0.770
61.470 +0.410
64.320 +0.660
61.070 +0.560
64.420 +0.610
61.770 +0.510
64.420 +0.610
64.700 +0.670
59.770 +0.420
58.070
-2.610
63.440 +0.540
56.070
-2.660
63.980
+0.650
WTI Midland vs WTI M1
LLS M1 vs WTI M1
LLS M2 vs WTI M2
HLS M1 vs WTI M1
HLS M2 vs WTI M2
WTS Midland M1 vs WTI M1
WTS Midland M2 vs WTI M2
Poseidon vs WTI M1
Thunder Horse vs WTI M1
Wyoming Sweet vs WTI M1
Bonito vs WTI M1
SGC vs WTI M1
Eugene Island vs WTI M1
ANS vs WTI CMA
Basrah Light vs WTI M2
AAGVZ00--0.96/-0.94
AAGWN002.54/2.56
AAURD002.39/2.41
AAGWP00-0.51/-0.49
AAURF00-0.66/-0.64
AAGWB00-0.61/-0.59
AAURH00-1.16/-1.14
AAGWL00-2.31/-2.29
AAWZL000.54/0.56
AAGWR00-2.71/-2.69
AAGWF000.64/0.66
AASOJ00-2.01/-1.99
AAGWD000.64/0.66
AAGWX000.73/0.75
AAGWV00-4.16/-4.14
-0.950
2.550
2.400
-0.500
-0.650
-0.600
-1.150
-2.300
0.550
-2.700
0.650
-2.000
0.650
0.740
-4.150
-0.050
0.000
0.000
0.000
-0.550
-0.050
+0.100
-0.250
0.000
-0.100
-0.050
-0.150
-0.050
+0.010
-0.250
Line 63 P-Plus
PCAFV000.84/0.86
0.850
-0.050
Shale ($/barrel)
Bakken Ex-Guernsey*
Bakken Ex-Clearbrook*
Eagle Ford Postings Avg.**
Eagle Ford Marker**
AASRR0060.57–60.59
AASRU0058.07–58.09
AAYAH00
AAYAJ00
60.580 +0.400
58.080 +0.400
58.830
+0.692
65.100
+0.700
Bakken Ex-Guernsey vs WTI CMA
Bakken Ex-Clearbrook vs WTI CMA
Eagle Ford Posting Avg vs EF marker
AASRV00-3.41/-3.39
AASRW00-5.91/-5.89
AAYAI00
-3.400
-5.900
-6.268
(PGA page 214)
(PGA page 214)
-0.250
-0.250
-0.004
*Bakken Blend ex-Guernsey reflects 38-40 API and 0.2% sulfur. Bakken Blend ex-Clearbrook reflects 38-40 API and 0.2% sulfur. Both grades are assessed versus calendar month average of 1st month NYMEX WTI futures at 3:15 pm ET.
**Eagle Ford Marker represents the gross product weight of a 47 API Eagle Ford crude barrel adjusted for spot values. The specific product assessments and yield percentages used to calculate the Eagle Ford Marker can be found at http://www.platts.com/
MethodologyAndSpecifications/Oil. Eagle Ford Postings Average is the daily average of four posted prices for Eagle Ford crude from the following companies: Sunoco, Plains, Flint Hills, and Enterprise.
Copyright © 2014, McGraw Hill Financial
3
NORTH AMERICAN CRUDE AND PRODUCTS SCAN
Canadian light crudes in particular have felt the oversupply impact. Sweet benchmark Syncrude dropped
75 cents to the calendar month average of NYMEX
light sweet crude (WTI CMA) minus $4/b, where it
traded. The grade has fallen $1.80/b since December
3. Spot prices for heavy and medium grades have
also felt an impact from the start of Enbridge’s
850,000 b/d Flanagan South pipeline, which carries
mostly heavy crudes from the US Midwest to the
storage hub in Cushing, Oklahoma. Heavy benchmark
Western Canadian Select also fell 75 cents/b to WTI
CMA minus $17.90/b on a deal.
US West Coast crudes
(PGA page 294)
Canadian crudes at 3:15 pm Eastern Time
Change
European VGO
Market Analysis: (PGA page 1598) Northwest European
low sulfur straight run fuel differentials were assessed
75 cents higher at a $7/barrel discount to ICE February
Brent Tuesday following firmer buying interest for low
sulfur VGO. “LSSR looks stronger these days. I heard
BP is offering LSSR at Brent minus $6/b FOB ARA,”
said one source. BP declined to comment. “I’m seeing
offers in the minus $6-7/b range and bids around minus
$8-9/b,” said a second source.
Change
(PGA page 230)
-18.150
-0.750
-7.500
-0.100
-8.500
+0.200
-12.950
+0.200
-5.100
-0.100
-4.000
-0.750
-17.900
-0.750
-9.750
-0.300
-18.900
-0.750
Eastern Canada ($/barrel)
vs Canada Dated Brent strip
Hibernia
AAJKK0066.46–66.57 66.515+0.205
AAJKM000.03/0.13
Terra Nova
AAJUH0065.94–66.05 65.995+0.205
AAJUJ00-0.49/-0.39
White Rose
AAVJX0067.94–68.05 67.995+0.205
AAVJY001.51/1.61
HSVGO cargoes rose $0.75/b to a $2/b discount. BP
bid a FOB Rotterdam LSVGO barge of 0.6% maximum
sulfur quality for loading on the back-end of the barge
window which went unsold at a $0.05/b premium
to February Brent. Platts normalized the barge
specification 30 cents/b for better asphaltenes and
nitrogen. The bid proved competitive and was used
as the basis of the VGO assessment. “I’m not seeing
any buying interest for cargoes at all at the moment
so cargoes could be trading a bit lower than barges
I suppose...LSVGO barges are a bit higher,” a source
said. A second said: “In ARA there are few buyers and
sellers of barges, usually BP, Shell and Totsa.” The
source added that there was some incremental demand
for HSVGO in the Mediterranean and Portugal.
Northwest European vacuum gasoil differentials were
firmer Tuesday following a competitive low sulfur
VGO barge bid from BP in the Platts market on close
assessment process. FOB NWE LSVGO barges were
assessed at a $0.15/barrel discount to February ICE
Brent futures, up $1.35/b on the day, while cargoes
were assessed at a $0.65/b discount. FOB NWE
Canada pipeline crudes ($/barrel)
vs WTI CMA
Lloyd Blend
AALRK0045.78–45.88 45.830 -0.100
AALRP00-18.20/-18.10
Mixed Sweet
AALRR0056.43–56.53 56.480+0.550
AALRV00-7.55/-7.45
Light Sour Blend
AALRX0055.43–55.53 55.480+0.850
AALSD00-8.55/-8.45
Midale
AAUCC0050.98–51.08 51.030+0.850
AAUCE00-13.00/-12.90
Condensates
AALSF0058.83–58.93 58.880+0.550
AALSJ00-5.15/-5.05
Syncrude Sweet
AASOK0059.93–60.03 59.980 -0.100
AASOM00-4.05/-3.95
WCS Hardisty
AAPPN0046.03–46.13 46.080 -0.100
AAPPP00-17.95/-17.85
WCS ex-Cushing
AAWTY0054.18–54.28 54.230+0.350
AAWTZ00-9.80/-9.70
Cold Lake Hardisty
AASZX0045.03–45.13 45.080 -0.100
AASZZ00-18.95/-18.85
The ANS differential was assessed 1 cent higher
Tuesday at WTI CMA plus 74 cents/barrel for delivery
in January. Platts calculates the ANS differential
to reflect that the ANS market uses WTI CMA at
the underlying contract’s settlement as a basis for
trading, then normalizes the differential against the
Platts assessment of WTI CMA. While the ANS market
is thinly traded, Platts weighs recent differentials
with changes in prices for competing grades. The
differential for 2:30 pm EST (1930 GMT) was
calculated at plus 65 cents/b. When adjusted to
reflect the WTI CMA at 3:15 pm EST, the assessment
was plus 74 cents/b. Although the ANS differential
for 2:30 pm EST was 10 cents/b lower, changes in
the crude futures market between 2:30 pm and 3:15
pm EST caused the final value to be 1 cent higher
than on Monday.
(PGA page 1597)
december 9, 2014
(PGA page 230)
0.080
-0.030
-0.440
-0.030
1.560
-0.030
Canadian crudes at 3:15 pm Eastern Time
Change
Canada pipeline crudes (C$/cu m)
Lloyd Blend
AALRM00328.89–329.61
Mixed Sweet
AALRT00405.40–406.12
Light Sour Blend
AALRZ00398.22–398.94
Midale
AAUCD00366.25–366.97
Condensates
AALSH00422.65–423.36
Syncrude Sweet
AASOL00430.55–431.27
WCS Hardisty
AAPPO00330.69–331.41
WCS ex-Cushing
AAWUA00389.24–389.96
Cold Lake Hardisty
AASZY00323.50–324.22
Eastern Canada
Hibernia
Terra Nova
White Rose
(PGA page 232)
329.252 -2.156
405.763+2.200
398.579+4.396
366.609+4.535
423.005+2.124
430.908 -2.600
331.048 -2.164
389.599+0.827
323.863 -2.134
(PGA page 232)
AALSN00477.46–478.25 477.857 -0.603
AALSP00473.73–474.52 474.121 -0.587
AAVPI00488.09–488.88 488.489 -0.650
Note: barrel to cubic meter conversion factor is 6.28976
Forex at 3:15 pm Eastern Time
European LSSR
Canadian dollar/US dollar forex
Copyright © 2014, McGraw Hill Financial
BCACT000.8755
Straight Run 0.5-0.7%S FOB NWE Cargo Assessment
Rationale: (PGA page 1584) The outright FOB NWE LSSR
0.5-0.7% cargo value was assessed at $407.50/
mt from a previous $400.50/mt. The LSSR FOB NWE
differential was assessed at a $7/barrel discount to ICE
February Brent crude futures, up 75 cents on the day
following firmer LSVGO buying interest. February 16:30
ICE Brent crude was assessed at $67.19/b from a
4
NORTH AMERICAN CRUDE AND PRODUCTS SCAN
Canadian Crude Posting Averages
(PGA page 253)
(C$/cu m) Change
Bow River – Hardisty
PCAEY00363.00 -6.000
Light sour – Cromer
PCAII00398.00 -6.000
previous $66.94/b. The outright LSSR price was derived
using the dollars per barrel to metric tonne conversion
factor of 6.77 for LSSR.
The above commentary applies to the following market data
code: PKABA00
LSSR Cargo bids/offers/trades: (PGA page 1585)
■■LSSR CARGO MOC: DEAL SUMMARY: No deals.
■■LSSR CARGO MOC: OUTSTANDING INTEREST: None.
LSSR Cargo exclusions: (PGA page 1585) No market data
was excluded from the December 9 assessment.
US MTBE
$/barrelChange
PCAFB0050.53 -0.612
PCAIK0055.40 -0.591
09-Dec: $63.82, up $0.77
85
Alaska crude production/inventories
80
Effective date: 08-Dec-14
75
70
65
24-Oct
07-Nov
21-Nov
09-Dec
Source: Platts
(PGA page 774)
US Gulf Coast MTBE was assessed Tuesday at
$2.3705/gal FOB USG, up 5.90 cents from Monday.
The US MTBE market remained tight due to a
producer’s turnaround, sources said. The US MTBE
market may be more balanced at the end of the first
quarter of 2015 once some producers are running
at full capacity, a source said. No bids or offers
were heard and no trades were concluded during
the Platts Market on Close assessment process.
The European MTBE spot price was assessed at
$806/mt Tuesday, up $21 from Monday. The MTBE
factor to gasoline rose 2.6% to 1.371. The factor
of MTBE to gasoline rose due to demand from the
US and South American countries. The strength in
the MTBE factor to gasoline was almost exclusively
attributed to exports, a source in Europe said. In
the absence of market indicators, the USGC MTBE
assessment was based on a five- to 15-day netback
formula to ARA values that assumes a freight cost
of 10 cents/gal. Upstream in methanol, the spot
assessment decreased 1.50 cents to 126 cents/
gal FOB USG. The methanol-MTBE spread narrowed
5.35 cents to 111.05 cents.
(PGA page 252)
Flint Hills
PSAUA00 398.0008Dec14
Light sour – Cromer
PSASP09 363.0008Dec14
Bow River – Hardisty
Seg Condensate – Edmonton PSAUM00 435.0008Dec14
Effective March 31, 2013, Shell Canada discontinued its crude posted prices for
Midale Cromer, Light Sour Cromer and Sour Edmonton. Shell Canada effective
October 31, 2013 discontinues its crude posted price for Light/sweet Edmonton.
($/barrel)
60
10-Oct
Canadian Crude Postings (C$/cu m)
NYMEX front-month Light Sweet Crude
90
december 9, 2014
US Feedstocks
(PGA page 394)
The differential for standard naphtha to waterborne
gasoline in the Gulf Coast rose 50 points Tuesday to M4
waterborne gasoline minus 11 cents/gal. Buyers placed
moderately stronger bids, although offers were scarce.
No trades were confirmed and no buyer or seller entered
the Platts Market on Close assessment process. Heavy
naphtha was unchanged at M4 waterborne minus 8.25
cents/gal. The market saw one offer at M4 waterborne
minus 7 cents/gal, but that offer attracted no firm
bids. The spread between standard and heavy naphtha
narrowed from 3.25 cents on Monday to 2.75 cents on
Tuesday. Although overall liquidity is thin, the market
looks to export cargoes to Asia, which is lending support
to differentials on the Gulf Coast. Vacuum gasoil
differentials were unchanged amid limited liquidity. The
spread between high and low sulfur held firm at 75
cents, its lowest level since February 2013. Low sulfur
VGO was talked at WTI plus 6.25/barrel. Reformate and
other gasoline blendstocks were unchanged amid limited
market discussions. There was limited discussion on
the market, and differentials were unchanged at M4
Copyright © 2014, McGraw Hill Financial
(PGA page 258)
b/dChange
Total Alaska North Slope
TANSB00549,453 +4,213
Prudhoe Bay
PBBPD00317,733 +1,519
Kuparuk
TAKBD00149,275 +2,606
Endicott
TAEBD009,536 +178
Lisburne
TALBD0024,194
-89
Alpine
TAABD0048,715
-1
barrelsChange
Valdez inventories
VIBPD00564,168
-1,368,666
Source: Alaska Department of Revenue, Tax Division
Platts Futures Assessments 3:15 pm ET*
NYMEX
(PGA page 703)
$/barrel
NYCRM0163.77
Light sweet crude (Jan)
NYCRM0263.92
Light sweet crude (Feb)
NYCRM0364.07
Light sweet crude (Mar)
NYCRM0464.25
Light sweet crude (Apr)
¢/gal
NYRBM01171.96
RBOB (Jan)
NYRBM02173.23
RBOB (Feb)
NYRBM03175.31
RBOB (Mar)
NYHOM01208.35
NYMEX NY ULSD (Jan )
NYHOM02206.17
NYMEX NY ULSD (Feb )
NYHOM03204.57
NYMEX NY ULSD (Mar )
ICE
$/barrel
AAQBG0066.75
Brent (Jan)
AAQBH0067.10
Brent (Feb)
AAXZZ0067.76
Brent (Mar)
AAYAL0068.41
Brent (Apr)
* These assessments reflect prevailing futures value exactly at 3:15 pm ET.
However, on the business day preceding the following holidays these assessments reflect the value of futures at precisely 1:30 pm ET: Christmas Day, New
Years Day, Fourth of July, and Thanksgiving Day.
5
NORTH AMERICAN CRUDE AND PRODUCTS SCAN
december 9, 2014
US Crude Postings
(PGA page 250)
Plains
Shell
Sunoco
WTI
PSADF09
60.25*09Dec14
PSADI09
60.40*09Dec14
PSADG09
60.25*09Dec14
PSACS09
WTS PSAED09 57.6509Dec14
PSAEG09 60.5409Dec14
PSAEE09 55.2509Dec14
AAFHJ00
LLS PSAMO09 58.7509Dec14
PSAMQ09 58.7509Dec14
PSAMP09 59.0009Dec14
PSATF09
Oklahoma sweet PSUS191 60.2509Dec14
PSANX09 60.4309Dec14
PSANW09 60.2509Dec14
Kansas PSAPL09 51.1009Dec14
PSUS112 52.6809Dec14
PSAPE09
Wyoming sweet PSAQZ09 51.3509Dec14
PSARA09 51.8209Dec14
Wyoming sour PSAQC09 43.5309Dec14
PSAQD09 39.0009Dec14
Eugene Island AALBB00 55.7509Dec14
Eagle Ford PSUS100 60.2509Dec14
Eagle Ford Condensate
PSUS110 59.5009Dec14
Eagle Ford Light
PSUS135 60.2509Dec14
Valero
60.25*09Dec14
55.2509Dec14
63.5209Dec14
59.2509Dec14
Phillips 66
Flint Hills
Rose Rock
WTI
PSACP09
60.44*09Dec14
AAUQN00 60.2509Dec14
AAOPS00 56.6809Dec14
WTS PSADO09 58.7309Dec14
LLS PSAMC09 59.1909Dec14
Oklahoma sweet PSASL09 60.2409Dec14
AAOPR00 55.7309Dec14
Kansas AAOPT00 49.3509Dec14
Wyoming sweet PSUS264 57.2509Dec14
Wyoming sour PSUS261 39.0009Dec14
Eagle Ford
PSUS068 54.7509Dec14
Eagle Ford Condensate
PSUS070 48.2509Dec14
Eagle Ford Light
PSUS069 53.2509Dec14
*P-5 WTI is a crude oil postings-based index as of 5:30 p.m. local New York time. Posted prices by the following companies are used in the index: Phillips66, Plains, Sunoco, Shell, and Valero.
plus 63.50 cents/gal. Blend values for reformate are
at 62.92 cents/gal, down from 79.11 cents/gal last
week. The decline has temporarily pushed buyers to the
sidelines. In addition, trading remains limited because
many blenders are trying to minimize their inventory
before the end of the year for tax purposes, traders said.
News
(PGA page 100)
Kinder Morgan again eyes
Texas-California oil line
Kinder Morgan appears to have resuscitated its Freedom
Pipeline project to bring Texas crude to the West Coast,
giving it a condensate export twist. “What’s changed is
[Kinder is] planning to build a splitter on the delivery end
of the pipeline” to collect condensate from the growing
volumes of light shale crude flowing into the state, said
Martin Tallett, president of consulting firm EnSys Energy.
The rest of the oil “would be blended with other crudes.”
The 250,000 b/d Freedom proposal was designed to
run from Wink, Texas, to San Emidio, California, near
Refinery Yields and Netbacks (Winter specifications)
Yield
Freight
Netback
Spot Price
Margin
US Atlantic Coast Crack Yield & Netback
Arab Light
TYACL00
Brent
TYAHP00
70.99
74.84
TDDAU00
TDDCC00
2.06
1.18
TNACL00
TNAHP00
68.93
73.66
AAXCU00
PCAAS00
64.020
66.100
TNACLMR
TNAHPMR
US Atlantic Coast Coke Yield & Netback
Arab Light
TYACJ00
Brent
TYAHN00
73.36
78.98
TDDAU00
TDDCC00
2.06
1.18
TNACJ00
TNAHN00
71.30
77.80
AAXCU00
PCAAS00
64.020
66.100
TNACJMR
TNAHNMR
Midwest Crack Yield & Netback
Arab Light
Light Louisiana Sweet (LLS)
West Texas Intermediate (WTI)
West Texas Sour (WTS)
69.52
77.94
73.38
71.97
TDDAS00
TDDQV00
TDDRG00
TDDRI00
3.07
0.96
1.44
2.16
TNACT00
TNANT00
TNAUB00
TNAUJ00
66.45
76.98
71.94
69.81
AAXCU00
PCABN00
PCACG00
PCACK00
64.020
66.320
63.770
63.170
TNACTMR
TNANTMR
TNAUBMR
TNAUJMR
(PGA page 810)
4.910
7.560
(PGA page 812)
7.280
11.700
(PGA page 820)
TYACT00
TYANT00
TYAUB00
TYAUJ00
NORTH AMERICAN CRUDE
AND PRODUCTS SCAN
2.430
10.660
8.170
6.640
Volume 2 / Issue 236 / December 9, 2014
Editorial: Richard Swann, Editorial Director, Americas Oil: +1-713-658-3273, Matt Cook, Senior Managing Editor, Americas Clean Products +1-713-658-3208
Client services information: North America: +1 800-PLATTS8 (+1-800-752-8878); direct: +1-212-904-3070 Europe & Middle East: +44-20-7176-6111
Asian Pacific: +65-6530-6430 Latin America: +54-11-4121-4810, E-mail: [email protected]
Copyright © 2014 McGraw Hill Financial. All rights reserved. No portion of this publication may be photocopied, reproduced, retransmitted, put into a computer system
or otherwise redistributed without prior written authorization from Platts. Platts is a trademark of McGraw Hill Financial. Information has been obtained from sources
believed reliable. However, because of the possibility of human or mechanical error by sources, McGraw Hill Financial or others, McGraw Hill Financial does not
guarantee the accuracy, adequacy or completeness of any such information and is not responsible for any errors or omissions or for results obtained from use of such
information. See back of publication invoice for complete terms and conditions.
Copyright © 2014, McGraw Hill Financial
6
NORTH AMERICAN CRUDE AND PRODUCTS SCAN
Bakersfield. It involved a mix of new pipe construction
and utilization of an existing natural gas pipeline. The
project was announced in April 2013, but withdrawn a
month later due to insufficient shipper interest. But the
new pipeline proposal could galvanize shippers, Tallett
said. “That was a problem with the original proposal:
you were taking 40-42 crude API from Texas to a [West
Coast] refinery taking 27-29 API crude,” he said. “It
was a huge disparity.” Tom Dobson, project director of
Kinder Morgan Pipelines, said in a recent presentation
that the revived project is envisioned to include an
atmospheric topping unit to split off Permian condensate
for export and allow the rest of the oil to be mixed with
heavier crudes. The topping unit would process up to
150,000 b/d and produce condensate and also gasoil
and residual fuels to blend with other crudes, he said.
Dobson’s remarks were first reported by Genscape and
later confirmed by a Kinder Morgan spokesman. The
pipeline would separately batch shipments of 100,000
b/d of condensate and 200,000 b/d of blended crude
around 31 degree API, Dobson said. California refineries
are more accustomed to running the grade than lighter
Permian oils. Condensate could be exported to Pacific
Rim buyers from California. Dobson speculated the total
project might take up to four years to come onstream.
The original Freedom proposal did not account for the
increasingly lighter nature of Permian crudes, which
need to be more tailored to California refiners’ heavier
crude needs. “The project has been ‘on the shelf’
since late May 2013, but never abandoned,” the Kinder
Morgan spokesman, Richard Wheatley, said in an email.
“We have always said we will build such a project —
provided we have sufficient customer interest.” Though
he confirmed details of Dobson’s remarks, Wheatley
said they did not constitute a formal Kinder Morgan
announcement of the project. The link to potential
condensate exports could be the game changer
in Kinder’s plan. Earlier this year, Pioneer Natural
Resources and Enterprise Product Partners received
a nod from the US Commerce Department to export
lightly processed condensate run through a distillation
tower. Australia’s BHP has also sent US condensate
december 9, 2014
Refinery Yields and Netbacks
Midwest Coke Yield & Netback
Arab Light
Light Louisiana Sweet (LLS)
West Texas Intermediate (WTI)
West Texas Sour (WTS)
Yield
Freight
Netback
Spot Price
Margin
(PGA page 822)
TYACR00
TYANR00
TYATZ00
TYAUH00
74.60
79.50
75.56
75.82
TDDAS00
TDDQV00
TDDRG00
TDDRI00
3.07
0.96
1.44
2.16
TNACR00
TNANR00
TNATZ00
TNAUH00
71.53
78.54
74.12
73.66
AAXCU00
PCABN00
PCACG00
PCACK00
64.020
66.320
63.770
63.170
TNACRMR
TNANRMR
TNATZMR
TNAUHMR
US Gulf Coast Crack Yield & Netback
Arab Light
TYACP00
Brent
TYAHT00
Light Louisiana Sweet (LLS)
TYANP00
Mars
TYAOB00
Maya
TYAOJ00
West Texas Intermediate (WTI)
TYATX00
66.79
70.44
72.79
65.72
57.73
69.63
TDDAR00
TDDCB00
TDDQW00
TDDQY00
TDDDP00
TDDRH00
1.69
1.64
0.99
1.01
0.88
4.00
TNACP00
TNAHT00
TNANP00
TNAOB00
TNAOJ00
TNATX00
65.10
68.80
71.80
64.71
56.85
65.63
AAXCU00
PCAAS00
PCABN00
AAMBR00
PDATS09
PCACG00
64.020
66.100
66.320
62.420
56.730
63.770
TNACPMR
TNAHTMR
TNANPMR
TNAOBMR
TNAOJMR
TNATXMR
US Gulf Coast Coke Yield & Netback
Arab Light
TYACN00
Brent
TYAHR00
Light Louisiana Sweet (LLS)
TYANN00
Mars
TYANZ00
Maya
TYAOH00
West Texas Intermediate (WTI)
TYATV00
67.64
69.83
72.26
67.10
64.48
69.29
TDDAR00
TDDCB00
TDDQW00
TDDQY00
TDDDP00
TDDRH00
1.69
1.64
0.99
1.01
0.88
4.00
TNACN00
TNAHR00
TNANN00
TNANZ00
TNAOH00
TNATV00
65.95
68.19
71.27
66.09
63.60
65.29
AAXCU00
PCAAS00
PCABN00
AAMBR00
PDATS09
PCACG00
64.020
66.100
66.320
62.420
56.730
63.770
TNACNMR
TNAHRMR
TNANNMR
TNANZMR
TNAOHMR
TNATVMR
US West Coast Crack Yield & Netback
ANS
TYAAD00
Arab Light
TYACX00
67.44
66.82
TDDGL00
TDDAT00
0.00
3.11
TNAAD00
TNACX00
67.44
63.71
PCAAD00
AAXCU00
64.700
64.020
TNAADMR
TNACXMR
US West Coast Coke Yield & Netback
ANS
TYAAB00
Arab Light
TYACV00
70.53
69.30
TDDGL00
TDDAT00
0.00
3.11
TNAAB00
TNACV00
70.53
66.19
PCAAD00
AAXCU00
64.700
64.020
TNAABMR
TNACVMR
7.510
12.220
10.350
10.490
(PGA page 830)
1.080
2.700
5.480
2.290
0.120
1.860
(PGA page 832)
1.93
2.09
4.95
3.67
6.87
1.52
(PGA page 840)
2.740
-0.310
(PGA page 842)
5.830
2.170
Platts refinery yields and netbacks are based on product prices and freight rates assessed by Platts. The refinery modeling was produced by Turner, Mason & Co. using its
proprietary Turner, Mason Modeling System (TMMS).
Platts North America Refinery Maintenance
(PGA page 175)
Refinery
Capacity
Owner
Country
Start date
End date
Event
(barrels/day)
PADD 1
Bayway
238,000
Phillips 6
US
28-Feb-14
NA
MT
Trainer
185,000 MULTIPLEUS1-Feb-14
NA
UP
PADD 2
Saint Paul Par
89,500
Northern T
US
9-Nov-14
NA
MT
Toledo
170,000 PBF
US 1-Oct-13
31-Dec-14UP
Mcpherson
85,000 MULTIPLEUS1-Jan-15
1-Feb-16UP
Canton
78,000 Marathon US 1-Jun-15
28-Feb-16UP
Catlettsburg
233,000 Marathon US 1-Jun-15
28-Feb-16UP
Coffeyville
115,700 CVR
US 1-Jan-16
31-Dec-16UP
Lima Husky
160,000
Husky
US
1-Jan-17
31-Dec-17
UP
PADD 3
Beaumont
365,000
Exxon Mobi
US
13-Aug-14
NA
MT
Pasadena
106,000 Petrobras US7-Sep-14
8-Sep-15MT
Corpus Christi
165,000
Citgo
US
16-Oct-14
NA
MT
Borger
146,000 MULTIPLE US 1-Dec-14
23-Dec-14MT
Houston
90,000 Valero
US 1-Jan-14
31-May-15EX
Meraux
180,000 Valero
US 4-Nov-14
31-Dec-14UP
Tyler
60,000
Delek US
US
1-Jan-15
31-Jan-15
UP
Copyright © 2014, McGraw Hill Financial
7
NORTH AMERICAN CRUDE AND PRODUCTS SCAN
abroad, while other producers are also mulling exports.
The US is producing about 9 million b/d of crude and
the proportion of light crudes from shale is increasing
at such a rate that soon domestic refiners will run out
of capacity to process it. As a result, the topic of oil
exports has been a hot debate in recent years. While
most doubt US regulators will back exports of crude
oil per se, at least in the near-term, condensate that
has passed through a distillation tower is another story
because it appears to meet Commerce’s criteria for
exportable products. The condensate angle is also a
plus: 13% of all Permian production going forward will
be 45 API or above, Nicole Leonard, energy analyst for
Platts unit Bentek Energy. “We’re looking at 300,000
b/d of condensate by 2019, mostly from the Delaware
[Basin],” she said. California refineries typically run
mostly Middle East and Latin American crudes, along
with traditional Alaska North Slope crude which is about
31 API. But Alaskan production has declined steadily in
december 9, 2014
Platts North America Refinery Maintenance (continued)
Refinery
Capacity
(barrels/day)
Owner
Country
(PGA page 175)
Start date
End date
Event
St Charles
270,000
Valero
US
1-Oct-15
31-Mar-16
UP
Corpus Christi
115,000
Valero
US
1-Jan-16
1-Mar-16
UP
PADD 4
Woods Cross
31,000
HollyFront
US
1-Jan-15
31-Mar-15
EX
PADD 5
Martinez
165,000 Shell
US6-Sep-14
NA
MT
Richmond
243,000 Chevron US 26-Oct-14
10-Dec-14MT
San Francisco
76,000
Phillips 6
US
27-Oct-14
NA
MT
Puget Sound
145,000
Shell
US
12-Nov-14
NA
MT
Bakersfield
70,000 Alon
US8-Nov-12
1-Jun-16 ID
Anacortes
120,000 TESORO US 31-Jan-17
31-Dec-17UP
CANADA AND MEXICO
Montreal
137,000 Suncor
CA 18-Sep-14
15-Dec-14MT
Cadereyta
292,000 Pemex
MX 1-Jan-14
31-Dec-14UP
Tula Hidalgo
315,000
Pemex
MX
1-Jan-18
1-Mar-18
UP
*CL = Closure/EX = Expansion/ID = Idle/LB = Labor/MT = Maintenance/PO = PowerOutage/RC = Run Cuts/RS = Restart/SL = Sale/UP = Upgrade/WT = Weather
Source: Platts Custom Data
For more information please contact [email protected]
Subscriber notes (continued)(PGA page 1500)
and sellers have the right to withdraw bids or offers at any
time in the Platts MOC process, unless prior interest has
already been expressed by a potential counterparty. Please
send any questions or comments to [email protected]
and [email protected]. For written comments, please
provide a clear indication if comments are not intended for
publication by Platts for public viewing. Platts will consider
all comments received and will make comments not marked
as confidential available upon request.
Platts will change the name of its Canadian Syncrude
Sweet crude assessment to Syncrude Sweet Premium,
effective January 15, 2015. The change, which
was proposed on October 29, reflects changes on
Enbridge’s grouping system for crudes shipped
through its pipeline network. The methodology
used to assess the value of this crude, including its
specifications, will not change as a result of this name
change. This assessment appears on Platts Global
Alert Page 230, in the Crude Oil Marketwire, the North
American Crude and Products Scan and in the Platts
price database under the code AASOK00.
Platts confirms it will amend its publication schedule
for Friday, December 26, 2014 and not publish any oil
assessments from its offices in the US on that day in
observance of the Christmas holiday. Platts had proposed
waiting for feedback until December 3 prior to publishing
a decision on this proposal. However, in response to
widespread feedback favoring a decision before the start
of the new trading month, Platts is publishing its decision
before the start of December. Platts will maintain its
current publication schedule for Wednesday, December
24, 2014; Wednesday, December 31, 2014 and Friday,
January 2, 2015 on which days its assessment processes
will close early. All assessments and Market-on-Close
processes will be basis 1:30 pm Eastern time on those
days. Please submit any comments to oilgroup@platts.
com and [email protected]. For full details of Platts
publishing schedule and services affected, refer to http://
www.platts.com/holiday
Following a period of industry feedback that ended May
31, 2014, Platts confirms it will discontinue assessments
for US Gulf Coast naphtha CIF cargoes effective April 1,
Copyright © 2014, McGraw Hill Financial
2015. Platts opened this consultation on the future of
the assessments on September 24, 2013. This proposed
discontinuation is due to substantial changes in market
conditions. Significant growth in naphtha production,
a result of liquids-rich gas drilling and light crude oil
domestic production, has shifted the US from a net
importer to a net exporter of light naphtha and natural
gasoline, and these exports have increased substantially
as rising US supplies will continue to overwhelm
demand. Platts launched on January 2, 2014, a new
naphtha assessment for cargoes loading at US Gulf
Coast terminals on an FOB basis. These assessments are
published on Platts Global Alert pages 26, 34, and 338,
Platts BioFuels Alert page 760, in US Marketscan, North
American Crude and Products Scan, Platts Oilgram Price
Report, and in the Platts assessment database under
codes AAKWL00 for US Gulf Coast heavy naphtha cargo,
and PAAAC00 for US Gulf Coast full range naphtha
cargo. Please send all additional comments to americas_
[email protected] and [email protected]. For
written comments, please provide a clear indication if
comments are not intended for publication by Platts
8
NORTH AMERICAN CRUDE AND PRODUCTS SCAN
december 9, 2014
Subscriber notes (continued)(PGA page 1500)
for public viewing. Platts will consider all comments
received and will make comments not marked as
confidential available upon request.
Effective January 2, 2015, Platts will amend and
update the specifications it reflects in its European
high and low sulfur VGO assessments, following
feedback received to its proposal process to update
these specifications, which was ongoing throughout
the second half of 2014. Platts will reflect the
following specifications in its high sulfur VGO
assessments from January 2: Sulfur: 2% max; Density:
0.92 g/ml max; Metals: Iron 2 ppm max, Sodium 2
ppm max, Nickel 1 ppm max, Copper 1 ppm max,
Vanadium 1ppm max; CCR: 0.5% max; Nitrogen:
1700ppm max; Pour point: 45 degrees C max;
Flashpoint: 100 degrees C min; Aniline: 75 degrees C
min; Asphaltenes: 700 ppm max; Tan: 0.5 mg KOH/g
max. Platts current HSVGO specifications read: 2%
the last 25 years from a 1988 peak of over 2 million
b/d to 542,000 b/d in January and 398,000 b/d in
September. “I think what Kinder is trying to capitalize on
is declining ANS crude production,” Leonard said. WTI at
Midland, Texas, closed at a $1.88/b discount to ANS at
Long Beach, California, on Tuesday. That was out from
an 83 cents/b discount on December 1. The spread has
tightened dramatically from a $21.89/b discount August
19. Traditionally, there has been about a $5/b-$6/b
transportation tariff to the West Coast from Texas,
analysts said. Thus, “the differential between Brent and
WTI would have to exceed the cost of transportation”
along the pipeline, Leonard added. “The biggest issue
for [a Texas-West Coast] pipeline right now, given the
current price environment, is how narrow the WTI-Brent
spread has become,” said Tony Starkey, manager of
energy analysis at Bentek. For instance, given the
current $3/b WTI-Brent spread, if it costs $5/b to pipe
to the West Coast, and then another $2-$3/b to tanker
it to its destination, a barrel reaches the global market
at a “much higher price” than Brent, Starkey said. While
maximum sulfur, specific gravity 0.900-0.920 g/ml.
Also from January 2, Platts will reflect the following
specifications in its LSVGO assessment: Sulfur: 0.6%
max; Density: 0.92 g/ml max; Metals: Iron 2 ppm max,
Sodium 2 ppm max, Nickel 1 ppm max, Copper 1 ppm
max, Vanadium 1ppm max; CCR: 0.5% max; Nitrogen:
1500ppm max; Pour point: 45 degrees C max;
Flashpoint: 100 degrees C min; Aniline: 80 degrees C
min; Asphaltenes: 700 ppm max; Tan: 0.5 mg KOH/g
max. Platts current LSVGO specifications read: 0.50.6% sulfur, specific gravity 0.900-0.920 g/ml. Platts
will continue to consider other merchantable HSVGO
and LSVGO specifications in its assessment process,
and may normalize to the updated specifications.
Please send any comments or questions to europe_
[email protected] and [email protected]. For
written comments, please provide a clear indication if
comments are not intended for publication by Platts
moving light crude from West Texas to California “makes
sense,” it is a long-term scenario and a “bet on the
future,” despite a currently narrowed Midland-ANS price
differential, said John Auers, executive vice president
of downstream consultants Turner Mason & Company.
“Current values don’t necessarily justify a lot of things,”
he said. “We do see long-term that domestic light crude
has a good home on the West Coast.” If there is a
surplus of crude in West Texas that cannot be absorbed
anywhere else domestically, Permian crude would “move
to a level that could support” sending it California, Auers
said. “Ultimately, differentials work themselves out.”
Eagle Ford condensate in USGC set
to load for trans-Atlantic delivery
The tanker Nissos Delos is set to load from the US Gulf
Coast on a trans-Atlantic route, carrying one of the first
exports of Eagle Ford condensate from the US, a fixture
report showed Tuesday. The foreign-flagged Aframax-sized
ship, set to load on the US Gulf Coast on December 15
Copyright © 2014, McGraw Hill Financial
for public viewing. Platts will consider all comments
received and will make comments not marked as
confidential available upon request.
Platts specifications for vacuum gasoil in the US Gulf
Coast, US Atlantic Coast and US West Coast markets
mistakenly referred to a minimum sulfur content of
2%. This has now been corrected to a maximum sulfur
content of 2%, as follows: Platts assesses the value of
three grades, reflecting (1) a maximum sulfur content
of 0.5%; (2) a maximum sulfur content of 1%; and (3) a
maximum sulfur content of 2%. In all cases, the aniline
point is a minimum 180 degrees Fahrenheit. The aniline
point signifies the temperature at which aniline and oil
are equally mixable, and the relatively higher temperature
signifies VGO that has a relatively lower aromatics
content than VGO with an aniline point of minimum 160
degrees F. Platts US VGO assessments reflect material with
a conradson carbon residue of maximum 0.7%.
and chartered by Vitol, is currently in the Port of South
Louisiana, data from Platts cFlow ship-tracking software
showed. BHP Billiton, a large producer and seller of
Eagle Ford condensate, was heard to have been the
seller of this cargo, US market sources said. A large
amount of BHP’s production exists in DeWitt County,
Texas, a company source said previously. The source also
explained that most of BHP’s condensate goes through
the Kinder Morgan Crude and Condensate pipeline, a
300,000-barrel, 24-inch-diameter, gas-to-oil converted
pipeline that runs from Cuero, Texas, in the Eagle Ford
formation to two terminals in Houston — Kinder Morgan
Galena Park and Oiltanking International (OTI). Thus,
BHP’s condensate will likely be exported from the Port
of Houston. “BHP has 280,000 barrels of storage at
OTI,” the source said. “BHP also has a connection to the
Enterprise Pipeline that ends up at the ECHO Terminal,”
also in Houston. He added that most of BHP’s production
is sold to a handful of end-users who have refineries and
use the condensate as part of the slate of crudes in their
refineries. BHP did not immediately respond a request
9
NORTH AMERICAN CRUDE AND PRODUCTS SCAN
for comment, but company spokesman Ruban Yogarajah
confirmed in November that the company was planning
to export condensate from Texas’ Eagle Ford that had
been processed through a distillation tower. Earlier this
year, Enterprise Products Partners and Pioneer Natural
Resources received rulings from the US Department of
Commerce to export their processed condensate, though
those rulings remain confidential. BHP has not received
legal backing or a commodity classification ruling from
Commerce to export its processed condensate. As a
result, the company runs the risk of violating US export
law if its processing does not meet the same standards
Enterprise and Pioneer have met. Despite the risk,
BHP on Tuesday sold one 650,000-barrel cargo of US
condensate for loading in the first half of January to Koch
Supply & Trading. Traders said the cargo is destined for
Europe, but further details were not clear. The cargo was
sold at an unknown differential to WTI crude. The Platts
Eagle Ford Marker, which represents the gross product
weight of a 47 API Eagle Ford crude barrel, was assessed
at $64.40/barrel Monday. One trader said Tuesday that
condensate is tightening with low 40 API crude, trading
$3-4/b higher than 50-plus API crude.
WTI to average $63/b in 2015,
$15/b lower than Nov projection: EIA
While cautioning of “high uncertainty” in its price
projections due to recent volatility, the US Energy
Information Administration on Tuesday estimated that
Brent crude oil prices will average $68.08/barrel in
2015, $15 lower than it forecast in November and
$33 lower than it projected in October. WTI prices,
meanwhile, are expected to average $62.75/b in
2015, also a $15 drop from the EIA’s November
projection. “The combination of robust world crude oil
supply growth and weak global demand has contributed
to rising global inventories and falling crude oil prices,”
the EIA said in its December Short-Term Energy
Outlook. “EIA expects global oil inventories to continue
to build over the next year, keeping downward pressure
on oil prices.” The agency, the statistical arm of the
US Department of Energy, predicted that downward
price pressures would be concentrated in the first
half of 2015, when global inventory builds would be
strong. Brent, for example, will average $63/b each
month from March through May, before increasing to
an average of $73/b in the fourth quarter. The EIA
said it expects the discount of WTI to Brent to widen
slightly from current levels, averaging $5/b in 2015.
But it noted that volatility had created “a particularly
uncertain forecasting environment” and that prices
could be impacted by potential cuts in production by
Saudi Arabia and others, as well as production outages
caused by unrest in countries highly dependent on
oil revenue for their budgets. “Additionally, the price
and lag time required to cause a reduction in forecast
non-OPEC supply growth, particularly US tight oil, is
not known,” the EIA added. “The degree to which
non-OPEC supply growth is affected by lower oil
prices will also affect market balances and prices.”
The EIA forecast that US crude oil production would
average 8.60 million b/d in 2014, increasing to 9.32
million b/d in 2015. But with the agency projecting
a WTI price of $58/b in the second quarter of 2015,
it said it expects 2015 drilling activity to decline.
“Many companies will redirect investment away from
marginal exploration and research drilling and into core
areas of major tight oil plays,” the EIA said, adding
that oil prices would remain high enough to support
continued drilling in the Bakken, Eagle Ford, Niobrara
and Permian Basin plays. Those shale formations
contribute the majority of US oil production growth.
The EIA also revised downward its projection of Gulf of
Mexico production by 95,000 b/d, as some projects
are ramping up slower than expected. The agency now
expects the US Gulf of Mexico to produce 1.55 million
b/d in 2015, up from 1.40 million b/d in 2014. Alaska
production will decline to 450,000 b/d in 2015, from
490,000 b/d in 2014. “U.S. oil production growth is
expected to slow next year in response to lower crude
prices, but annual output is forecast to still increase
to the highest level since 1972,” EIA Administrator
Adam Sieminski said in a statement. Growth in US
Copyright © 2014, McGraw Hill Financial
december 9, 2014
production will cause the US’ share of consumption
met by net crude imports to fall to 21% in 2015, which
would be the lowest level since 1969. The EIA expects
the US to import 6.15 million b/d in 2015, down from
6.95 million b/d in 2014. In 2005, the import share
was 60%, falling to 33% in 2013. US liquids fuel
consumption will average 18.96 million b/d in 2014,
the same as in 2013, before rising slightly to 19.10
million b/d, largely on growth in hydrocarbon gas
liquids and distillate demand.
More pipelines to carry crude
to USGC narrows WTI differentials
Crude output from the Permian Basin still outpaces
takeaway capacity but differentials are narrowing as
pipeline infrastructure comes online to carry oil from
West Texas and eastern New Mexico to refineries
on the US Gulf Coast, Platts data showed Tuesday.
Platts unit Bentek Energy has estimated December
Permian crude production at 1.8 million b/d, with
current pipeline capacity in the region at 1.5 million
b/d and local refinery demand at 400,000 b/d. The
railway will play a negligible role in moving crude out
of the Permian Basin, though there is potential for
it to absorb incremental production if pipelines are
unable to run at or near nameplate capacity. Crude
volumes carried by rail were likely to be sporadic
unless arbitrage opportunities arise for locations
not accessible by pipelines from the Permian Basin,
such as the US West Coast. Prior to the completion
of the Bridgetex pipeline in September, the Permian
Basin lacked sufficient local demand and takeaway
capacity, resulting in WTI ex-Midland trading at a
discount of as much as $14.65/b to WTI ex-Cashing,
according to Bentek. Bridgetex operator Magellan
said deliveries on the 300,000 b/d crude line began
commercially in September, but traders said the rate
ranged over 110,000-200,000 b/d initially with full
rates anticipated by the end of the year. “WTI Midland
has strengthened steadily since the Bridgetex pipeline
became operational, causing prices to reach near
10
NORTH AMERICAN CRUDE AND PRODUCTS SCAN
parity with WTI in the past two weeks,” Bentek Energy
analyst Nicole Leonard said. As less crude is stranded
in the Permian Basin, the spread between WTI out of
Cushing and WTI ex-Midland narrowed. The discount
for WTI from the smaller oil hub of Midland, Texas,
averaged $10.52/b in the third quarter compared with
barrels out of Cushing, Oklahoma, Platts data shows.
So far in Q4, WTI ex-Midland is trading at an average
discount of $3.55/b to WTI ex-Cushing. West Texas
Sour ex-Midland traded at an average discount of
Copyright © 2014, McGraw Hill Financial
december 9, 2014
$5.70/b to WTI ex-Cushing in 2013. Increased pipeline
access to US Gulf Coast refineries has narrowed that
differential to an average of $2.06/b so far in 2014.
On Monday, WTI ex-Midland traded at a discount of
only 55 cents/b to WTI ex-Cushing.
11
© Copyright 2026 ExpyDoc