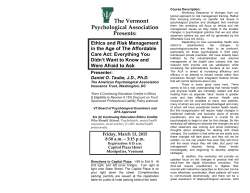
Publication: Bulletin of the World Health Organization; Type: Research
Article ID: BLT.14.140368
Willemijn LA Schäfer et al.
Assessing primary care
This online first version has been peer-reviewed, accepted and edited,
but not formatted and finalized with corrections from authors and proofreaders.
Assessing the potential for improvement of primary care in
34 countries: a cross-sectional survey
Willemijn LA Schäfer,a Wienke GW Boerma,a Anna M Murante,b Herman
JM Sixma,a François G Schellevisa & Peter P Groenewegena
a
NIVEL, the Netherlands Institute for Health Services Research, PO BOX 1568, 3500 BN Utrecht,
Netherlands.
b
Scuola Superiore Sant’Anna, Istituto di Management, Laboratorio Management e Sanità, Pisa, Italy.
Correspondence to Willemijn LA Schäfer (email: [email protected]).
(Submitted: 22 April 2014 – Revised version received: 10 December 2014 – Accepted: 18 December
2014 – Published online: 28 January 2015)
Abstract
Objective To investigate patients’ perceptions of improvement potential in primary
care in 34 countries.
Methods We did a cross-sectional survey of 69 201 patients who just visited
general practitioners at primary-care facilities. Patients rated five features of personfocused primary care – accessibility/availability, continuity, comprehensiveness,
patient involvement and doctor-patient communication. One tenth of the patients
ranked the importance of each features on a scale one to four and nine tenths of
patients scored their experiences of receiving care. We calculated the potential for
improvement by multiplying the proportion of negative patient experiences with the
mean importance score in each country. Scores were divided into low, medium and
high improvement potential. Pair-wise correlations were made between improvement
scores and three dimensions of the structure of primary care – governance,
economic conditions and workforce development.
Findings In 26 countries, one or more features of primary care had medium or
high improvement potentials. Comprehensiveness-of-care had medium to high
improvement potential in 23 of 34 countries. In all countries, doctor-patient
communication had low improvement potential. An overall stronger structure of
primary care was correlated with a lower potential for improvement of continuity and
comprehensiveness of care. In countries with stronger primary care governance
patients perceived less potential to improve the continuity of care. Countries with
better economic conditions for primary care had less potential for improvement of all
features of person-focused care.
Conclusion In countries with a stronger primary care structure, primary care
has less potential for improvement perceived by patients.
Page 1 of 16
Publication: Bulletin of the World Health Organization; Type: Research
Article ID: BLT.14.140368
Introduction
Due to the increased prevalence of comorbid conditions, people often have more than one
disease that needs to be managed consistently over time.1,2 Health-care providers can do this
through a person-focused approach, which entails goal-oriented, rather than disease-oriented
care. The goal is to manage people’s illnesses through the course of their life.1,2 Therefore,
person-focused care should be continuous, accessible and comprehensive. It should also be
coordinated when patients have more than one provider.1
Patients’ assessment of health care can be divided into what patients find important
and what they have experienced.3–5 Importance refers to what people see as desired features of
health care – i.e. patients’ instrumental values.6 The combination of instrumental values and
patients’ experiences constitute quality judgments, which provides insight on the extent to
which health care providers meet these values. Both instrumental values and experiences of
primary care patients vary between countries.6–8 These judgements can be transformed into a
measure of improvement potential. When an aspect of care is experienced as poorly
performed, but not considered important, this can be seen as less of a quality problem than if
patients consider the aspect important.9 More important aspects of care thus have higher
improvement potential.
The structure of primary care can relate to person-focused care in various ways. In
stronger primary care structures the providers are more likely to be involved in a large scope
of health problems in different stages of the patients’ lives. This is expected to increase
continuity of care and providers’ responsiveness to the patients’ values regarding continuity,
comprehensiveness and communication. Patients will use services more readily if they know
a broad spectrum of care is offered.10 A stronger primary-care structure is associated with
more accessible primary care,11 which is one of the core features of person-focused care.
Therefore, we expect that in countries with a stronger primary care structure, the patientperceived improvement potential of person-focused primary care is lower.
Primary care structure comprises governance, economic conditions such as the mode
of financing of providers and expenditures on primary care, and workforce development –the
profile and the education of the primary care providers.12,13
We wished to quantify the extent to which the structure of primary care at the national
level in 34 countries is related to patient-perceived improvement potential for features of
person-focused care. To study this relationship, the empirical relations between the providers
Page 2 of 16
Publication: Bulletin of the World Health Organization; Type: Research
Article ID: BLT.14.140368
– general practitioners – and patients need to be considered (Fig. 1). The primary care
structure influences behaviour of the practitioners, which will influence patients’ experiences.
Patients’ characteristics – e.g. age and income – influence patients’ individual experiences
and values. We focus on the system level to study characteristics that are amenable to policy
interventions.
Methods
We derived aggregated data on patient-perceived improvement potential in 34 countries from
the QUALICOPC study (Quality and Costs of Primary Care in Europe). In this study, patients
in 31 European countries (Austria, Belgium, Bulgaria, Cyprus, Czech Republic, Denmark,
Estonia, Finland, Germany, Greece, Hungary, Iceland, Ireland, Italy, Latvia, Lithuania,
Luxembourg, Malta, the Netherlands, Norway, Poland, Portugal, Romania, Slovakia,
Slovenia, Spain, Sweden, Switzerland, the former Yugoslav Republic of Macedonia, Turkey,
United Kingdom of Great Britain and Northern Ireland) responded to surveys. Three nonEuropean countries (Australia, Canada, New Zealand) were also included. In each country,
patients of general practitioners filled in the questionnaires (target: n = 2200 per country;
Cyprus, Iceland and Luxembourg n = 800). In Belgium, Canada, Spain and Turkey, larger
samples were taken to enable comparisons between regions (Table 1). We aimed to get a
nationally representative sample of general practitioners. If national registers of practitioners
were available, we used random sampling to select practitioners. In countries with only
regional registers, random samples were drawn from regions that represented the national
setting. If no registers existed, but lists of facilities in a country, a random selection form such
lists were made. The patients of only one practitioner per practice or health centre were
eligible to participate. Details of the study protocol have been published elsewhere.14,15
In nearly all countries (30), trained fieldworkers were sent to the participating
practices to collect patient data using paper questionnaires. In Denmark, Canada, New
Zealand and United Kingdom, and part of Norway and Sweden, the practice staff were
instructed to distribute and collect the questionnaires. The fieldworkers and practice staff were
instructed to consecutively invite patients, who had had a face-to-face consultation with the
practitioner and who were 18 years or older, to complete the questionnaire until 10
questionnaires per practice were collected. Of these ten questionnaires, nine assessed the
experiences in the consultation which had just occurred and one questionnaire included
questions about the patient’s values in primary care. The proportions of the questionnaires
were based on the findings that, within a country, patients’ experiences varied largely but
Page 3 of 16
Publication: Bulletin of the World Health Organization; Type: Research
Article ID: BLT.14.140368
there was a little variation in what the patients found important.7 In the patient experience
questionnaire, patients were asked to indicate whether they agreed with a statement by
selecting “Yes” or “No”. For example, the proportion of negative experiences for the
statement “during the consultation the doctor had my medical records at hand” would be the
proportion stating that the doctor did not have the medical records at hand. In the patient
values’ questionnaire – which contained the same questions as the patient experience
questionnaire – patients could indicate the importance of a statement, e.g. the importance of
the doctor having medical records at hand, by selecting “not important,” “somewhat
important”, “important” or “very important”. The answers were scored, ranging from 1 (not
important) to 4 (very important). Missing answers are excluded from the calculations.
Ethical approval was acquired in accordance with the legal requirements in each
country. The surveys were carried out anonymously. Data collection took place between
October 2011 and December 2013. The patient experience questionnaire was filled in by
61 931 patients and the patient values’ questionnaire by 7270 patients. Appendices A and B
contain the questionnaires (available at www.nivel.nl/pdf/Appendices-Assesing-the-potentialfor-improvement-of-PC-in-34-countries-WHO-Bulletin-2015.pdf).
Operationalization of concepts
Dependent variable
As an outcome indicator for health care, we used the patient-perceived improvement
potential, which is based on the consumer quality (CQ) index, a validated and standardized
measurement instrument.16 Person-focused primary care was measured with 16 items, such as
whether the practitioner displayed knowledge about the patient’s personal living
circumstances. The items were derived from the CQ index for general practice and tested in
the QUALICOPC pilot study.15,17 Improvement potential was expressed in improvement
scores, which are calculated by multiplying the proportion of negative experiences for each
question – the answers which indicate lower quality – with the value scores of the
corresponding statement per country. The value score was calculated by taking the mean
value for each country on a scale from one to four. A higher improvement score indicates a
higher need for improvement.
The improvement potential of each country was measured for the following main
features: accessibility/availability (five questions), continuity (three questions),
comprehensiveness (two questions), patient involvement (one question) and doctor-patient
Page 4 of 16
Publication: Bulletin of the World Health Organization; Type: Research
Article ID: BLT.14.140368
communication (five questions). For each feature, a mean patient-perceived improvement
score was calculated. Based on the range of scores found (0.11–1.95) the level of
improvement potential is considered relatively low (0.11–0.72), medium (0.73–1.34) or high
(1.35–1.95).
Independent variables
For 30 countries (Australia, Canada, New Zealand and the former Yugoslav Republic of
Macedonia were excluded), we collected data from the Primary Health Care Activity Monitor
(PHAMEU) study on a set of indicators for the dimensions governance, economic conditions
and workforce developments of the primary care structure.18 Examples of such indicators are
the availability of evidence-based guidelines for general practitioners (governance) and the
percentage of medical universities with a postgraduate programme in family medicine
(workforce development).18 The PHAMEU database provides scores indicating the strength
of each indicator, ranging from 1 (weak) to 3 (strong) and overall scale scores for each
dimension, calculated using a two-level hierarchical latent regression model, and an overall
structure score combining the three dimensions.11 Additionally, we collected data for
Australia, Canada, New Zealand and the former Yugoslav Republic of Macedonia using the
same methods as for the PHAMEU study. Table 1 lists the countries relative strength of
primary care structure, appendix C contains the indicators and Appendix D contains scale
scores per dimension.
Statistical analyses
One-tailed pairwise correlations were used to measure the associations between the
independent and dependent variables, because the hypothesis has one direction, namely that a
stronger primary care structure is associated with more person-focused care. P < 0.05 was
considered statistically significant.
Sensitivity analyses were done using an alternative method of analysis for the
improvement scores. Multilevel analyses were used to calculate country level scores of the
experience and values items, using the country level residuals of the items. The scores were
adjusted for several variables at the practitioner and patient level (e.g. age and gender of the
general practitioners and patients). When comparing the raw improvement scores and the
ones calculated on the basis of multilevel residuals no significant differences were found.
Correlation coefficients between the raw improvement scores as used in this article and the
adjusted improvement scores were above 0.91.
Page 5 of 16
Publication: Bulletin of the World Health Organization; Type: Research
Article ID: BLT.14.140368
In the PHAMEU conceptual model and corresponding database, gatekeeping
(practitioners determining the necessity for referral of patients to other levels of the health
system) is considered to be part of the process of primary care. However, in previous studies,
gatekeeping has been used as a potential determinant of primary care performance. Therefore,
additional sensitivity analysis was performed on the association between the improvement
potential and gatekeeping. The results of this analysis are presented in Appendix E. Analyses
were carried out using Stata version 13.0 (StataCorp. LP, College Station, United States of
America) and MLWin version 2.25 (University of Bristol, Bristol, United Kingdom).
Results
Improvement potential
In total, 69 201 patients completed the questionnaire and the average response rate was 74.1%
(range: 54.5% - 87.6%). A detailed overview of the experience scores of the patients, values
scores and patient perceived improvement scores per country is provided in Appendices F–H.
The background characteristics of the patients can be found in Appendix I.
For accessibility of care, five countries – Cyprus, Portugal, Slovakia, Spain and
Turkey – showed a medium level of improvement potential. The remaining countries showed
a low improvement potential. While most of the countries were found to have a low
improvement potential regarding the continuity of care, Greece, Malta and Turkey show a
medium level and Cyprus a high level. Comprehensiveness of care showed a medium level of
patient-perceived improvement potential in 20 countries and a relatively high level in Cyprus,
Malta and Sweden. Patients’ involvement in decision-making about their treatment has a
medium level of improvement potential in nine countries and a high level in Cyprus. In all
countries, values were relatively low for doctor-patient communication, indicating that the
primary care providers meet their patients’ expectations in this domain (Table 2).
The relatively high levels of patient-perceived improvement potential in Cyprus –
three features with high potential and one feature with medium – indicate weak performance
of primary care. In Turkey, three areas showed medium level of patient-perceived
improvement potential. Countries showing relatively low improvement potential in all
features were Australia, Belgium, Canada, Ireland, Latvia, Luxembourg, New Zealand and
Switzerland, indicating that primary care in these countries is perceived as person-focused.
Page 6 of 16
Publication: Bulletin of the World Health Organization; Type: Research
Article ID: BLT.14.140368
Primary care structure
The patient-perceived improvement potential for continuity and comprehensiveness of care
had a significant negative association with the overall structure of primary care. If a country
has a stronger primary care structure, primary care is more person-focused for these features.
For the separate structural dimensions, patients perceived care to be more continuous in
countries with stronger primary care governance. Stronger economic conditions in primary
care were found to be associated with all features of person-focused care. Although workforce
development correlated negatively with all features, none of the values were significantly
correlated (Table 3).
In eight countries where patient-perceived improvement potential is relatively low, the
overall strength of the primary care structure varies. The relative strength is strong in
Australia, Canada and New Zealand, medium in Belgium, Ireland and Latvia and weak in
Luxembourg and Switzerland. The strongest associations between strength and improvement
potential were found for economic conditions. These conditions are relatively strong in
Australia, Belgium and New Zealand and medium in Latvia and Switzerland.
Discussion
This study evaluates the extent to which primary care in 34 countries is personfocused by asking patients of general practitioners about what they find important and their
actual experiences. The combination of these aspects provides us with insight on what
patients perceive as priority improvement areas. In most countries primary care shows one or
more features with a medium or high level of patient-perceived improvement potential.
Accessibility and continuity of care show relatively low improvement potential, while in
many countries comprehensiveness is indicated as a priority area. In this study,
comprehensiveness of care indicates whether general practitioners ask their patients about
additional problems and whether there is opportunity to discuss psychosocial problems. Our
results confirm previous studies showing that practitioners perform well on general aspects of
communication.19–21 One explanation for this result could be the on-going relationship
between practitioners and their patients. Larger variations have been found between countries
for the relevance of communication and practitioners’ performance on specific issues.22 Eight
countries showed low improvement potential in all features, indicating positive patient
experiences. Previous studies in Australia and New Zealand have also found positive patient
experiences.23,24 Another study comparing 10 European countries, found positive patient
Page 7 of 16
Publication: Bulletin of the World Health Organization; Type: Research
Article ID: BLT.14.140368
assessments in Belgium, Germany and Switzerland and less positive assessments in the
United Kingdom and the Scandinavian countries.21 This is largely in line with our findings.
We could largely confirm the hypothesis that a stronger primary care structure is
associated with more person-focused care. Stronger structures were associated with more
continuous and comprehensive care. Continuity is an important aspect of person-focused care.
Stronger governance is also associated with more continuity. In countries with stronger
economic conditions for primary care we found less improvement potential in all areas.
The sensitivity analysis for the association between gatekeeping and patient-perceived
improvement potential showed that gatekeeping was associated only with lower perceived
improvement potential for continuity of care.
Strengths of this study were the inclusion of data from many countries and that
patients were asked about their actual experiences immediately after the consultation with
their practitioners. There were also limitations. First, there are countries where other providers
offer primary care besides general practitioners. These providers were not included in this
study. Second, only the actual visitors of general practices were surveyed. This means that we
do not have information about the persons who do not have access to such practices. In all
countries, improvement potential for accessibility of care might be higher than measured in
this study. For example, a report based on the Canadian QUALICOPC data found that patientreported access in this study is more positive compared to other previous studies.25–28 Third,
in Greece, most participating general practitioners worked in health centres, while there are
also many practitioners in Greece working outside health centres. Comparing different
countries should be done cautiously, since the extent to which general practitioners are
involved in primary care and the types of illnesses they treat differs between countries.
When measuring instrumental values and experiences of patients, people may judge
importance by what they have already experienced in health care.6 For example, when
practitioners in a country perform poorly on a certain aspect, patients might have lower
expectations and will find this aspect less important. Experiences and values of patients have
been found to be correlated,6 perhaps because patients seek health care providers who deliver
care according to their values.
The World Health Organization advocates for primary care that puts people first. A
stronger primary care structure is necessary to make progress towards this goal.10
Page 8 of 16
Publication: Bulletin of the World Health Organization; Type: Research
Article ID: BLT.14.140368
Acknowledgements
We thank partners in the QUALICOPC project; J De Maeseneer, E De Ryck, L Hanssens, A
Van Pottelberge, S Willems (Belgium); S Greß, S Heinemann (Germany); G Capitani, S De
Rosis, AM Murante, S Nuti, C Seghieri, M Vainieri (Italy); D Kringos (the Netherlands); M
Van den Berg, T Van Loenen (the Netherlands); D Rotar Pavlič, I Švab (Slovenia).
We thank the coordinators of the data collection in each country: L Jorm, I McRae
(Australia); K Hoffmann, M Maier (Austria); P Salchev (Bulgaria); W Wodchis, W Hogg
(Canada); G Samoutis (Cyprus); B Seifert, N Šrámková (Czech Republic); J Reinholdt
Jensen, P Vedsted (Denmark); M Lember, K Põlluste (Estonia); E Kosunen (Finland); C
Lionis (Greece), I Rurik (Hungary); J Heimisdóttir, O Thorgeirsson (Iceland); C Collins
(Ireland); G Ticmane (Latvia); S Macinskas (Lithuania), M Aubart, J Leners, R Stein
(Luxembourg); G Bezzina, P Sciortino (Malta); T Ashton, R McNeill (New Zealand); T
Bjerve Eide, H Melbye (Norway); M Oleszczyk, A Windak (Poland); L Pisco (Portugal), D
Farcasanu (Romania); T Dedeu (Spain); E Jurgova (Slovakia); C Björkelund, T Faresjö
(Sweden); T Bisschoff, N Senn (Switzerland); K Stavric (The former Yugoslav Republic of
Macedonia); M Akman (Turkey); C Sirdifield, N Siriwardena (United Kingdom).
FGS is also affiliated with the department of General Practice and Elderly Care
Medicine/EMGO Institute for Health and Care Research, VU University Medical Centre,
Amsterdam, the Netherlands. PPG is also affiliated with the department of Sociology and the
department of Human Geography, Utrecht University, Utrecht, the Netherlands.
Funding:
This article is based on the QUALICOPC project, co- funded by the European Commission
under the Seventh Framework Programme (FP7/2007-2013) under grant agreement 242141.
Competing interests:
None declared.
Page 9 of 16
Publication: Bulletin of the World Health Organization; Type: Research
Article ID: BLT.14.140368
References
1. Starfield B. Is patient-centered care the same as person-focused care? Perm J.
2011 Spring;15(2):63–9. http://dx.doi.org/10.7812/TPP/10-148
PMID:21841928
2. De Maeseneer J, van Weel C, Daeren L, Leyns C, Decat P, Boeckxstaens P, et al.
From “patient” to “person” to “people”: the need for integrated, peoplecentered healthcare. Int J Pers Cent Med. 2012;2(3):601–14.
3. van Campen C, Sixma HJ, Kerssens JJ, Peters L, Rasker JJ. Assessing patients’
priorities and perceptions of the quality of health care: the development of the
QUOTE-Rheumatic-Patients instrument. Br J Rheumatol. 1998 Apr;37(4):362–
8. http://dx.doi.org/10.1093/rheumatology/37.4.362 PMID:9619883
4. Sixma HJ, van Campen C, Kerssens JJ, Peters L. Quality of care from the
perspective of elderly people: the QUOTE-elderly instrument. Age Ageing.
2000 Mar;29(2):173–8. http://dx.doi.org/10.1093/ageing/29.2.173
PMID:10791453
5. Sixma HJ, Kerssens JJ, Campen CV, Peters L. Quality of care from the patients’
perspective: from theoretical concept to a new measuring instrument. Health
Expect. 1998 Nov;1(2):82–95. http://dx.doi.org/10.1046/j.13696513.1998.00004.x PMID:11281863
6. Groenewegen PP, Kerssens JJ, Sixma HJ, van der Eijk I, Boerma WG. What is
important in evaluating health care quality? An international comparison of
user views. BMC Health Serv Res. 2005 Feb 21;5(1):16.
http://dx.doi.org/10.1186/1472-6963-5-16 PMID:15723701
7. Kerssens JJ, Groenewegen PP, Sixma HJ, Boerma WG, van der Eijk I.
Comparison of patient evaluations of health care quality in relation to WHO
measures of achievement in 12 European countries. Bull World Health Organ.
2004 Feb;82(2):106–14. PMID:15042232
8. Grol R, Wensing M, Mainz J, Ferreira P, Hearnshaw H, Hjortdahl P, et al. Patients’
priorities with respect to general practice care: an international comparison.
European Task Force on Patient Evaluations of General Practice
(EUROPEP). Fam Pract. 1999 Feb;16(1):4–11.
http://dx.doi.org/10.1093/fampra/16.1.4 PMID:10321388
9. Jung H, Wensing M, de Wilt A, Olesen F, Grol R. Comparison of patients’
preferences and evaluations regarding aspects of general practice care. Fam
Pract. 2000 Jun;17(3):236–42. http://dx.doi.org/10.1093/fampra/17.3.236
PMID:10846142
10. The world health report 2008: primary health care now more than ever. Geneva:
World Health Organization; 2008.
11. Kringos D, Boerma W, Bourgueil Y, Cartier T, Dedeu T, Hasvold T, et al. The
strength of primary care in Europe: an international comparative study. Br J
Gen Pract. 2013 Nov;63(616):e742–50.
http://dx.doi.org/10.3399/bjgp13X674422 PMID:24267857
12. Kringos DS, Boerma WG, Hutchinson A, van der Zee J, Groenewegen PP. The
breadth of primary care: a systematic literature review of its core dimensions.
Page 10 of 16
Publication: Bulletin of the World Health Organization; Type: Research
Article ID: BLT.14.140368
BMC Health Serv Res. 2010;10(1):65. http://dx.doi.org/10.1186/1472-6963-1065 PMID:20226084
13. Kringos DS. The importance of measuring and improving the strength of primary
care in Europe: results of an international comparative study. Türk Aile Hek
Derg. 2013;17(4):14.
14. Schäfer WLA, Boerma WG, Kringos DS, De Maeseneer J, Gress S, Heinemann
S, et al. QUALICOPC, a multi-country study evaluating quality, costs and
equity in primary care. BMC Fam Pract. 2011;12(1):115.
http://dx.doi.org/10.1186/1471-2296-12-115 PMID:22014310
15. Schäfer WL, Boerma WG, Kringos DS, De Ryck E, Greß S, Heinemann S, et al.
Measures of quality, costs and equity in primary health care instruments
developed to analyse and compare primary care in 35 countries. Qual Prim
Care. 2013;21(2):67–79. PMID:23735688
16. Delnoij DM, Rademakers JJ, Groenewegen PP. The Dutch consumer quality
index: an example of stakeholder involvement in indicator development. BMC
Health Serv Res. 2010;10(1):88. http://dx.doi.org/10.1186/1472-6963-10-88
PMID:20370925
17. Meuwissen LE, de Bakker DH. [‘Consumer quality’-index ‘General practice care’
measures patients’ experiences and compares general practices with each
other]. Ned Tijdschr Geneeskd. 2009;153:A180. [Dutch.] PMID:19900331
18. Kringos DS, Boerma WG, Bourgueil Y, Cartier T, Hasvold T, Hutchinson A, et al.
The European primary care monitor: structure, process and outcome
indicators. BMC Fam Pract. 2010;11(1):81. http://dx.doi.org/10.1186/14712296-11-81 PMID:20979612
19. Noordman J, Koopmans B, Korevaar JC, van der Weijden T, van Dulmen S.
Exploring lifestyle counselling in routine primary care consultations: the
professionals’ role. Fam Pract. 2013 Jun;30(3):332–40.
http://dx.doi.org/10.1093/fampra/cms077 PMID:23221102
20. Noordman J. Lifestyle counselling by physicians and practice nurses in primary
care: an analysis of daily practice [Dissertation]. Nijmegen: Radboud
University; 2013.
21. Grol R, Wensing M, Mainz J, Jung HP, Ferreira P, Hearnshaw H, et al.; European
Task Force on Patient Evaluations of General Practice Care (EUROPEP).
Patients in Europe evaluate general practice care: an international
comparison. Br J Gen Pract. 2000 Nov;50(460):882–7. PMID:11141874
22. van den Brink-Muinen A, Verhaak PF, Bensing JM, Bahrs O, Deveugele M, Gask
L, et al. Doctor-patient communication in different European health care
systems: relevance and performance from the patients’ perspective. Patient
Educ Couns. 2000 Jan;39(1):115–27. http://dx.doi.org/10.1016/S07383991(99)00098-1 PMID:11013553
23. Patient experience 2011/12: key findings of the New Zealand health survey.
Wellington: Ministry of Health; 2013.
24. Healthy communities: Australians' experiences with primary health care in 201011. Sydney: National Health Performance Authority; 2013.
Page 11 of 16
Publication: Bulletin of the World Health Organization; Type: Research
Article ID: BLT.14.140368
25. Laberge M, Pang J, Walker K, Wong S, Hogg W, Wodchis W, et al. QUALICOPC
(Quality and Costs of Primary Care) Canada: a focus on the aspects of
primary care most highly rated by current patients of primary care practices.
Ottawa: Canadian Foundation for Healthcare Improvement; 2014.
26. Hogg W, Dyke E. Improving measurement of primary care system performance.
Can Fam Physician. 2011 Jul;57(7):758–60, e241–3. PMID:21753091
27. Blendon RJ, Schoen C, DesRoches C, Osborn R, Zapert K. Common concerns
amid diverse systems: health care experiences in five countries. Health Aff
(Millwood). 2003 May-Jun;22(3):106–21.
http://dx.doi.org/10.1377/hlthaff.22.3.106 PMID:12757276
28. Schoen C, Osborn R, Huynh PT, Doty M, Zapert K, Peugh J, et al. Taking the
pulse of health care systems: experiences of patients with health problems in
six countries. Health Aff (Millwood). 2005 Jul-Dec;Suppl Web Exclusives:W5509–25. PMID:16269444
Page 12 of 16
Publication: Bulletin of the World Health Organization; Type: Research
Article ID: BLT.14.140368
Table 1. Overview of the survey investigating the potential for improvement of
primary care in 34 countries, 2011–2013
Country
Australia
Austria
Belgium
Bulgaria
Canada
Cyprus
Czech Republic
Denmark
Estonia
Finland
Germany
Greece
Hungary
Iceland
Ireland
Italy
Latvia
Lithuania
Luxembourg
Malta
The Netherlands
New Zealand
Norway
Poland
Portugal
Romania
Slovakia
Slovenia
Spain
Sweden
Switzerland
The former
Yugoslav
Republic of
Macedonia
Turkey
United Kingdomc
No. of
general
practitioners
facilitiesa
133
180
411
221
553
71
220
212
128
139
237
221
221
90
191
219
218
225
80
70
228
131
203
220
212
220
220
219
433
88
200
143
No. of patient
experience
questionnaires
completed
1190
1596
3677
1991
5009
624
1980
1878
1121
1196
2117
1964
1934
761
1694
1959
1951
2011
713
626
2012
1150
1529
1975
1920
1975
1918
1963
3731
773
1791
1283
No. of patient
values’
questionnaires
completed
138
188
407
222
806
71
220
209
126
129
234
219
215
82
186
220
212
224
79
68
222
197
175
219
215
220
220
216
431
112
198
143
Relative
strength of
primary care
structureb
Strong
Medium
Medium
Weak
Strong
Weak
Weak
Strong
Medium
Medium
Medium
Weak
Weak
Weak
Medium
Strong
Medium
Medium
Weak
Weak
Strong
Strong
Medium
Weak
Strong
Strong
Weak
Strong
Strong
Medium
Weak
Medium
290
160
2623
1296
292
155
Medium
Strong
a
Patients of one general practitioners per facility were surveyed.
b
Based on Kringos et al. 2013.
c
Only patients in England were surveyed.
11
Page 13 of 16
Publication: Bulletin of the World Health Organization; Type: Research
Article ID: BLT.14.140368
Table 2. Mean patient-perceived improvement scores for primary care in 34
countries, 2011–2013
Country
Australia
Austria
Belgium
Bulgaria
Canada
Cyprus
Czech Republic
Denmark
Estonia
Finland
Germany
Greece
Hungary
Iceland
Ireland
Italy
Latvia
Lithuania
Luxembourg
Malta
The Netherlands
New Zealand
Norway
Poland
Portugal
Romania
Slovakia
Slovenia
Spain
Sweden
Switzerland
The former
Yugoslav
Republic of
Macedonia
Turkey
United Kingdomb
Accessibility
0.38
0.41
0.34
0.66
0.38
1.25
0.44
0.26
0.40
0.46
0.33
0.72
0.49
0.53
0.45
0.51
0.51
0.52
0.39
0.60
0.30
0.22
0.52
0.55
0.73
0.55
0.74
0.53
0.90
0.54
0.27
0.38
Continuity
0.14
0.38
0.26
0.56
0.11
1.40
0.26
0.18
0.22
0.36
0.27
1.08
0.49
0.24
0.26
0.31
0.26
0.38
0.31
1.17
0.25
0.11
0.31
0.56
0.19
0.30
0.53
0.32
0.29
0.62
0.18
0.23
0.77
0.42
0.84
0.30
Improvement scorea
Comprehensiveness
Involvement
0.42
0.17
0.97
0.65
0.57
0.26
1.34
1.17
0.52
0.18
1.95
1.47
1.00
0.79
0.82
0.56
0.87
0.80
0.81
0.55
0.81
0.50
0.70
0.77
1.05
0.48
1.14
0.46
0.72
0.66
0.91
0.76
0.67
0.70
0.62
0.84
0.62
0.57
1.36
0.65
0.91
0.47
0.52
0.18
0.93
0.52
1.02
0.90
0.50
0.73
1.04
0.65
1.12
0.63
1.16
0.78
1.16
0.57
1.38
0.60
0.60
0.27
0.92
0.61
1.06
0.77
Communication
0.16
0.20
0.22
0.34
0.12
0.38
0.18
0.23
0.22
0.21
0.20
0.24
0.30
0.24
0.37
0.42
0.40
0.24
0.23
0.33
0.28
0.12
0.21
0.23
0.27
0.29
0.28
0.23
0.36
0.27
0.16
0.14
0.38
0.47
a
The improvement score was calculated by multiplying the proportion of negative patient experiences
with the mean importance score.
b
Only patients in England were surveyed.
Note: Scores between 0.11–0.72 are coloured grey and were considered as a low level of patientperceived improvement potential. Scores between 0.73–1.34 are coloured light green and were
considered as a medium level of patient-perceived improvement potential. Scores between 1.35–1.95
are coloured dark green and were considered as a high level of patient-perceived improvement
potential.
Page 14 of 16
0.36
0.21
Publication: Bulletin of the World Health Organization; Type: Research
Article ID: BLT.14.140368
Table 3. Correlations between the strength of primary care structure and
patient perceived improvement scores in 34 countries, 2011–2013
Feature
Overall
Accessibility
Continuity
Comprehensiveness
Involvement
Communication
−0.2562
−0.3962*
−0.3230*
−0.2833
−0.1202
Primary care structure
Governance
Economic
conditions
−0.1136
−0.3187*
−0.3320*
−0.3833*
−0.1739
−0.3663*
−0.0484
−0.5768*
−0.0475
−0.3720*
*P < 0.05 (one-tailed).
Page 15 of 16
Workforce
development
−0.2244
−0.2263
−0.269
−0.2772
−0.0513
Publication: Bulletin of the World Health Organization; Type: Research
Article ID: BLT.14.140368
Fig. 1. Features that influence the extent to which primary care is personfocused
Levels
Characteristics
Outcomes
Structure of Primary Care
System
•
•
•
Governance
Economic conditions
Workforce developments
Policy relation
Improvement potential
•
•
•
•
Accessibility of care
Continuity of care
Comprehensiveness
Doctor-patient
Communication
Patient involvement
•
Service provision
Providers (General
Practitioners)r
Patient experiences
Person-focused care
Users of services
Patients
Instrumental Values
Person-focused care
Note: Instrumental value is what the patient finds important.
Page 16 of 16
© Copyright 2026 ExpyDoc