ISSN 2348 – 9928
IJAICT Volume -1, Issue-1, May 2014
Doi:01.0401/ijaict.2014.01.30 Published Online 05 (05) 2014
AN EFFICIENT APPROACH TO DETECT BLEEDING REGION IN GI
TRACT USING SEGMENTATION AND CLASSIFICATION TECHNIQUES
Ms. P.Mohanapriya
PG Scholar, Communication Systems,
Electronics and Communication Engineering,
Mahendra Institute of Technology,
Namakkal, Tamilnadu, India.
Mrs. M.Sangeetha
Assistant Professor,
Electronics and Communication Engineering,
Mahendra Institute of Technology,
Namakkal, Tamilnadu, India.
Abstract - Wireless Capsule Endoscopy (WCE) is a device to detect
abnormalities in colon, oesophagus, small intestinal and stomach to
distinguish bleeding in WCE images from non-bleeding is a hard
job by human reviewing and very time consuming. WCE is a new
technology that enables close examination of the interior portion of
the entire small intestine without the surgery. In digital image
processing the segmentation and classification is very difficult task.
If the segmented result is poor then the detection accuracy is very
poor. In this paper, we propose a new method for segmentation and
classification of bleeding images in WCE video using the threshold
technique and neural networks method to obtain the high detection
accuracy of bleeding and non-bleeding images. First, the image is
converting into HSI colour domain since it is closer to human
perception than the other colour domains. Second we segment each
images into bleeding and non-bleeding regions using threshold
technique. Finally we classify the segmented images into bleeding
and non-bleeding by the neural network method with the help of
GLCM feature extraction to obtain the better classification
performance.
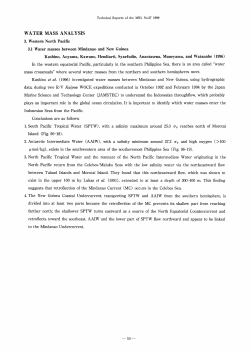
complimentary metal-oxide-silicon (CMOS) chip camera, a
short focal length lens, four white light emitting diode (LED)
illumination sources, two silver oxide batteries and an
ultrahigh frequency band radio telemetry transmitter. Fig.1
shows the endoscopic capsule with 8 parts (1) Optical dome,
(2) lens holder, (3) lens (4) illuminating LEDs, (5) CMOS
imager, (6) battery, (7) ASIC RF transmitter, (8) antenna.
The activated capsule after removal from the magnetic holder
provides image accrual and transmission at frequency of two
frames per second until the battery expires after 7±1h.
Keywords: Wireless Capsule Endoscopy, Normalized Cut
Segmentation, Threshold Technique, Neural Network, Gray Level
Co-Occurrence Matrix.
I.
INTRODUCTION
The far old endoscopy techniques such as colonoscopy push
enteroscopy and intraoperative enteroscopy are helped doctors
to visualize up to stomach from the upper part of terminal
ileum and colon from the bottom. There is no method to view
most of the small intestine without surgery. The endoscopic
capsule is the first autonomous micro device to explore the
human inner body of wide clinical application. It is ingested to
the patient and films the whole gastrointestinal tract during 6-8
h. The full system consists of the capsule itself, an external
receiving antenna and a portable hard drive carried in the
patient’s belt. The capsule endoscopy is a disposable plastic
capsule. The weight is 3.7g and measures (11mm 26 mm) 11
mm in diameter x 26mm in length. The contents include
Fig.1: Image of endoscopic capsule
In this paper, we propose a new method that classifies bleeding
images in WCE video using the HSI (Hue, Saturation and
Intensity) colour domain. While performing the segmentation
based on existing N-cut segmentation algorithm, poor detection
of bleeding region is resulted. To overcome this problem
threshold technique is used for the segmentation.
The outline of this paper is as follows. We will briefly discuss
about HSI Colour space conversion (see Section II), Image
segmentation strategy (see Section III). Then, we discuss the
neural networks of image classification strategy (see Section
IV).We will later explain our experimental result (see Section
V) followed by conclusion (see Section VI) and Future work
(see Section VII).
© 2014 IJAICT (www.ijaict.com)
Corresponding Author:
Ms. P. Mohanapriya, Mahendra Institute of Technology, Namakkal, Tamilnadu, India.
153
ISSN 2348 – 9928
IJAICT Volume -1, Issue-1, May 2014
II.
Doi:01.0401/ijaict.2014.01.30 Published Online 05 (05) 2014
HSI COLOUR SPACE CONVERSION
Although colour receptors in the human eye (cones) absorb
light with the greatest sensitivity inthe blue, green and red part
of the spectrum. In the perception process a human can easily
recognize basic attributes of colour i.e., hue, saturation and
intensity (HSI). The hue is a colour attribute that describes a
pure colour and represents the impression related to the
dominant wavelength of the colour stimulus.
The saturation corresponds to relative colour purity (lack of
white in the colour). For example, in the case of a pure colour
it is equal to 100%. Intensity is brightness. Maximum intensity
is sensed as pure white, while minimum intensity as pure
black. As a result of the HSI model is an ideal tool for
developing image processing algorithms based on colour
descriptions that are natural and intuitive to humans. Therefore,
we are going to use HSI colour domain by converting the input
raw data format RGB into HSI. For the HSI conversion we use
Kender’s Formulation as follows:
(
)
The two class of images from GI tract are given as a inputs.
Fig.2 and Fig.3 shows the some examples of bleeding and nonbleeding WCE images.
(a)
(b) (c)
(d)
(e)
Fig.3(a)Gastric antrum and pylorus,(b)Peristaltic wave in the gastric
antrum,(c)Sigmoid colon normal,(d)Cardia,(e)Gastric antrum and
pylorus,(f)Colon descende: Different organs of non-bleeding images.
(2)
if
III.
{
else
[
[
]
{
[
[
(a)
(b)
(d)
(e)
(f)
(1)
[
]
}
[
](3)
]
]
}
]
(c)
(f)
Fig.2 : (a)Ulcer with bleeding,(b) Gastric antrum ,(c) Stomach,(d),(e)pyloric
ulcer ,(f)-Different organs of bleeding images.
IMAGE SEGMENTATION
The existing N-cut segmentation algorithm with combining
multiple visual features such as edgemaps, creaseness, and
colour features are applied to the bleeding images. Then we
obtain the result using N-cut segmentation algorithm is shown
in Fig.4.
3.1 Image segmentation using multiple features with N-cut
algorithm
N-cut is a graph-theoretic approach for solving the grouping
problem in vision. It is a clustering-based segmentation
approach in which an image is represented as a weighted,
undirected graph whose nodes correspond to individual pixels
and graph weights are based on affinity between the pixels. Ncut has the intrinsic ability to combine a set of features to
calculate the affinity matrix to be used for images
segmentation.
Experiments show that a more simple strategy such as
multiplication of affinities from various visual features can
make multi feature fusion much simpler, unsupervised and
avoids the problems incurred by the optimization process:
© 2014 IJAICT (www.ijaict.com)
Corresponding Author:
Ms. P. Mohanapriya, Mahendra Institute of Technology, Namakkal, Tamilnadu, India.
154
ISSN 2348 – 9928
IJAICT Volume -1, Issue-1, May 2014
Doi:01.0401/ijaict.2014.01.30 Published Online 05 (05) 2014
(4)
Where
,
and
are
affinities
obtained
∑
(6)
Where P (i) is the class probability
usingedgemaps, creaseness, and colour features, respectively.
The total number of pixels in the image divided by the number
of pixels in the class.For practical purposes, calculating the
intra-class variance can become very time consuming.
Alternatively, variance between classes can be calculated. The
between class variance is the opposite of the intra-class
variance in that we take the threshold that produces the
maximum amount of variance rather than the minimum and
can be calculated using the following formula
(7)
IV.
Fig.4 Segmentation result of N-cut algorithm with multiple features
While performing the segmentation based on N-cut
segmentation algorithm, poor detection of bleeding region is
resulted. To overcome this problem simple segmentation
method is used for the segmentation process.
3.1 Image segmentation using Threshold technique
Several threshold methods are used for the segmentation. One
of the main and important methodis Otsu's method. It is used to
automatically
perform
clustering-based
image
thresholdingfrom the reduction of a graylevel image to a binary
image. The algorithm assumes that the image to be threshold
contains two classes of pixels or bi-modal histogram (e.g.
foreground and background) then calculates the optimum
threshold separating those two classes so that their combined
spread (intra-class variance) is minimal.
It works by first computing a set of histogram data usually
from pixel based image data of a greyscale image. Then for
each possible threshold value (the histogram bin number) we
calculate the variance of all the bins before and the bins after
that point to evaluate the spread within each of the classes. As
each potential threshold is evaluated, we keep track of the
threshold that produced the minimum intra-class variance so
far. Mathematically speaking, this can be defined by:
(5)
Where
is the weighting of the class given by:
IMAGE CLASSIFICATION
The image classification is performed based on the feed
forward neural network with GLCM feature extraction.
4.1 GLCM feature extraction
Gray-level co-occurrence matrix (GLCM) is the statistical
method of examining the textures that considers the spatial
relationship of the pixels. It is widely used to discriminate
texture images. Texture is one of the important characteristics
used in identifying objects or regions of interest in an image.
Texture contains important information about the structural
arrangement of surfaces. The textural features based on graytone spatial dependencies have a general applicability in image
classification. There are four GLCM textural features are used
to extract the information from the given image.
Contrast:
∑ ∑
(8)
This statistic measures the spatial frequency of an image and is
difference moment of GLCM. It is the difference between the
highest and the lowest values of a contiguous set of pixels. It
measures the amount of local variations present in the image.
A low contrast image presents GLCM concentration term
around the principal diagonal and features low spatial
frequencies.
Correlation:
∑ ∑
(9)
Where μx, μy, σx and σy are the means and standard deviations
of gx and gy .The correlation feature is a measure of gray tone
linear dependencies in the image.
© 2014 IJAICT (www.ijaict.com)
Corresponding Author:
Ms. P. Mohanapriya, Mahendra Institute of Technology, Namakkal, Tamilnadu, India.
155
ISSN 2348 – 9928
IJAICT Volume -1, Issue-1, May 2014
Doi:01.0401/ijaict.2014.01.30 Published Online 05 (05) 2014
Energy:
∑ ∑
(10)
This statistic is also called uniformity or angular second
moment. It measures the textural uniformity that is pixel pair
repetitions. It detects disorders in textures. Energy reaches a
maximum value equal to one. High energy values occur when
the gray level distribution has a constant or periodic form.
Energy has a normalized range.
Homogeneity:
∑ ∑
Basically, a feed-forward ANN is a (highly) parameterised,
adaptable vector function which may be trained to perform
classification.
Classification
(11)
This statistic is also called as Inverse Difference Moment. It
measures image homogeneity as it assumes larger values for
smaller gray tone differences in pair elements. It is more
sensitive to the presence of near diagonal elements in the
GLCM. It has maximum value when all elements in the image
are same. GLCM contrast and homogeneity are strongly but
inversely correlated in terms of equivalent distribution in the
pixel pairs population. It means homogeneity decreases if
contrast increases while energy is kept constant.
4.2 Feed Forward
classification
In this figure, thenotation of weights and biases follows
weights of connections between layer Pand layer Q are
indicated by
; the bias, input and output vectors of layer
Pare indicated by bp, Ip and Op respectively.
Neural
network
for
To perform classification, an ANN should compute the
posterior probabilities of given vectors x,
where is
the label of class j, j = 1, . . . ,m. Classification is then
performed by assigning an incoming sample x to that class for
which this probability is highest. A feed-forward ANN can be
trained in a supervised way to perform classification, when
presented with a number of training samples L = {(x, t)}. The
back propagation training algorithm tries to minimise the mean
squared error by adjusting the weights and bias terms.The MSE
function is given below
∑
Image
This paper will deal mostly with feed-forward ANNs (or multilayer
perceptron’s,
MLPs).
They
consist
of
interconnectedlayers of processing units or neurons. The first
layer has weights coming from the input. Each subsequent
layer has a weight coming from the previous layer. All layers
have biases. The last layer is the network output.
∑
(12)
V. EXPERMENTAL RESULT
The experimental result shows the entire procedure of this
paper. First the given input images are converted into HSI
space. Then based on the intensity value of the pixels the
threshold technique is used for the Segmentation process.
Bias b2Bias b3
Input image
Input 1
Class 1
HSI colour space
conversion
Input 2
Class 2
Visual feature
extraction
…
Class 3
Input m
W21
Thresholding
technique
W32
Fig.5 Structure of feed forward neural network
© 2014 IJAICT (www.ijaict.com)
Corresponding Author:
GLCM
featureextraction
Ms. P. Mohanapriya, Mahendra Institute of Technology, Namakkal, Tamilnadu, India.
156
ISSN 2348 – 9928
IJAICT Volume -1, Issue-1, May 2014
Doi:01.0401/ijaict.2014.01.30 Published Online 05 (05) 2014
(a)
Classification using
neuralnetwork
Bleeding images
Non bleeding
images
Fig.6 Structure of the entire segmentation and classification process
(b)
After the segmentation the classification is performed based on
the GLCM textural features. Finally, the Table 1 shows the
values of four GLCM textural features for different input
images.
STEP 1: Conversion of given input image into HSI.
(a)
(b)
Fig.8 Result of visual feature extraction (a) Bleeding image (b).Non-bleeding
image
STEP 3: Based on the value of intensity the threshold
segmentation algorithm is used.
(a)
Fig.7 Result of HSI space conversion (a) Bleeding image (b).Non-bleeding
image
STEP 2:Visual feature extraction from HSI image for the
segmentation process
(b)
Fig.9 Result of segmentation process (a) Bleeding image (b).Non-bleeding
image
STEP 4: Classification based on the neural network
© 2014 IJAICT (www.ijaict.com)
Corresponding Author:
Ms. P. Mohanapriya, Mahendra Institute of Technology, Namakkal, Tamilnadu, India.
157
ISSN 2348 – 9928
IJAICT Volume -1, Issue-1, May 2014
Doi:01.0401/ijaict.2014.01.30 Published Online 05 (05) 2014
(c)
(d)
(e)
(f)
(a)
Fig.11Result of segmenation and classification for bleeding images.
CLASS 2: Different organs of non-bleeding images are taken
from GI tract.
(b)
Fig.10 Result of classification process (a) Bleeding image (b).Non-bleeding
image
CLASS 1: Different organs of bleeding images are taken from
GI tract.
(a)
(a)
(b)
(b)
(c)
(d)
© 2014 IJAICT (www.ijaict.com)
Corresponding Author:
Ms. P. Mohanapriya, Mahendra Institute of Technology, Namakkal, Tamilnadu, India.
158
ISSN 2348 – 9928
IJAICT Volume -1, Issue-1, May 2014
Doi:01.0401/ijaict.2014.01.30 Published Online 05 (05) 2014
VII. FUTURE WORK
In the future, we plan to expand the experimental
validation of our proposed methodology across various
other objectives such as segmentation and classification of
polyps, cancer and ulcer with pre-processing of given
image. We also plan to quantify the clinical relevance of
various regions in a segmented image.
References
(e)
(f)
Fig.12Result of segmenation and classification for non-bleeding images.
Table 1 GLCM textural feature value for different input images.
Fig.no
Fig.1(a)
Fig.1(b)
Fig.1(c)
Fig.1(d)
Fig.1(e)
Fig.1(f)
Fig.2(a)
Fig.2(b)
Fig.2(c)
Fig.2(d)
Fig.2(e)
Fig.2(f)
Contrast
0.0302
0.0316
0.0227
0.0423
0.0291
0.0454
0.0178
0.0382
0.0206
0.0211
0.0221
0.0398
Correlation
0.9361
0.9277
0.9518
0.9106
0.9287
0.8775
0.9625
0.9157
0.9554
0.9575
0.9540
0.8945
Enegry
0.4986
0.5324
0.5063
0.4866
0.5634
0.5856
0.5078
0.5096
0.5173
0.4835
0.4972
0.5842
Hom
0.9849
0.9842
0.9886
0.9789
0.9854
0.9773
0.9911
0.9809
0.9897
0.9895
0.9889
0.9801
VI. CONCLUSION
Image segmentation and classification is an essential
component of CAD systems for diagnosis of bleeding and
non-bleeding in GE imaging. It is a challenging problem
given the dynamics of imaging conditions and imaging
modalities that add to the difficulty of computer-visionbased tasks for assisted decision making. A wide variety of
methods are available that can be used for segmentation
and classification of GE images. However, we chose
threshold technique and neural networkability to avoid
over segmentation for high textured images due to a global
optimization criterion, and their ability to accommodate
various visual features based on the nature/contents of the
images. Experiments show that the unique combination of
GLCM feature extraction gives the best classification
results since it provide complementary features for image
analysis. In this paper, we have focused on improving the
segmentation and classification performance for GE images
without considering the computational time as a key issue.
[1] Cunha, J. P., Coimbra, M., Campos, P.
and Soares, J. (2008)
‘Automated topographic segmentation and transit time estimation in
endoscopic capsule Exams’, IEEE Trans. Med. Imag., vol. 27, no. 1, pp.
19–27.
[2] FarhanRiaz , Francisco Baldaque Silva, Mario DinisRibeiro, and
Miguel Tavares Coimbra(2013) ‘Impact of Visual Features on the
Segmentation of Gastroenterology Images UsingNormalized Cuts’,
IEEE Transactions on Biomedical Engineering, vol. 60, no. 5.
[3] Ferlay ,J., Autier , P.,Boniol, M.,Heanue , M., Colombet, M. and Boyle,
P.(2007) ‘Estimates of the cancer incidence and mortality in Europe in
2006,’ Ann. Oncol., vol. 18, pp.581 -592.
[4] Figueiredo, I. N., Figueiredo, P. N., Stadler, G., Ghattas, O. and Araujo,
A.(2010) ‘Variational image segmentation for endoscopic human
colonic aberrant crypt foci’,IEEE Trans. Med. Imag., vol. 29, no. 4, pp.
998–1011.
[5] Hwang, S. and Celebi, M.(2010) ‘Polyp detection in wireless capsule
endoscopy videos based on image segmentation and geometric feature’,
in Proc. Int.Conf. Acoust. Speech Sig., pp. 678–681.
[6] Li,B. and Meng, M. H.(2009) ‘Texture analysis for ulcer detection in
capsule endoscopy images’, Imag. Vis. Comput., vol. 27, no. 9, pp.
1336–1342.
[7] Mylonaki, M., Fritscher-Ravens, A. and Swain, C. P.(2002) ‘Clinical
results of wireless capsule endoscopy,’ Gastrointest. Endosc., vol. 55.
[8] Riaz, F., Areia, M.,Silva, F. B., Nunes, P., Dinis-Ribeiro, M. and
Coimbra, M.( 2011) ‘Gabor textons for classification of
gastroenterology images’, in Proc.IEEE Int. Symp. Biomed. Imag., pp.
117–120.
[9] Sousa, Dinis-Ribeiro, M., Areia, M. andCoimbra, M.( 2009)‘Identifying
cancer regions in vital-stained magnification endoscopy images using
adapted colorhistograms’, in Proc. IEEE Int. Conf. Image Process.,pp.
681–684.
[10] Scapa, E. (2002) ‘Initial experience with wireless-capsule endoscopy for
evaluating occult gastrointestinal bleeding and suspected small bowel
pathology,’ Amer. J. Gastroenterology., vol. 97, pp.2776 -2779.
[11] Subodh K Shah, Pragya P Rajauria, Jeongkyu Lee, EmreCelebi,
M.(2007) ‘Classification of Bleeding Images in Wireless Capsule
Endoscopy using HIS Color Domain and Region Segmentation’, URINE ASEE.
[12] Yong-Gyu Lee and Gilwon Yoon,(2011) ‘Real-Time Image Analysis of
Capsule Endoscopy for Bleeding Discrimination in Embedded System
Platform,’.
© 2014 IJAICT (www.ijaict.com)
Corresponding Author:
Ms. P. Mohanapriya, Mahendra Institute of Technology, Namakkal, Tamilnadu, India.
159
© Copyright 2026 ExpyDoc