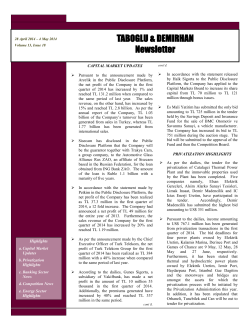
ISSN 1392-1258. EKONOMIKA 2014 Vol. 93(1) THE ECONOMIC CYCLE IN POLISH CONSTRUCTION Magdalena Gostkowska-Drzewicka* University of Gdańsk, Poland Abstract. The aim of this article is to determine the relation between the phases of the business cycle and changes in prices of factors of construction production. The research covers the years 1994–2012. The dataset applied in the study includes yearly data on prices of the factors of construction production in Poland. All of these data were made available by the SEKOCENBUD. The implementation of the purpose of the study required, firstly, to construct the curve of the economic cycle in the Polish construction industry and, secondly, to determi ne indicators of changes in the prices of construction production factors and to compare them with the curve reflecting the state of the economic cycle in the construction industry. It was based on the results of a monthly economic situation test, which are published by the Central Statistical Office in Warsaw. A record increase in the prices of production factors in construction was observed during the recovery in 2006–2007. It was caused by the intensified demand for various types of construction services. The deep slump in the construction industry was accompanied by a slight reaction of changes in the prices of construction materials and equipment to the decreasing demand in 2002–2004 and 2008–2012. The results of the study allow to conclude that changes in the prices of production factors in construction are closely related to the situation in the sector, but this re lationship is particularly noticeable in the growth phase of the cycle. Key words: economic cycle, building materials and labour, plot of land, real estate Introduction Changes in the economic situation have consequences in all sectors, including construction. This sector is not only influenced by economic impulses, but it may generate them as well (Gradzewicz et al., 2010; Załęczna, 2005; Wiśniewska, 2004). Even a slight increase in demand of the construction market may cause an increase in the production of materials and employment. Therefore, construction, considered together with the industry as the two most important sectors of the economy (Kałkowski, 2001), is an important factor of the economic growth (Kałkowski et al., 1992; Lipiński, 1937). As pointed out by M. Bryx (1999), resources aimed at the development of the construction industry contribute to the employment of many more workers than those allocated in other ways. Therefore, construction is the best means of combating the economic recession and unemployment. This thesis is confirmed by the theory of the multiplier, which was * Corresponding author: Department of Enterprise Finance, Faculty of Management, University of Gdańsk. ul. Armii Krajowej 101, PL 81-824, Sopot, Poland; [email protected] 98 presented by J.M. Keynes in 1936.1 However, impulses stimulating the economic growth are generated during the prosperity period in the construction industry. On the contrary, a recession in the construction market indicates the coming economic slowdown.2 The interdependence between the construction market and the economy can be supported by a number of indicators, such as the GDP produced by this sector, employment level, the, number of new facilities. The result of an economic growth in the construction sector is the increased activity in the realization of construction projects. It creates an increased demand on the market of the factors of production in construction. The rising rates of labour, building, sanitary and electrical materials, of rent for machines and other technical equipment result in increased costs of construction activities, which, on the assumption of achieving sales revenue at the unchanged level, reduces the profit margin. The decreasing difference between the sales revenue and the costs will slow down the activity of the construction companies. As a consequence, the economic situation in construction starts to slow down (Kucharska-Stasiak, 2006). The purpose of this study was to determine the relation between the phases of the business cycle and changes in prices of the factors of construction production. To investigate this problem, the author of this paper formulated the following research objectives: 1. To extract the economic cycle in the Polish construction industry in the years 1994–2012. 2. To analyze changes in the prices of factors of construction production. 3. To make a comparison of the curve of the economic cycle with the price changes of construction production factors. The following hypothesis was advanced: H1: There is a close relationship between the phases of the economic cycle and changes in the prices of construction production factors. The empirical verification of the hypothesis fills a gap in the existing research concerning prices of the factors of production in the context of economic fluctuations in Polish construction. Thus, this study may be helpful in the investment cost estimation process, which is a necessary condition of a correct investment efficiency appraisal. This view has been supported in the work of Pyhrr, Roulac and Born (1999). They state that 1 The multiplier effect is a result of the commitment of capital to finance construction projects, which in turn initiates the process of creating an additional revenue stream. As a result, an increased demand for various goods and services appears on the market (Keynes, 1956). 2 The various processes and categories observed in the construction market are used as components in the construction of the so-called leading economic indicators. This may be the number of permits issued for the construction of houses or the sold production of construction. The construction industry research conducted by the Central Statistical Office in Warsaw provides information about the trend of changes observed in the economy. Therefore, they are used to analyze the trends, economic growth and economic cycles. For more information, see (Walkowska (2011), Drozdowicz-Bieć (2012). 99 economic cycles in construction have been a significant underlying reason for the financial successes and failures of real estate investments throughout history. Description of the dataset and methodology The dataset applied in this study includes yearly data on prices of construction material factors of in Poland. The study presents changes in prices of: • building, installation, and electrical materials, • the construction equipment rental, • construction labour rates, • building plot for construction. All of these data were made available by Ośrodek Wdrożeń Ekonomiczno-Organizacyjnych Budownictwa Promocja (OWEOB Promocja) established in 1987. For years it continues to be a leader in the field of compiling, processing and publishing information concerning prices in the building industry. They are issued in the form of cyclical publications under the corporate SEKOCENBUD. The implementation of the purpose of the study required: • first, to construct a curve of the economic cycle in the Polish construction industry; • second, to determine the indicators of changes in prices of the factors of construction production and to compare them with the curve reflecting the economic situation in the construction industry. The economic cycle in the construction industry has been extracted on the basis of monthly business tendency surveys3 in accordance with the so-called Bry–Boschan procedure (1971). This method, despite the existence of many other procedures for extracting economic cycles and selecting the of turning points, is very popular (DrozdowiczBieć, 2012). The procedure allows the extraction of classic cycles using data available at a monthly frequency. In order to eliminate the impact of seasonal factors and to extract trends shaping an economic cycle, data were seasonally adjusted using 12 – a periodic moving average. Then the upper and lower turning points were selected. The month whose value is higher than those of the five preceding months and the five following months is regarded as the point of a potential peak. Analogously, the month whose value is lower than the five values on each side is regarded as the point of a potential trough. 3 Assessment of the situation of construction enterprises is based upon the subjective opinions about the actual and future business situation expressed by the directors of the surveyed companies. Results of business tendency surveys are presented in the form of monthly, quarterly and semi-annual data bases of indicators (Zagoździńska, 2007). 100 Contemporary theories of economic cycles In the modern sense, economic cycles emerged with the industrialization of the economy and market development, i.e. in the nineteenth century. Cycles of different frequencies were described during the development of the economies. N. Kondratieff identified the longest cycles lasting about 50–60 years. According to this researcher, the cause of their occurrence was using up the infrastructure and its renewal due to the technical progress. S. Kuznietz indicated shorter cycles lasting 15–23 years. He called them swings and associated their appearance with demographic processes, influx waves of immigrants and, as a consequence, the increased construction activity. Somewhat shorter cycles, lasting 8–10 years, were pointed by C. Juglar. According to this researcher, the cause of their formation was the excessive bank lending during the prosperity. J. Kitchin extracted the shortest cycles lasting 2–4 years. He saw the reasons for their occurrence in delayed flows of information, which caused the maladjustment of production volume to the current demand, an excessive increase in inventories and, as a consequence, the decline in commodity prices and the production limitation. Contemporary economists have focused their attention on two types of cyclical fluctuations: on classical (levels) cycles and shorter (growth) cycles (Drozdowicz-Bieć, 2012). A.F. Burns and W.C. Mitchell (1946) are considered as the precursors of research on economic cycles. According to these authors, the cycles are a type of fluctuations in the aggregate economic activity. They consist of an expansion followed by a recession, i.e. an economic contraction period and subsequent recovery period, leading to its development (expansion) in the next cycle. In turn, M. Drozdowicz-Bieć (2012) refers to the concept developed by J.A. Schumpeter who identified four phases of the business cycle, namely recession, depression, recovery, and growth. Slightly different phases of the business cycle are presented by J.R. Meyer and D.H. Weinberg (1975). They single out: recession, recovery, demand-pull inflation, and stagflation. According to these authors, the recession is a period of a certain duration, in which the total aggregate activity somewhat declines from the previous peak levels. It has a significant impact on various fields of economy and lasts at least a year. Recovery is a period of economic revival. It is characterized by relatively stable prices, increasing production and productivity. The state of demand-pull inflation is a period during which production is at capacity constraints, but the effective demand is even greater, thus resulting in rising prices and declining productivity. Stagflation is a situation of stagnation or a very slow growth mixed with a relatively high level of price inflation. The cyclical nature of development is characteristic of all sectors of the economy, the real estate market included. The business cycle in this market is defined by recurrent but irregular fluctuations in the rate of all property total return, which are also apparent 101 in many other indicators of property activity, but with varying advances and lags against the whole property cycle. The literature emphasizes that the duration and amplitude of fluctuations in real estate cycles varies considerably in local markets. This diversity follows from the specific features of these markets. These tendencies are observed only in a short period of time. In a long term, cycles in the local real estate markets are subject to common trends shaped by the macroeconomic factors (Mueller, 2002; Hoyt, 1947). Studies conducted in Western countries have shown that real estate markets are subject to strong recurring and irregular fluctuations. According to a survey of the U.S. market, cycles in the construction last 3 to 7 years or are shorter (Dasso, Ring,1989). A research in the nineties (Kaiser, 1997) has found that they last 7.25 to 8 years. However, A. Wenzlic – one of the pioneers of research on business cycles the U.S. housing market – using the so-called 120-city index identified a cycle in the construction industry which lasts 18.3 years (Brown,1984). In a British research, these cycles recur every 4–5 years, and in a Dutch study every 8–10 or even 9–11 years (Wiśniewska, 2006; Kucharska-Stasiak, 1999). The relationship between supply and demand in the property market is shaped by long-term (50 years) economic fluctuations and by the mentioned (18.3 years) cycles in the construction industry. It is emphasized that construction costs cease growing when the situation in the construction sector deteriorates (Dewey, 1970; Brown, 1984). As mentioned above, such studies are particularly useful in the investment decision-making process in the real estate market. The economic cycle in the construction sector of Poland in 1994–2012 In 1994–2012, the situation in the Polish construction industry showed cyclical fluctuations. During this period, two full and one newly initiated economic cycles could be traced. The first cycle was initiated during the economic recession in the early 90s of the 20th century. The end of this cycle occurred in the second half of 1997, i.e. at the time when the economic activity in the construction sector also peaked, setting the upper turning point. Thereby the second cycle was initiated in the second half of 1997. It lasted until the mid-2007. June 2007 is regarded as the peak which preceded the beginning of the third cycle (Fig. 1). In Poland, after the period of a profound systemic transition of the early nineties, the situation in the construction industry underwent a gradual improvement since 1994. During this period, the construction market underwent a considerable restructuring. The origin of many contemporary construction companies carrying on their business should be sought in the process of transformation of the Polish economy, in which reforms of the construction sector had an important place. An essential objective in the process of political changes was to build markets of particular goods and services in a manner consistent with the standards of countries with developed market economies. In the centrally 102 economic cycle indicator Years Economic cycle in construction FIG. 1. The economic cycle in the construction sector of Poland, 1994–2012 Source: Own elaboration, based on: Central Statistical Office of Poland, 2007–2013. planned economy, construction companies belonged to the state sector. In 1990–1993, 40% of all state-owned construction companies in Poland underwent ownership transformation.4 In the mid-90s, the market of private construction companies had just begun to take shape, and the improving economic situation (the economic cycle indicator amounted to 25) was conducive to its development. This period did not last long. In the second half of 1997, a gradual downturn began. It accelerated rapidly in July 2000 (the economic cycle indicator decreased almost to the level of 15), leading the construction market into recession in the years of 2002 to 2004 (the economic situation indicator took negative values of about –5). Two troughs were observed during this recession. They resembled the shape of W (Fig. 1). The first trough was noted in April 2002 and the second in March 2004. Between them, in mid-2003, there was a short-term recovery in the construction (economic situation indicator stood close to 0, but it was positive). The recovery was mainly due to the activities of individual investors. They tried to complete the commenced construction works before the end of the 2003, because they were afraid of increased construction costs related to the introduction of the 22% VAT rate on construction materials. A vast improvement in the economic condition was noted in the first half of 2004. Then a period of recovery began, and it lasted for over 3 and a half years. It was mainly 4 Privatization of state enterprises in Poland was made primarily on the basis of the Law on privatization of state-owned enterprises on July 13, 1990. It specifies the privatization of two major ways, namely the indirect (the capital) and direct (liquidation). Indirect privatization consists of two stages. The first is commercialization, the process of transforming the state enterprise into a company. The second stage is the appropriate privatization which means offering the shares to third parties. The capital way is in the assumption available to the state enterprises achieving good financial results or having such perspective, and therefore is particularly relevant to large enterprises. Direct privatization involves converting a state-owned enterprise for the specific purpose. It may be held on the way: selling an enterprise or an organized part of the property belonging to it, bringing a state enterprise or its organized part to a company; handing over for a period of time for business or rental use the whole enterprise or part of the property package (Ustawa z dnia 13 lipca 1990 O prywatyzacji przedsiębiorstw państwowych). 103 due to decreasing the interest rates of mortgage and increasing lending activity conducted by banks. The household debt in the banks increased from 183 billion PLN (16% of GDP) on 31 December 2006 to 526 billion PLN (33.6% of GDP) at the end of 2010. The majority of these loans (311 billion PLN) were financed by housing construction which should be considered as an important factor in the growth of the Polish economy (Ancyparowicz, Stanisławski, 2012). In 2006, the recovery turned into a boom. Such a situation was unprecedented in the history of the Polish construction market. This state continued until mid-2007. Construction companies experienced high profits and a vast growth in that period (Gostkowska-Drzewicka, 2011). A record increase in the price level of the factors of production in construction was also observed during that period. It was caused by the increased demand for various types of construction services. Many new building companies began their activity, while the then-existing enterprises increased the scale of their operation. The demand for construction works outstripped the supply. It stimulated the further growth in the prices of construction factors, particularly materials and labour. As a result, there was overproduction which resulted in the initiation of a new cycle. It was preceded by the upper turning point in the cycle in the second half of 2007. In 2008, the situation in the construction market suffered a significant deterioration. It was associated with the global financial crisis. Changes in the domestic credit market were attributed to it. A decline in the lending activity of the banks, connected with an increase in margins and a rigorous assessment of the creditworthiness of customers, which especially concerned developers and individual investors applying for mortgages, ensued (Siemińska, 2010). The first trough of the cycle was noted in mid-2009 (the economic cycle indicator reached a value close to –17). A slight improvement in the economic cycle, which was observed in the mid-2010 and in 2011 turned out to be not the same as a recovery. In that period, the economic cycle indicator decreased again and reached the level of –15 in the first quarter of 2012. The adverse trends observed in 2008–2012 affected, among others, the financial results of the construction companies and especially gave rise to a drop in the probability and liquidity ratios combined simultaneously with an increase in short-term accounts receivable for deliveries and services and the current liabilities.5 It resulted in payment bottlenecks, which led to the intensification of bankruptcy processes in the construction sector. In 2011, the growth rate in the number of the bankruptcies of construction enterprises began to rise at a rapid pace. In the next (2012) year, it reached the highest level throughout the period, i.e. 152% (Coface, 2013). 5 In the first quarters of 2008–2011, the profitability rate of net sales amounted to 2.4% (2008) –0.7% (2009), 0.2% (2010), –1.6% (2011). However, at the end of the third quarter, these indicators reached the values of 5.1% (in 2008), 5.3% (2009), 3.9% (2010), 2.2% (2011) (Central Statistical Office of Poland, 2012). 104 Prices of material factors of construction production Prices of the material factors of construction production are significantly associated with the situation in the sector. As it has already been mentioned, the price level in the market is shaped by the relationship between supply and demand. An opportunity to raise prices is demand increase. In the construction market, it results in an increase in the costs of construction of buildings, which include: • direct costs, including costs of materials, labour costs, building equipment costs, and external transportation costs; • indirect costs. In addition to the above costs, the final price of a building is determined by the cost of the building plot (SEKOCENBUD, 2009), profit of the executive company, and VAT. The construction company’s profit level, i.e. margin, depends on the market situation. Prices of material factors of the construction production are significantly related to the situation in the sector.6 A decline in the price growth of construction materials from 30.3% to 0.4% was observed in Poland in 1995–2002. It was closely associated primarily with a decreasing inflation7. However, in 2003, the pace was negative (–0.6%). In the following year (2004), the prices increased by as much as 9.3%. The further decline of prices (–0.8%) was noted in 2005. Since 2006, prices had been increasing by 4.5% initially, followed by as much as 17.6% in 2007. Such a large increase in prices was a consequence of the boom in the construction market. In 2008, the growth of prices was halted. A decrease of the prices of construction materials, amounting to –3.9%, was noted in 2009 (Table 1.). Changes in the rates of construction equipment were characterized by cyclical variations in 1996–2012. After a significant increase in these rates in 1997 (28.5%), there was a decline in the pace of price increases until their complete slowdown in 2002. In 2003, a slight decrease was observed (–0.3%), followed by a slight increase in 2004–2006. It was ranging from 2.9% to 1.8%. However, an increase in the rates of construction equipment to 10.6% was noted in 2007. In 2008–2011, the pace of growth slowed down significantly again. It was on the level of 3% in 2008, 2.9% in 2011, and 1.3% in the first quarter of 2012. It should be mainly attributed to the effects of seasonal changes (Fig. 2). 6 In the literature, it is emphasized that the relations between supply and demand in the property market are shaped by long-term (50-year) economic fluctuations and the cycles lasting 18.3 years in the construction industry. The construction costs cease growing when the situation in the construction sector is deteriorating (Dewey, 1970; Brown, 1984). 7 In Poland, during the first half of the nineties of the twentieth century, the phenomenon of a galloping inflation occurred. It had its origin in the insatiable demand and the release of food prices. In the subsequent years, the inflation rate declined steadily, but its level was still expressed in a two-digit number. In 1995, it was on average 27.8%. In 1999, for the first time since the beginning of the transformation period, a single-digit average annual inflation rate was achieved. It reached 7.3%. In the case of inflation calculated relative to the corresponding month of the previous year, it was a bit earlier (in October 1998); the inflation rate then was at the level of 9.9%. In 2000, the average inflation rate increased to 10.1%. However, in subsequent years, a steady decline in inflation was observed; in 2003 it was the lowest throughout the period and amounted to 0.8% (www.money.pl, 2012). 105 TABLE 1. Indicators of changes in the prices of building materials in Poland in 1997–2012, in % (IV quarter of the previous year = 100) Change in price (compared to the IV quarter of the previous year) Building mateInstallation maElectrical mateMaterials rials terials rials (total) 30.7 24.1 34.9 30.3 No. Years 1. 1995* 2. 1996* 29.4 24.5 27.6 29.0 3. 1997* 13.8 19.1 9.2 14.0 4. 1998* 12.5 14.5 7.2 12.5 5. 1999 4.7 9.5 6.3 5.0 6. 2000 5.6 6.3 9.2 5.7 7. 2001 4.1 4.6 4.2 4.1 8. 2002 0.4 -0.6 1.3 0,4 9. 2003 -0.6 -0.4 -0.6 -0.6 10. 2004 9.1 9.3 11.9 9.3 11. 2005 -1.5 2.9 2.1 -0.8 12. 2006 3.0 2.7 26.2 4.5 13. 2007 19.5 8.1 12.4 17.6 14. 2008 4.6 4.0 -24.3 2.2 15. 2009 -4.9 1.2 1.1 -3.9 16. 2010 0.2 1.3 16.5 1.2 17. 2011 1.4 4.0 11.9 2.1 18. I quarter 2012 0.1 0.7 -3.2 0.0 % * Changes in the prices calculated for the first quarter of the year compared to the first quarter of the previous year. Source: own elaboration, based on SEKOCENBUD, 2004; SEKOCENBUD, 2012. Changes in the rates of construction equipment FIG. 2. Changes in the rates of construction equipment in Poland, 1996–2012 Source: own elaboration, based on SEKOCENBUD, 2004; SEKOCENBUD 2012. 106 The availability of land for investment is the crucial material factor of production, determining the possibilities of construction industry development. The land by its nature is a scarce resource, and its supply is fixed (Begg, Fisher, Dornbusch, 1993). This means that the resource of land for the investment are limited. In the category of land for housing construction, in the largest local markets, prices of building plots did not differ significantly in 2002–2006. However, the rapid rise in prices, initiated at the turn of 2006 and 2007, revealed widening differences among markets. And so, the most expensive plots were offered in Warsaw. High prices remained there until the end of 2008. However, in the second half of 2009, there were short-term downward trends that were reversed in 2010. In 2011–2012, this led to the growth and a relative stabilization of prices to about 1100 PLN per m,2 which means an approximately 3-fold increase as compared with 2002. In Wroclaw and Krakow, a similar trend was observed throughout this period. The rapid increase in land prices for housing development lasted there from the second half of 2006 to the first quarter of 2008. In this period, the prices reached the level of about 800 PLN per m2. During the second quarter of 2008 up to the first quarter of 2009, there were no significant changes in the land prices for housing. In 2010, land prices in Krakow fell to a level of about 600 PLN per m2. A similar situation was observed in Wroclaw; however, the fall in land prices was a little weaker there. In the first quarter of 2011, there was the end of the downward trend. In 2011–2012, land prices for housing stabilized at around 600 PLN per m2 in Wroclaw and 700 PLN in Krakow. In Trojmiasto, the rapid growth in land prices for residential construction ended in the fourth quarter of 2008. Then, until the end of 2009, these prices remained relatively stable, i.e. about 580 PLN per m2. At the beginning of 2010, a period of three consecutive quarters of growth in land prices began. Finally, in the third quarter of 2010, the prices reached the level of 750 PLN per m2. Then, until the second quarter of 2012, there was a slight drop in land prices, and in the third quarter of 2012 a re-growth was noted. In Poznan, a rapid increase in land prices for residential construction ended at the turn of 2007 and 2008. M2 of the building plot cost 550 PLN in the fourth quarter of 2008. In 2009–2012, there was a rise in prices, but it was not as large as in other markets. Finally, in the third quarter of 2012, the price per m2 of land for residential construction amounted to 632 PLN (Fig. 3). It should be noted that, despite the deepening recession in the construction industry, the price of land for residential construction increased slightly in all the markets analysed in the third quarter of 2012. Such trends were also observed in the category of land for commercial and service construction (Fig. 4). In 2002–2012, land prices for retail and service buildings in Warsaw, Gdansk and Poznan were steadily increasing. The highest level of prices reached the plots of land 107 Price of one square meter of building plot for housing (PLN) Trójmiasto Warszawa Wrocław Kraków Poznań FIG. 3. Price of one m2 of building plot for housing in selected Polish local markets, 2002–2012. Source: own elaboration based on SEKOCENBUD, 2002–2012. located in Warsaw. In the third quarter of 2012, one m2 of the building plot for commercial and service buildings in this city cost about 1200 PLN. In Trojmiasto, the price of such land ranged at the level of 165 PLN to 230 PLN per m2 in 2002–2006. The year 2007 began with a sharp increase in the prices of plots for commercial buildings located in this market. As a result, in the third quarter of 2012, per m2 of such a plot one had to pay 660 PLN. Similar trends were observed in Poznan. Prices of plots for commercial and service construction in this market ranged from 338 PLN per m2 in 2002 to 611 PLN in the third quarter of 2012. In Krakow, after a rapid increase in the prices of plots for commercial buildings, which lasted from the first half of 2007 to the first quarter of 2008, there was a sustainable period of stability until the first quarter of 2010. Then the price level decreased to 690 PLN per m2, whereas in the second quarter of 2011 the land for commercial and service construction in Krakow grew again (Fig. 4). The highest prices of building plots for industrial construction were noted in Warsaw throughout the period. In 2002–2006, one m2 of the building plot cost about 400 PLN. In 2007–2008, prices increased steadily up to the 700 PLN. After a slight decline noted in the first quarter of 2009, the prices of land for industrial construction began rising again. In the third quarter of 2012, they were at the level of 965 PLN per m2 (Fig. 5). In Krakow, a sharp increase in the price of land for industrial construction ended in the first quarter of 2009. The price of one m2 of the building plot reached the level of 600 PLN. In subsequent years, these prices increased slightly (up to 660 PLN per m2) in the third quarter of 2012. An increase and decreasing differences in the price of land for industrial construction located in Trojmiasto, Poznan and Wroclaw were observed also in 2002–2008. In 2008, per m2 of such a plot one had to pay respectively 355 PLN, 392 PLN, and 425 PLN. In 2009–2012, prices of building plots continued to rise. During the same period, there was a slight variation in these prices (Fig. 5). 108 Price of one square meter of building plot for commercial and service construction (PLN) Trójmiasto Warszawa Wrocław Kraków Poznań FIG. 4. Price of one m2 of building plot for commercial and service construction in selected Polish local markets, 2002–2012 Price of one square meter of building plot for industrial construction (PLN) Source: own elaboration based on SEKOCENBUD, 2002–2012. Trójmiasto Warszawa Wrocław Kraków Poznań FIG. 5. Price of one m2 of building plot for industrial construction in selected Polish local markets 2002–2012 Source: own elaboration based on SEKOCENBUD, 2002–2012. Prices in construction labour The price of labour in the construction industry is reflected in the estimate of the net labour cost rate in the following kinds of work: • general construction of investment, • sanitary, • electrical, • engineering, • completion of a high standard. Due to the long lifecycle of construction projects, dynamic changes in labour rates8, 8 Labour costs have been presented with the price indices denominated in PLN and used, among other things, to calculate the estimated value of the investment, planned costs of design, and planned construction costs (SEKOCENBUD, 2009). 109 TABLE 2. Changes in construction labour rates, 1997–2012, in % (IV quarter of the previous year = 100) No. Years 1. 2. 3. 4. 5. 6. 7. 8. 9. 10. 11. 12. 13. 14. 15. 16. 17. 18. 1995* 1996* 1997* 1998* 1999 2000 2001 2002 2003 2004 2005 2006 2007 2008 2009 2010 2011 I quarter 2012 Change in price (compared to the IV quarter of the previous year) of labour in the works General Completion Sanitary Electrical construction of Engineering of a high installations installations investment standard 30.3 24.4 29.6 28.5 . 22.0 19.7 22.0 21.4 . 56.1 52.1 49.0 49.2 . 34.3 35.8 36.3 36.5 . 7.,3 7.3 8.1 7.1 7.7 10.1 10.6 9.9 10.3 10.2 5.8 5.6 5.4 5.9 6.1 -4.5 -3.5 -3.6 -3.3 -5.7 -4.9 -4.4 -4.2 -3.7 -4.6 0.1 0.4 0.9 0. -0.2 0.8 1.2 0.9 -0.1 1.7 7.0 7.3 7.1 7.7 7.2 42.6 38.0 37.9 36.9 42.6 23.7 23.7 26.3 24.4 22.0 -3.5 -2.1 -3.0 -1.4 -1.4 1.1 1.2 1.0 0.7 -0.3 -0.3 0.8 1.1 1.1 -1.0 0.0 0.3 0.6 0.0 0.3 * Changes in the prices were calculated for the first quarter of the year as compared to the first quarter of the previous year. Source: SEKOCENBUD, 2004; SEKOCENBUD, 2012. as well as changes in the prices of materials and land could lead to an increased risk of changes in the cost of construction. In 1995–1997, prices of labour for all construction works grew rapidly from 30% to 56%. However, since 1998, after a very high growth rate in 1997 in all types of construction works, a declining growth rate occurred down to just under 6% in 2001. In 2002 and 2003, there was a decrease in the rates of labour, which affected most strongly completion works of a high standard (respectively –5.7% and –4.6%). In this case, the downward trend, although not significant (–0.2%), continued in 2004. Labour prices for other construction works decreased in 2002 and 2003 from –3.3% to –4.9%. However, in 2004 and 2005, a slight increase was noted, with the exception of engineering works where a slight (–0.1%) decline in the rates occurred. From 2006, an increase in the price of labour occurred again, and in 2007 the record level was noted. In this period, the rate of general construction of investment and of the high-standard completion grew by 42.6%. The rates of other types of construction works increased by about 38%. In 2008, the upward trends were already a little weaker, but the prices of labour for construction works increased by at least 22% 110 in the high standard completion and for electrical installation work by up to 26.3%. The sharp downturn in the property market, dated to the autumn of 2008, led in 2009 to a slight decline in the rates of labour (drops were noted in the range of sanitary installation works (–2.1%, engineering (–1.4%), high standard completion (–1.4%, electrical works (–3.0%), and general construction investment (–3.5%). However, in 2010–2011, the price of labour, except for the high standard completion, rose only slightly (Table 2). Relationships between the economic cycle phases in the construction industry and the prices of production factors M. Drozdowicz-Bieć (2012) states that in most of business cycles observed in the postwar history of highly developed economies, economic activity was associated with the accelerated price growth. Conversely, a decline in economic activity was accompanied by a decline in prices. As a result, various measures of inflation, e.g., CPI, behave procyclically. There is a wide range of different prices in the economy. Not all of them rise and fall at the same pace. Prices observed on the market are more or less sensitive to changes in the economic cycle. Such regularity is observed, inter alia, in the construction industry. The values of correlation coefficients calculated for the economic indicators in the construction industry and changes in the level of prices of production factors confirm this formulated thesis.9 A positive value of Pearson’s linear correlation coefficient indicates a moderate strength of the relationship between prices of building plots and the state of the economic situation in the construction industry. These plots are treated not only as a factor of production, but also as a capital investment. For this reason, the mechanism of forming their prices is much more complex than any other factor of production in construction. Building land prices are shaped by factors from both the macro environment and the local market. The most important of them, exerting a significant impact on the relationship of building plots supply and demand and thus the price level are: • influx of foreign investors, • location, • deficit of buildings, • speculative activity of investors, • factors related to the local spatial development plan. 9 The value of Pearson’s linear correlation coefficient calculated for the price of m2 of building plot for residential, commercial and industrial construction, and the indicators of general business tendency climate in construction amounted, respectively, to 0.487, 0.563, 0.319. In turn, the value of this index for the prices of construction materials, construction equipment rates and construction labour prices, and indicators of the general business tendency climate in construction amounted respectively to 0.765, 0.834, and 0.76. To calculate the correlation coefficient, data are presented in Figs. 1–2 and Tables 1–2. 111 The influx of foreign investors, especially in 2006–2007, contributed to the transfer of funds from foreign markets to Poland where investors were able to achieve with their involvement satisfactory rates of return (Czechowska, 2012). Location is a key factor influencing the price of building land in the local markets of Poland.10 The deficit of buildings (housing, commercial and service, industrial) accounts for the increased demand for building land (Grabowski, Strzeszyński, 2007). The activity of speculative investors, who at the time of boom in construction had bought the building land massively, led to the almost complete exhaustion of the resource of attractively localized plots. Some of these purchases were made also in the time when the construction market gave the first signals of economic downturn, such as in the second half of 2007 and in 2008. An incentive to intensify the speculative activity of investors on the land market in this period was mainly a slowdown in the growth of residential building prices. In 2009–2012, the period of a prolonged economic downturn, the ability to quickly unfreeze funds involved in speculative land purchases decreased, but this did not influence the reduction in prices significantly. The reason could be the fact that many investors treat the purchase of land as an investment representing the best protection of cash against inflation (Siemińska, 2011). This process was evident especially in the years 2011–2012. In that period, a high (about 4%) average annual inflation rate was observed (Money.pl, 2012). At the same time, despite the worsening economic situation in the construction industry, prices of building plots rose, especially in the category of land intended for construction and industrial services (Figs. 3, 4, 5). The price of land reclassified to a commercial use, according to Kucharska-Stasiak (2006), contains the value of the so-called hope11, which reflects the likelihood of land use for the purpose of construction. This proves that an increase of demand for land for its development in a concrete way influences the prices of building plots for another, less profitable use. Hence, similar trends in prices can be seen in different categories of land designated for construction. It should be emphasized that the data used in the studies relating to the shaping of land prices were available only for the period 2002–2012. They do not cover fully any of the cycles observed in the construction industry. Therefore, the results of research in the field of relationship between the prices of building land and the state of economic situation are only indicative and require further analysis after collecting a larger amount of new information. 10 Building plots located in provincial cities are offered at prices significantly higher than those located in the province. For example, in the 3rd quarter of 2012 the average price of a building plot for housing in the Tri-City was 730 PLN and in the Pomorskie Province 135 PLN. In turn, in Warsaw, the price of such plots stood at 1150 PLN and in Mazowieckie Province at 260 PLN (SEKOCENBUD, 2012). 11 The value of hope, H (Lp), is calculated from the relation H (Lp) = m / n (L2 / L1), where m is the number of development projects, and n is the number of properties offered, L2 is the price of the developed land, and L1 is the price of land at the current way of using it (Kucharska-Stasiak, 2006). 112 Economic cycle in construction Prices of construction materials Construction equipment rates Construction labour prices FIG. 6 The situation in the construction industry, changes in the construction materials prices, equipment and labour rates in the construction sector in Poland, 1996–2012 Source: own elaboration based on Figs. 1 and 2, Tables 1 and 2. In turn, the correlation coefficient calculated for the prices of construction materials, construction equipment rates, labour prices and economic cycle indicators in the construction industry shows a strong positive relationship among the variables. The procyclical character of price changes as compared with the situation in the construction is illustrated in Fig.6. In the years 1996–2002, there was a decline in the rate of price growth of construction materials. In 2003–2005, when the situation underwent a gradual improvement but still remained at a low level, prices fluctuated, with the prevailing downward trends which are consistent with the fluctuations of the curve depicting the state of economy. In 2006–2007, prices of construction materials rose sharply as a consequence of the boom in construction. The downturn in the construction industry, intensifying in the second half of 2008, led to a deterioration of the financial situation of construction companies. Nevertheless, during this period, there was a significant drop in prices. A slight decrease in prices of construction materials was observed only in 2009, i.e. in the period when the lower turning point of the economic cycle in construction industry was observed. In contrast, in 2010–2012, despite the deepening recession in the construction market, no significant changes in the prices of materials were noted. Similar trends were observed in the field of the equipment rental rates and labour prices in the Polish construction industry in 1996–2012. However, it is worth emphasizing that during the peak periods of the economic situation, i.e. in 1997 and 2007, the amplitude of fluctuations in the labour rates was significantly higher than in the building material prices and construction equipment rental rates. As has already been mentioned, in 1994–2012, two full and one newly initiated business cycles could be noted. The first cycle was initiated during the economic recession in the early 90s of the 20th century. The end of this cycle occurred in the second half 113 of 1997. Simultaneously, the construction market in Poland underwent a strong restructuring process associated with the transformation of the political system. The market mechanism characteristic of developed economies was created in that period. This fact had probably an influence on its functioning, which finds its expression in the observed discrepancies between the state of the economic situation and the prices of construction production. In 1997, i.e. during the period of prosperity in the construction industry, changes in the prices of labour and equipment rates were in line with the trends of the economic cycle. In contrast, the rate of increase in the prices of building materials showed a steady downward trend. It could be explained by the inflation which was still at a high level at that time – in 1997 it reached 14.9%.12 In turn, during the period of the second cycle, i.e. in 1998–2007, and in the beginning of the third cycle, a strong relationship between changes in prices of construction production factors and fluctuations of the curve illustrating the state of the economic situation in the construction industry is observed. Thus, first, in the period of prosperity there was a strong increase in the prices of production factors. The highest level of prices occurred at the time when the upper turning point of the economic cycle in construction was noted, i.e. in 2007. Such a state can be identified as a state of demand-pull inflation. Secondly, during the downturn, i.e. in 2008, there was a significant decline in the rate of increase in the prices of construction production factors. These prices, however, remained at a relatively high level, which can be described as a stagflation. Thirdly, in the period coinciding with the lower turning point of the economic cycle, i.e. in 2009, only a slight and short-lived drop in prices was observed. In 2010–2012, despite the deepening recession in construction, prices did not change and remained at a stable level. Conclusions These research results allow to conclude that changes in the prices of production factors are closely connected with the economic situation in construction. This relationship is particularly noticeable in the growth phase of the cycle. The record increase in the prices of production factors in construction, observed during the recovery in 2006–2007, was caused by the intensified demand for various types of construction services. The deep slump was accompanied by a slight reaction of changes in the prices of construction materials and equipment rates to the decreasing demand in the construction industry in the years 2002–2004 and 2008–2012. Similar trends were observed in the rates of labour price. However, the mechanism of shaping the prices of building land includes not only the conditions associated with the economic cycle in the sector. Building land is treated by investors as a collateral deposit of cash against the inflation. 12 In Poland, at the beginning of the transition period, the average inflation rate stood at about 1000%. In subsequent years, its level decreased steadily. In 1995–1999, the rate was respectively 27.8%, 19.9%, 14.9%, 11.8%, and 7.3% (www.money.pl, 2012). 114 REFERENCES Ancyparowicz, G., Stanisławski, M. (2012). Kurs walutowy i kredyt a fenomen wzrostu polskiej gospodarki w latach 2009–2011. Studia Ekonomiczne, 108. Katowice, Zeszyty Naukowe Wydziałowe Uniwersytetu Ekonomicznego. Begg, D., Fisher, S., Dornbusch, R. (1993). Ekonomia. Warszawa, Państwowe Wydawnictwo Ekonomiczne PWE. Brown, G. T. (1984). Real Estate Cycles Alter the Valuation Perspective. Appraisal Journal, Vol. 52 (4), pp. 539–559. Bry, G., Boschan, Ch. (1971). Cyclical Analysis of Time Series: Selected Procedures and Computer Programs. Technical Papers NBER. No. 20. Bryx, M. (1999). Finansowanie rozwoju budownictwa mieszkaniowego w miastach. Warszawa, Szkoła Główna Handlowa. Burns, A.F., Mitchell, W.C. (1946). Measuring Business Cycles. New York, NBER. Central Statistical Office of Poland (2012). Local Data Bank. Warszawa, Central Statistical Office of Poland. Central Statistical Office of Poland, (2013). Tendency Survey in Industry, Construction, Trade, Services and Investment, Current Database, Monthly Data – Warszawa, Central Statistical Office of Poland. Central Statistical Office of Poland (2007). The Situation in the Construction Industry – Archival database – the Monthly Data. Warszawa, Central Statistical Office of Poland. Czechowska, K. (2012). Migracja kapitału w skali globalnej a rynek nieruchomości. Studia i Materiały Towarzystwa Naukowego Nieruchomości. Olsztyn, Towarzystwo Naukowe Nieruchomości. Dasso, J., Ring, A.A. (1989). Real Estate Principles and Practice. New Yersey, Prentice Hall. Dewey, E.R. (ed.) (1970). The 18-year Rhythm. Cycles: Selected Writings. Pittsburgh, Foundation for the Study of Cycles. Drozdowicz-Bieć, M. (2012). Cykle i wskaźniki koniunktury. Warszawa, POLTEX. Gostkowska-Drzewicka, M. (2011). Koniunktura w budownictwie jako czynnik rozwoju rynku deweloperskiego. Stan i tendencje rozwoju rynku nieruchomości. Zeszyty Naukowe, 192. Poznań, Wydawnictwo Uniwersytetu Ekonomicznego. Grabowski, M., Strzeszyński, J. (2007). Kraków – rynek gruntów i land development. Kraków, MRN. Gradzewicz, M., Growiec, J., Hagemejer, J., Popowski, P. (2010). Cykl koniunkturalny w Polsce – wnioski z analizy spektralnej. Bank i Kredyt, Vol. 41 (5), pp. 41–76. Hoyt, H. (1947). The fffect of cyclical fluctuations upon real estate finance. The Journal of Finance, Vol. 2 (1), pp. 51–60. http://www.money.pl/. (2012). http://www.coface.pl/. (2013). Kaiser, R.W. (1997). The long cycle in real estate. Journal of Real Estate Research, Vol. 14(3), pp. 233–257. Kałkowski, L. (ed.) (2001). Rynek Nieruchomości w Polsce. Warszawa, TWIGGER. Kałkowski, L., Korecki, W., Rydzik, W., Stanisławska, W. (1992). Możliwości wykorzystania budownictwa mieszkaniowego jako czynnika ożywienia gospodarki. Problemy Rozwoju Budownictwa, Nr 1. Keynes, J.M. (1956). Ogólna teoria zatrudnienia, procenta i pieniądza. Warszawa, Wydawnictwo Naukowe PWN. Kucharska-Stasiak, E. (2006). Nieruchomość w gospodarce rynkowej. Warszawa, Wydawnictwo Naukowe PWN. Kucharska-Stasiak, E. (1999). Inwestowanie w nieruchomości. Łódź, Instytut Nieruchomości Valor. 115 Lipiński, E. (1937). Znaczenie budownictwa w życiu gospodarczym kraju. Warszawa, Materiały I Polskiego Kongresu Mieszkaniowego. Meyer, J.R., Weinberg D.H. (1975). On the classification on the recent cyclical experience. NBNER Inc. 55th Annual Report, September 1975, pp. 1–8. Mueller, G. R. (2002). What will the next real estate cycle look like? Journal of Real Estate Portfolio Management. Vol. 8 (2), pp. 115–125. Pyhrr, S.A., Roulac, S. E., Born, W.L. (1999). Real estate cycles and their strategic implications for investors and portfolio managers in the global economy. Journal of Real Estate Research, Vol. 18 (1), pp. 7–67. SEKOCENBUD. (2009). Biuletyn cen regionalnych w budownictwie BC. Warszawa, Ośrodek Wdrożeń Ekonomiczno-Organizacyjnych Budownictwa Promocja. SEKOCENBUD. (2002–2012). Wartość kosztorysowa inwestycji. Wskaźniki cenowe WKI. Warszawa, Ośrodek Wdrożeń Ekonomiczno-Organizacyjnych Budownictwa Promocja. SEKOCENBUD. (2004–2012). Zagregowane wskaźniki waloryzacyjne (ZWW). Warszawa, Ośrodek Wdrożeń Ekonomiczno-Organizacyjnych Budownictwa Promocja. Siemińska, E. (2011). Inwestowanie na rynku nieruchomości. Warszawa, Poltex. Siemińska, E. (2010). Funkcjonowanie deweloperów mieszkaniowych w Polsce w (po)kryzysowych warunkach gospodarczych. Studia i Materiały Towarzystwa Naukowego Nieruchomości. Olsztyn, Towarzystwo Naukowe Nieruchomości. Ustawa z dnia 13 lipca 1990 O prywatyzacji przedsiębiorstw państwowych (DZ. U. 1990, nr 51, poz. 928). Walkowska, K. (ed.) (2011). Badanie koniunktury gospodarczej. Zeszyt metodologiczny zaopiniowany przez Komisję Metodologiczną GUS. Warszawa, Departament Przedsiębiorstw Głównego Urzędu Statystycznego. Wiśniewska, E. (2006). Wpływ cykli koniunkturalnych rynku nieruchomości na poziom wartości rynkowej nieruchomości. E. Kucharska-Stasiak (ed.). Ryzyka banku w zakresie określania wartości nieruchomości dla celów kredytowych w Polsce na tle trendów w Unii Europejskiej. Zeszyt Hipoteczny, Nr 23. Warszawa, Fundacja na Rzecz Kredytu Hipotecznego. Wiśniewska, E. (2004). Rynek nieruchomości a gospodarka [in] E. Kucharska-Stasiak (ed.) Zachodnie rynki nieruchomości – Warszawa, TWIGGER. Zagoździńska, I. (ed.) (2007). Badanie koniunktury gospodarczej. Warszawa – GUS. Załęczna, M. (2005). Cykliczne zmiany aktywności rynku nieruchomości a rozwój gospodarczy. E. Kucharska-Stasiak (ed.). Podstawy funkcjonowania rynku nieruchomości. Ujęcie teoretyczne. Folia Oeconomica. Łódź, Wydawnictwo Uniwersytetu Łódzkiego. 116
© Copyright 2026 ExpyDoc