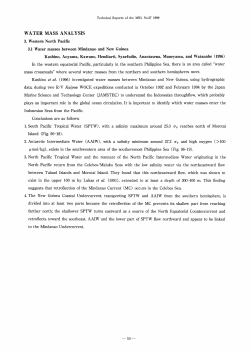
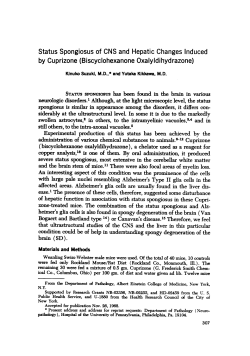
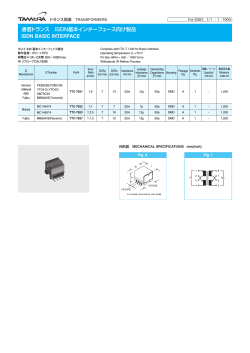
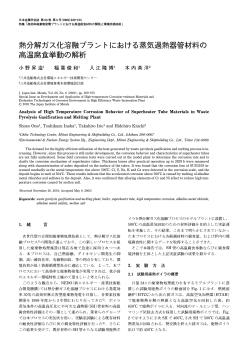
articles An activin receptor IIA ligand trap corrects ineffective erythropoiesis in β-thalassemia © 2014 Nature America, Inc. All rights reserved. Michael Dussiot1–5,13, Thiago T Maciel1–5,13, Aurélie Fricot1–5, Céline Chartier1–5, Olivier Negre6,7, Joel Veiga4, Damien Grapton1–5, Etienne Paubelle1–5, Emmanuel Payen6,7, Yves Beuzard6,7, Philippe Leboulch6,7, Jean-Antoine Ribeil1–4,8, Jean-Benoit Arlet1–4, Francine Coté1–4, Geneviève Courtois1–4, Yelena Z Ginzburg9, Thomas O Daniel10, Rajesh Chopra10, Victoria Sung11, Olivier Hermine1–4,12 & Ivan C Moura1–5 The pathophysiology of ineffective erythropoiesis in b-thalassemia is poorly understood. We report that RAP-011, an activin receptor IIA (ActRIIA) ligand trap, improved ineffective erythropoiesis, corrected anemia and limited iron overload in a mouse model of b-thalassemia intermedia. Expression of growth differentiation factor 11 (GDF11), an ActRIIA ligand, was increased in splenic erythroblasts from thalassemic mice and in erythroblasts and sera from subjects with b-thalassemia. Inactivation of GDF11 decreased oxidative stress and the amount of a-globin membrane precipitates, resulting in increased terminal erythroid differentiation. Abnormal GDF11 expression was dependent on reactive oxygen species, suggesting the existence of an autocrine amplification loop in b-thalassemia. GDF11 inactivation also corrected the abnormal ratio of immature/mature erythroblasts by inducing apoptosis of immature erythroblasts through the Fas–Fas ligand pathway. Taken together, these observations suggest that ActRIIA ligand traps may have therapeutic relevance in b-thalassemia by suppressing the deleterious effects of GDF11, a cytokine which blocks terminal erythroid maturation through an autocrine amplification loop involving oxidative stress and a-globin precipitation. β-thalassemia is a common inherited hemoglobinopathy that is characterized by impaired or absent β-globin chain production and the subsequent accumulation of unpaired α-globin subunits1. The unbound free α-globin chains precipitate in erythroid precursors and these precipitates are associated with the production of reactive oxygen species (ROS), which induce the death of erythroid precursors at the polychromatophilic stage2–4. The presence of α-globin precipitates also leads to a shortened lifespan of circulating red blood cells (RBCs), resulting in chronic anemia and compensatory expansion of the immature erythroblast pool in both bone marrow and extramedullary sites (particularly in the spleen and liver) 5. These expanded early precursors are susceptible to apoptosis at the polychromatophilic stage, resulting in a suboptimal production of RBCs (ineffective erythropoiesis), a hallmark of β-thalassemia6. The molecular mechanisms involved in this process are not fully understood. Members of the transforming growth factor-β (TGF-β) superfamily have been proposed to participate in the proliferation and differentiation of erythroid progenitors. TGF-β limits RBC production by accelerating erythroid differentiation and inhibiting erythroid progenitor expansion7. Bone morphogenetic protein-4 (BMP4), one of the best-studied TGF-β superfamily members in hematopoietic ifferentiation both in vitro8 and in vivo9, is involved in the regulad tion of stress responses in the spleen of adult mice10. Another TGF-β superfamily member, GDF15, is found at increased levels in blood samples from subjects with β-thalassemia, congenital dyserythropoiesis and some acquired sideroblastic anemias and is associated with ineffective erythropoiesis in β-thalassemia11. Effects of activin on erythropoiesis have been noted, but its role is somewhat controversial12–15. Although activin induces the differentiation of K562 chronic myeloid leukemia cells and primary erythroid progenitors in vitro16, its effects appear to be indirect and are less well-defined in vivo. Sotatercept (ACE-011) is a ligand trap that consists of the extracellular domain of ActRIIA linked to the human IgG1 Fc domain. Sotatercept was originally developed to treat bone-loss disorders, but clinical studies revealed unexpected effects of the drug, including increased hematocrit and hemoglobin levels17. The molecular basis of the erythropoietic effects of sotatercept is unclear. We found that treatment with a mouse version of sotatercept (RAP-011) reverses ineffective erythropoiesis in thalassemic mice and that the erythropoietic effects of this ligand trap are due to inactivation of the ActRIIA ligand GDF11. We also showed that this cytokine blocks terminal erythroid maturation through an autocrine amplification loop involving 1INSERM UMR 1163, Laboratory of Cellular and Molecular Mechanisms of Hematological Disorders and Therapeutic Implications, Paris, France. 2Paris Descartes– Sorbonne Paris Cité University, Imagine Institute, Paris, France. 3CNRS ERL 8254, Paris, France. 4Laboratory of Excellence GR-Ex, Paris, France. 5INSERM U1149, Center for Research on Inflammation, Paris, France. 6Commissariat à l’Energie Atomique (CEA)–Institut des Maladies Emergentes et des Thérapies Innovantes (iMETI), Fontenay-aux-Roses, France. 7UMR 962 (Inserm-CEA-University of Paris-Sud), Fontenay-aux-Roses, France. 8Département de Biothérapie, Hôpital Necker–Enfants Malades, Paris, France. 9Erythropoiesis Laboratory, Lindsley F. Kimball Research Institute, New York Blood Center, New York, New York, USA. 10Celgene, Summit, New Jersey, USA. 11Celgene, San Francisco, California, USA. 12Service d’Hématologie Clinique, Assistance Publique–Hôpitaux de Paris, Hôpital Necker, Paris, France. 13These authors contributed equally to this work. Correspondence should be addressed to I.C.M. ([email protected]) or O.H. ([email protected]). Received 12 July 2013; accepted 10 January 2014; published online 23 March 2014; doi:10.1038/nm.3468 nature medicine advance online publication Articles 50 * 3 8 ** ** 4 30 20 5 10 30 60 Time (d) * MCH (pg) 40 20 0 5 10 30 Time (d) 0 5 10 30 60 6 1.5 1.0 0.5 0 WT 20 40 ** * * * 10 5 10 30 60 Time (d) 50 15 0 g 0 Time (d) 5 10 30 60 0 * 30 20 30 60 * 20 15 10 WT 0 5 10 30 60 0 WT 0 Time (d) 5 10 30 60 Time (d) i j Hbbth1/th1 + PBS 10 Time (d) 5 Time (d) Wild type 5 25 0 WT WT h 10 0 WT 8 25 5 0 10 60 * 2.0 0 WT f 60 * 2 MCHC (g/dl) 0 * 4 0 WT * 12 10 0 2.5 14 Hb (g/dl) Hematocrit (%) 6 6 d 16 40 2 e c Wild type th1/th1 Hbb PBS th1/th1 Hbb RAP-011 3 b 6 10 RBCs (1 × 10 /mm ) ** * RAP-011 corrects pathological features of b-thalassemia In a time-course analysis, RAP-011–treated thalassemic mice had decreased spleen weight and cellularity and a decreased proportion of erythroid Ter-119+ cells in spleen and bone marrow, compared to PBS-treated thalassemic mice (Fig. 2a–e). These data demonstrate that RAP-011 decreases splenomegaly and corrects bone marrow expansion in thalassemic mice. Ineffective erythropoiesis in β-thalassemia is characterized by anemia with expansion of immature erythroblasts, resulting in RDW (%) a (MCH) and MCH concentration and concurrent normalization of RBC distribution width (Fig. 1e–h). RAP-011 treatment in wild-type C57BL/6 mice did not induce polycythemia, although we observed an increase in reticulocyte numbers (Supplementary Fig. 1a–h). RAP-011 treatment of thalassemic mice also improved peripheral blood RBC morphology (Fig. 1i). In addition, serum erythropoietin concentration increased rapidly following the start of RAP-011 treatment and this increase was sustained during treatment (Fig. 1j). These results show that treatment with RAP-011 in thalassemic mice improves hemoglobin content and RBC count, ameliorating anemia. Reticulocytes (1 × 10 /mm ) RESULTS ActRIIA ligand trap improves anemia in b-thalassemic mice To study the role of the ActRIIA ligand trap in ineffective erythropoiesis of thalassemia, we used a preclinical model of β-thalassemia intermedia, the Hbbth1/th1 mouse18. Hbbth1/th1 (thalassemic) mice exhibit several features of the disease, including ineffective erythropoiesis, chronic anemia, splenomegaly, aberrant RBC morphology and progressive iron overload. To avoid a xenoresponse against the human IgG1 Fc domain, we used a mouse version of sotatercept, RAP-011, in which the IgG Fc domain is of mouse origin. Treatment of thalassemic mice with RAP-011 for 60 d resulted in a higher RBC count (Fig. 1a), hematocrit (Fig. 1b) and total hemoglobin concentration (Fig. 1c), as well as decreased reticulocytosis (Fig. 1d), compared to PBS-treated mice. Time-course analysis of circulating RBC parameters in RAP-011–treated thalassemic mice revealed an increase in mean corpuscular volume, mean corpuscular hemoglobin MCV (fl) Wild type th1/th1 Hbb PBS th1/th1 Hbb RAP-011 Hbbth1/th1 + RAP-011 50 ** *** *** 5 10 Time (d) 30 40 EPO (ng/ml) © 2014 Nature America, Inc. All rights reserved. oxidative stress and α-globin precipitation and promotes the accumulation of immature erythroblasts by inhibiting the Fas–Fas ligand (FasL) pathway. 25 µm 25 µm 25 µm 30 20 10 0 WT Figure 1 RAP-011 treatment improves hematological parameters in thalassemic mice. (a–h) Red blood cell counts (a), hematocrit (b), hemoglobin (Hb) levels (c), reticulocyte counts (d), mean corpuscular volume (MCV) (e), MCH levels (f), MCH concentration (MCHC) (g) and red cell distribution width (RDW) (h) in wild-type (WT) and thalassemic mice treated for 0, 5, 10, 30 or 60 d with RAP-011 (10 mg per kg body weight twice weekly subcutaneously) or with PBS. (i) Morphology of RBCs in peripheral blood smears following 30 d of RAP-011 or PBS treatment. (j) Erythropoietin (EPO) levels measured by ELISA from serum of thalassemic mice treated for 5, 10 or 30 d with RAP-011 or PBS. All data are expressed as the mean ± s.e.m. *P < 0.05, **P < 0.01, ***P < 0.005; n = 5 mice per group for one out of three independent experiments. advance online publication nature medicine articles WT 5 10 30 Time (d) 200 0 60 WT 5 10 30 Time (d) e 0 10 2 10 3 10 4 10 4 10 3 5 Ter-119 Spleen Hbb 10 4 10 3 10 2 3 10 Ter-119 4 10 10 4 10 3 2 0 10 % cells per spleen 10 4 10 3 10 2 2 10 5 3 30.1% 40 20 20 10 0 30 10 5 10 4 10 3 10 2 10 44.7% FSC-A 10 3 5 10 10 4 0 30 WT 5 10 40 20 0 30 48.3% 2 Ter-119 7.43% FSC-A * WT 5 10 20 WT 5 10 0 30 30 Wild-type PBS th1/th1 Hbb PBS th1/th1 Hbb RAP-011 40 th1/th1 RAP-011 WT 5 10 * ** 30 0 0.5 1.0 1.5 2.0 2.5 Ery.B/Ery.C 41.7% 3 10 0 5 30 Spleen maturation index 104 10 10 10 100 80 60 40 20 0 60 Hbb RAP-011 10 WT 5 ** Ery.C: orthochromatic and reticulocytes WT 5 10 30 Hbbth1/th1 PBS FSC-A 5 Hbbth1/th1 RAP-011 0 Wild-type PBS 45.7% 7.16% Hbbth1/th1 PBS 5,000 80 60 103 10 2 10 * Wild-type PBS 10,000 4 10 0 Ter-119 59.3% 0 10 5 h 2 ProE 1.42% 0 WT PBS Ter-119 23.9% 42.9% 60 40 20 4 10 60 0 NS *** ** 15,000 Ery.B: late basophilic and polychromatic Ery.A: basophilic 40 Ter-119 65.8% 0 10 Hbbth1/th1 RAP-011 60 60 105 Bone marrow Hbb 5 30 ProE 1.64% th1/th1 10 0 Ter-119 59.7 2 5 0 RAP-011 ProE 0.251% 0 10 29% 10 FSC-A CD71 10 5 th1/th1 26.2% 43.4% 10 0 10 10 CD71 5 2 Ter-119 62% * th1/th1 10 10 30 Time (d) ProE: proerythroblast CD71 10 2 WT 5 Bone marrow Hbb CD71 3 0 CD71 10 5 PBS ProE 0.784% 0 5 4 3 2 1 0 Time (d) WT 5 10 0 50 K 10 0K 15 0K 20 0K 25 0K 4 ** 15 0 50 K 10 0K 15 0K 20 0K 25 0K 10 th1/th1 ** 20 500 µm * 10 % cells per femur 0 CD71 10 Ter-119+ (1 × 10⁶ cells per femur) Ter-119+ (1 × 10⁶ cells per spleen) CD71 200 Spleen Hbb 5 ** 400 0 CD71 © 2014 Nature America, Inc. All rights reserved. g ** 20 * 5 4 3 2 1 0 Time (d) WT 5 Hbbth1/th1 PBS Hbbth1/th1 RAP-011 600 Hbbth1/th1 PBS 60 f Wild-type PBS Wild-type PBS RAP-011 Bone marrow maturation index WT 5 10 30 i Direct bilirubin (µmol/l) 0 400 30 Hbb 40 1.5 1.0 j 0 5 10 Ery.B/Ery.C 15 WT 0 5 10 30 60 Time (d) 8 6 ** 4 2 0 0 ** * ** * 0.5 Total bilirubin (µmol/l) 0.1 600 * Cell number (per field) 0.2 ** Time (d) 0.4 0.3 800 500 µm th1/th1 Time (d) ** 500 µm Hbbth1/th1 PBS 0 50 K 10 0K 15 0K 20 0K 25 0K ** d Wild-type PBS 0 50 K 10 0K 15 0K 20 0K 25 0K 0.5 c Cell number per femur (1 × 10⁶) b Spleen cell number (1 × 10⁶) Spleen weight (g) a WT 0 ** ** ** 5 10 30 60 Time (d) Figure 2 RAP-011 treatment reduces ineffective erythropoiesis in thalassemic mice. (a–c) Spleen weight (a), total spleen cell number (b) and bone marrow cellularity (c) of thalassemic mice treated for 5, 10, 30 or 60 d with RAP-011 or PBS. (d) Bone marrow erythroblast number and distribution observed in H&E-stained cross-sections of bones of RAP-011–treated or PBS-treated thalassemic mice (60 d of treatment). (e) Bone marrow and spleen erythroblast number in RAP-011– or PBS-treated mice (30 d of treatment). (f) Erythroblast differentiation in bone marrow and spleen harvested 5–30 d after treatment with RAP-011 and evaluated by CD71 and Ter-119 staining and forward scatter (FSC) distribution. The percentage of different erythroblast populations is shown. Box-and-whisker plots show means and maximal and minimal values. (g) Representative flow cytometry analysis of spleen and bone marrow erythroblast subset distribution in RAP-011– and PBS-treated thalassemic mice (30 d of treatment). FSC-A, forward scatter area. (h) An index of ineffective erythropoiesis established by calculating the ratio of Ery.B and Ery.C percentage populations. Box-and-whisker plots show means and maximal and minimal values. (i,j). Biochemical analysis of parameters of ineffective erythropoiesis in sera of thalassemic mice treated for up to 60 d with RAP-011 or PBS: direct bilirubin (i) and total bilirubin (j). All data are expressed as the mean ± s.e.m. *P < 0.05, **P < 0.01, ***P < 0.005; n = 5 mice per group for one out of three independent experiments. an imbalanced ratio of immature/mature erythroblasts 19. Flow cytometry analyses20 of spleens from RAP-011–treated thalassemic mice revealed a decrease in both the percentage and the absolute number of Ter-119 +CD71+FSC low cells (late basophilic and polychromatic erythroblasts, Ery.B cells) and a concomitant increase in the percentage and the absolute number of Ter-119+CD71−FSClow cells (orthochromatic erythroblasts and reticulocytes, Ery.C cells) compared to in PBS-treated mice (Fig. 2f,g and Supplementary Fig. 1m). Thus, RAP-011–treated thalassemic mice showed a decreased ratio of immature/mature splenic erythroblasts (Fig. 2h and Supplementary Fig. 1o), indicating correction of erythroblast maturation arrest21. nature medicine advance online publication Although we observed a decrease in the absolute number and percentage of Ter-119 + erythroblasts in the bone marrow of RAP-011–treated thalassemic mice, the absolute number and percentage of Ery.C cells and the immature/mature erythroblast ratio were unchanged (Fig. 2f–h and Supplementary Fig. 1n,o). These data suggest that correction of ineffective erythropoiesis by RAP-011 depends on the effect of the drug on the spleen. In healthy mice, treatment with RAP-011 did not affect bone marrow cellularity, although we did observe an increase in the absolute number of Ter-119+ spleen cells (Supplementary Fig. 1i–l), suggesting that RAP-011 can promote splenic erythropoiesis in wild-type mice. Consistent with this concept, we observed an increase in reticulocyte Articles 0 5 10 Time (d) 30 60 20 0 0 WT 0 5 10 30 Time (d) 60 WT 0 5 10 30 Time (d) ** 2 NS 1 ** 1.5 0 * ** 1.0 0.5 0 60 R WT 40 3 1 0 1 ** S 10 2 ** -0 1 20 3 60 Total hemoglobin Soluble hemoglobin PB 30 c 4 e AP b Wild type Hbbth1/th1 PBS Hbbth1/th1 RAP-011 Hemoglobin (mg/ml) * Hamp mRNA expression (normalized by RPS3) * 40 Tf saturation (%) 50 Transferrin (g/l) Iron (µmol/l) a d Hbbth1/th1 RAP-011 Hbbth1/th1 PBS Hbbth1/th1 PBS Figure 3 RAP-011 treatment decreases Hbbth1/th1 RAP-011 th1/th1 iron overload and RBC-associated 150 Hbb PBS 1.0 th1/th1 * hemoglobin precipitates in thalassemic Hbb RAP-011 20,000 mice. (a–c) Biochemical analysis of serum 0.8 * 100 15,000 iron parameters in wild-type and thalassemic 0.6 mice. Systemic iron levels (a), transferrin 10,000 0 50 2 3 4 5 0.4 0 10 10 10 10 levels (b) and transferrin (Tf) saturation (c) 5,000 DCFH in mice treated for 0, 5, 10, 30 or 60 d 0.2 0 0 fluorescence Spleen with RAP-011 or PBS. n = 5 mice per group. Unstained PBS RAP-011 0 (d) Hepcidin (Hamp) mRNA levels measured by quantitative PCR (qPCR) from liver samples of wild-type or thalassemic mice Hbbth1/th1 Hbbth1/th1 1.5 treated with PBS or RAP-011. NS, not RAP-011 PBS Hb WT 15 ** significant. n = 5 mice per group. (e–i) Effects * of RAP-011 on globin chain expression and 1.0 10 membrane α-globin precipitation. Total β-globin hemoglobin (e) and soluble hemoglobin (f) α-globin 0.5 levels in primary thalassemic erythroblasts 5 treated for 48 h with 10 µg/ml RAP-011 or PBS, as assayed by Drabkin’s method. 0 0 n = 3 mice per group. (g) Left, ROS generation evaluated by flow cytometry using dichlorodihydrofluorescein (DCFH) in primary erythroblasts treated with RAP-011 or PBS for 48 h. Right, a representative FACS histogram for DCFH fluorescence. Gray line indicates unstained control cells, and black and red lines represent PBS- and RAP-011–treated erythroblasts, respectively. n = 6 mice per group. (h) Determination of total and soluble hemoglobin by Drabkin’s method in blood hemolysates from thalassemic mice treated with PBS or RAP-011 for 30 d (4 out of 5 animals for each group). (i) Left, triton–acetic acid–urea (TAU) gel electrophoresis of blood collected from wild-type and thalassemic mice treated with PBS (4 out of 5 animals) or RAP-011 (3 out of 5 animals) for 30 d, as indicated. Arrows indicate α-globin and β-globin staining from RBC membranes. Right, quantification of the optical density (OD) of the gel bands, expressed as the α-globin to β-globin ratio to hemoglobin (total lysate). (j) Expression of Hbb-a1 adult globin mRNA evaluated by qPCR, in purified immature (CD71+) erythroblasts from wild-type and thalassemic mice treated with PBS or RAP-011 for 30 d (4 out of 5 animals for each group). All data are expressed as the mean ± s.e.m. *P < 0.05 and **P < 0.01 for one out of three independent experiments. g S Soluble Hb/total Hb -0 AP j numbers upon treatment of wild-type mice (Supplementary Fig. 1c,d). In addition, RAP-011–treated wild-type mice exhibited an increase in splenic erythroid precursor populations (Ery.A, Ter-119+CD71+FSChigh and Ery.B cells), but showed no changes in the numbers of Ery.C cells or in bone marrow erythroid precursor populations (Supplementary Fig. 1p). Collectively, these findings suggest that RAP-011 has different effects on splenic erythropoiesis in healthy and diseased mice. The serum levels of total and direct bilirubin and serum lactate dehydrogenase were decreased in RAP-011–treated thalassemic mice compared to those in PBS-treated mice (Fig. 2i,j and Supplementary Fig. 2a), confirming that ineffective erythropoiesis is mitigated by RAP-011 administration. In wild-type mice, in which there is presumably no ineffective erythropoiesis, RAP-011 treatment did not alter bilirubin or lactate dehydrogenase levels (Supplementary Fig. 2b–d). Taken together, these results confirm that an ActRIIA ligand trap can correct ineffective erythropoiesis in the spleen of thalassemic mice. RAP-011 decreases the iron overload of b-thalassemia In addition to anemia, ineffective erythropoiesis in subjects with β-thalassemia results in systemic iron overload, increased gastro intestinal iron absorption and decreased circulating levels of the Hbb-a1 mRNA expression of immature erythroblasts (normalized by β-actin) i α-globin/β-globin ratio (OD) R PB 11 % hemoglobin © 2014 Nature America, Inc. All rights reserved. h DCFH fluorescence (median) f hypoferremia-related hormone hepcidin22. Although RAP-011 did not modulate iron homeostasis in wild-type mice (Supplementary Fig. 2e–g), it reduced serum iron and transferrin saturation in thalassemic mice (Fig. 3a–c). Hepatic hepcidin mRNA levels were higher in RAP-011–treated mice compared to those in PBS-treated controls (Fig. 3d). Because GDF15 secreted by erythroblasts is a potential regulator of hepcidin expression in β-thalassemia23, we analyzed GDF15 expression in mouse bone marrow and spleen samples. However, GDF15 expression did not differ between RAP-011- and PBS-treated thalassemic mice (Supplementary Fig. 2h,i). Moreover, we confirmed previous observations that GDF15 does not bind ActRIIA24 by showing that GDF15 activity was not inhibited by RAP-011 in Smad2/3 functional reporter assays using the CAGA box from the human PAI-1 promoter (Supplementary Fig. 2j). These results argue that the ActRIIA trap reverses ineffective erythropoiesis, derepresses hepcidin expression and decreases iron overload independently of GDF15. RAP-011 decreases cytotoxic membrane a-globin precipitates To gain insight into the cellular mechanisms underlying the effects of RAP-011 treatment, we cultured proerythroblasts (ProE) from thalassemic mice in the presence of RAP-011 or PBS. As expected from our in vivo observations, RAP-011 treatment increased total advance online publication nature medicine articles © 2014 Nature America, Inc. All rights reserved. hemoglobin and soluble hemoglobin levels in cultured thalassemic erythroblasts compared to untreated thalassemic cells (Fig. 3e,f). α-globin precipitation and the increased ROS levels associated with these precipitates are associated with ineffective erythropoiesis and reduced RBC survival in β-thalassemia. RAP-011 treatment lowered ROS levels in cultured thalassemic erythroblasts in vitro (Fig. 3g) and the level of RBC membrane–associated α-globin precipitates in thalassemic mice in vivo (Fig. 3h,i). Globin gene expression analysis in purified immature erythroblasts from RAP-011–treated thalassemic mice revealed a decrease in adult α-globin (Hbb-a1) and an increase in εy globin (Hbb-y) expression compared to that in controls (Fig. 3j and Supplementary Fig. 2m). No difference in adult β minor chain (Hbb-b2) (Supplementary Fig. 2k) or embryonic β-like globin (Hbb-bh1) expression (Supplementary Fig. 2l) was apparent. Thus, thalassemic mice treated with the ActRIIA ligand trap exhibit decreased α-globin gene expression, which could contribute to the correction of α-globin precipitation in circulating RBCs. Aberrant GDF11 expression in b-thalassemia In a retrospective analysis of a published gene expression data set (GSE34125), we found that Gdf11 is the only upregulated member of the TGF-β superfamily in erythroblasts from fetal liver (at embryonic day 14.5 (E14.5)) of mice with β-thalassemia major (Hbbth3/th3) compared to cells from wild-type control mice (this increase was observed in two of three samples of thalassemic erythroblasts, Supplementary Fig. 3a). In addition, we found that Tgfb1 expression is decreased in Hbbth3/th3 erythroblasts (Supplementary Fig. 3a). We also noted upregulation of Acvr2a gene expression, but not of other TGF-β family type I or type II receptor genes, in Hbbth3/th3 erythroblasts (Supplementary Fig. 3b). We confirmed increased expression of Acvr2a and revealed upregulation of Acvr2b expression in Ter-119+ splenic (but not bone marrow) erythroblasts from thalassemic mice compared to cells from wild-type control mice (Supplementary Fig. 3c,d). Further analysis demonstrated that Acvr1b and Tgfbr1 expression was higher in splenic and bone marrow erythroblasts from thalassemic mice relative to those from wild-type mice (Supplementary Fig. 3e,f). Expression of Acvr1b, Acvr2a and Acvr2b was similar between cultured spleen- and bone marrow–derived erythroblasts (Supplementary Fig. 3g–i). In agreement with our observations using freshly isolated cells, Acvr2a mRNA expression was higher in cultured erythroblasts from thalassemic mice compared to those from wild-type mice (Supplementary Fig. 3g,h). Thus, the in vitro erythroblast culture results are in contrast to in vivo observations, suggesting that environmental conditions may modulate TGF-β family receptor expression, leading to changes in bone marrow and spleen erythroblasts in vivo. Because activin A, activin B, GDF-8, GDF-11 and BMP-10 have been previously shown to bind ActRIIA24, we explored potential differences in their expression in TER-119+ erythroblasts from thalassemic and wild-type mice. Activin A and activin B are homodimers encoded by Inhba and Inhbb, respectively24. Inhba expression was higher in Ter-119+ bone marrow cells, but not in Ter-119+ spleen cells, from thalassemic mice compared to those from wild-type controls (Supplementary Fig. 4a), whereas Inhbb expression was minimally detectable (Supplementary Fig. 4b). These data suggest that ActRIIA ligands activin A and activin B do not participate in the effects of RAP-011 in the spleen of thalassemic mice. In addition, expression of Mstn (the gene encoding GDF8) and Bmp10 was undetectable in Ter-119+ bone marrow– and spleen-derived cells (data not shown). nature medicine advance online publication Gdf11 expression was strongly upregulated in Ter-119+ spleen (but not bone marrow) cells from thalassemic compared to wild-type mice (Fig. 4a), whereas Gdf15 expression was upregulated in Ter-119+ bone marrow (but not spleen) cells from thalassemic mice (Supplementary Fig. 4c), confirming previous gene expression data set results. Comparison of Acvr2a, Inhba, Inhbb and Gdf11 transcript levels in bone-marrow derived thalassemic erythroblasts cultured in the presence or absence of the RAP-011 showed that the ligand trap results in reduced expression of ActRIIA ligands (Supplementary Fig. 4d). This finding suggests that the expression of ActRIIA ligands can be modulated by receptor engagement, as previously suggested in a Xenopus model25,26. Thus, Gdf11, a TGF-β superfamily member whose expression is upregulated in splenic erythroblasts of thalassemic mice, is a candidate ligand for mediating the spleen-specific effects of the ActRIIA ligand trap in thalassemic mice. GDF11 overexpression in thalassemic erythroblasts We found higher GDF11 expression in spleens from thalassemic mice compared to those from wild-type control mice using immunohistochemistry (Fig. 4b), confirming the gene expression data. In contrast, expression of activin A and B, which were both readily detected in spleens from control mice, was minimally affected in thalassemic as compared to control mice (Fig. 4b). Treatment of thalassemic mice with RAP-011 decreased the expression of GDF11 and, to a much lesser extent, activin A and activin B (Fig. 4b), indicating that RAP-011 can reverse GDF11 overexpression in this mouse model. RAP-011 treatment also decreased GDF11 concentration in bone marrow in vivo, as determined by immunoblotting analyses (Supplementary Fig. 4e). There was little difference in ActRIIA ligand expression between thalassemic and wild-type bone marrow cells (Supplementary Fig. 4f), in contrast to the differences we observed in ActRIIA ligand expression in spleen cells. These data demonstrate that GDF11 concentration is increased in thalassemic spleen cells and that RAP-011 treatment reverses GDF11 overexpression. GDF11 expression was not upregulated in mice under hypoxic or hemolytic anemia conditions27 (Fig. 4c,d), indicating that GDF11 may be associated more with the ineffective erythropoiesis of β-thalassemia than with stress erythropoiesis. In thalassemic mice, GDF11 was overexpressed in Ter-119 + erythroblasts but not in macrophages (Fig. 4e). Only red pulp cells, and not white pulp cells, produced GDF11 (Supplementary Fig. 5a), suggesting that GDF11 is not produced by B cells, T cells or dendritic cells. Careful scrutiny of different erythroid populations showed that GDF11 overexpression is confined to relatively immature erythroid precursors (CD71+Ter-119low/− and Ter-119+CD71+ cells (Fig. 4f). In addition, GDF11 was expressed at only very low levels in bone marrow from thalassemic mice, as compared to the high levels observed in the spleen (Fig. 4g). Flow cytometric analysis from primary erythroblast cultures confirmed that GDF11, but not activin A or activin B, is overexpressed in thalassemic spleen–derived erythro blasts and that RAP-011 treatment of the cells considerably reduced GDF11 expression (Supplementary Fig. 4g). ActRIIA ligand concentration in sera from 16 subjects with thalassemia major and 8 healthy control subjects revealed that GDF11, but not activin A or activin B, concentration is higher in subjects with thalassemia relative to healthy controls (Fig. 4h). Similarly, GDF11 concentration was higher in sera of thalassemic mice compared to control mice (Fig. 4i). Confocal microscopy analyses confirmed that cultured erythroblasts positive for the erythroblast developmental marker glycophorin A (GPA) from subjects with β-thalassemia major Articles a *** 0.002 th1/th1 NS 200 µm 200 µm 200 µm 200 µm 200 µm 200 µm 200 µm 200 µm 200 µm Activin B mRNA expression (normalized by GAPDH) 2 1 0 Gdf11 Hypoxia aRBC Inhba 200 µm 200 µm 200 µm 200 µm 200 µm 200 µm 200 µm 200 µm Inhbb f Hbbth1/th1 Wild type 200 µm GDF11 Bone marrow Normoxia Hypoxia aRBC NS Normoxia Activin B 0 3 RAP-011 Activin A Hbb 0.004 Spleen Hbb GDF11 0.006 PBS th1/th1 Wild type Hbb Wild type g th1/th1 th1/th1 th1/th1 Spleen Hbb Bone marrow Hbb spleen Spleen 50 µm GDF11 F4/80 Ter-119 50 µm 50 µm GDF11 F4/80 Ter-119 50 µm GDF11 CD71 Ter-119 GDF11 CD71 Ter-119 GDF11 DAPI GDF11 DAPI Figure 4 GDF11 is overexpressed in Coating RAP-011 Coating ACE-011 Coating RAP-011 Coating ACE-011 β-thalassemia and is associated with Detection anti-GDF11 Detection anti–activin B Detection anti-GDF11 Detection anti–activin A ineffective erythropoiesis. (a) Gdf11 1.0 1.5 0.15 ** 1.0 *** 0.8 mRNA levels evaluated by qPCR in spleen 0.8 1.0 0.10 0.6 and bone marrow erythroblasts from wild0.6 0.4 0.4 type and thalassemic mice (n = 4 for each). 0.5 0.05 0.2 0.2 AU, arbitrary units. (b) Representative 0 0 activin A, activin B and GDF11 0 0 Wild type Hbbth1/th1 immunohistochemical staining of spleen sections from wild-type and thalassemic mice treated with PBS or RAP-011 for 30 d. (c) Representative activin A, activin B and GDF11 immunohistochemical staining of spleen sections from wild-type C57BL/6 mice under conditions of normoxia, hypoxia and hemolytic anemia (aRBC). (d) Gdf11, activin A (Inhba) and activin B (Inhbb) mRNA levels evaluated by qPCR from the spleen of wild-type C57BL/6 mice under conditions of normoxia, hypoxia and hemolytic anemia (n = 4 for each). (e,f) Confocal micrographs showing splenic sections from wild-type and thalassemic mice. GDF11 protein expression is shown in green, Ter-119 + erythroblasts in blue and F4/80+ (e) and CD71+ (f) cells in red. (g) Confocal micrographs showing sections from spleen and bone marrow of thalassemic mice. GDF11 protein expression is shown in green and nuclei (DAPI) in blue. Scale bars, 50 µm. (h) Detection of ActRIIA Fc–bound ligands in sera from healthy individuals (n = 8) and subjects with thalassemia (n = 16). (i) Detection of ActRIIa Fc–bound ligand GDF11 in sera from wild-type (n = 6) mice and thalassemic mice (n = 5). All data are expressed as the mean ± s.e.m. *P < 0.05, **P < 0.01 and ***P < 0.001 for one out of three independent experiments. h OD 450 nm ia l m se on Th al C m se as al Th tro ia l tro on C m se as al GDF11 contributes to immature erythroblast pool expansion Ineffective erythropoiesis in β-thalassemia is characterized by massive proliferation of immature erythroblasts unable to bypass the apoptotic crisis at the polychromatophilic stage2–4. Because RAP-011 treatment reverses splenomegaly, which is a classic characteristic of ineffective erythropoiesis, we investigated the impact of RAP-011 on apoptosis. As expected, thalassemic mice exhibited an increased number TUNEL+ cells relative to wild-type mice (Fig. 5a), consistent with apoptosis of maturing thalassemic mouse erythroblasts. as OD 450 nm ia l tro on C Th have increased GDF11 expression compared to erythroblasts from healthy control subjects (in whom GDF11 is undetectable in GPA+ cells and only minimally expressed in GPA− cells) (Supplementary Fig. 5b). Taken together, these results suggest that GDF11 overexpression in immature erythroblasts is characteristic of ineffective erythropoiesis in both mice and humans with β-thalassemia. OD 450 nm i OD 450 nm © 2014 Nature America, Inc. All rights reserved. Hbb Wild type 0.008 d e c th1/th1 Activin A Gdf11 mRNA levels normalized by GAPDH (AU) b RAP-011 treatment of thalassemic mice led to a further increase in the number of TUNEL+ spleen cells (Fig. 5a). RAP-011 administration also induced FasL expression in ProE and Ery.B cells in spleen (but not bone marrow) from thalassemic mice compared to PBS-treated mice (Fig. 5b). In RAP-011–treated mice, Fas expression was upregulated in ProE and early basophilic erythroblasts (Ery.A cells) from spleen but not bone marrow (Fig. 5b). RAP-011 also induced Fas and FasL expression in nonerythroid (Ter-119−CD71−) spleen (but not bone marrow) cells (Supplementary Fig. 5c,d), supporting the premise that RAP-011 also affects stromal cells, as recently proposed28. Next, we found that anti-GDF11 antibodies, but not anti–activin A or anti–activin B antibodies, induced FasL expression in primary thalassemic erythroblasts (Ery.A and Ery.B cells) (Fig. 5c). As expected, the induction of FasL expression by anti-GDF11 antibodies was associated with an increased incidence of apoptosis in relatively immature thalassemic erythroblasts (Ery.A and Ery.B) (Fig. 5d). advance online publication nature medicine articles a Hbbth1/th1 PBS Hbbth1/th1 RAP-011 TUNEL CD71 Ter-119 Wild type 50 µm ** Ery.A Ery.B Ery.C Ery.A Ery.B 15 * Ery.B Ery.C 20 10 5 0 100 40 20 0 40 20 H GDF11 inhibits terminal erythropoiesis in b-thalassemia We next investigated the molecular pathways downstream of ActRIIA that could lead to the ineffective erythropoiesis associated with β-thalassemia. Immunohistochemical analysis demonstrated that the levels of phosphorylated Smad2 and, to a lesser degree, phosphorylated Smad1 and/or Smad5 (Smad1/5) were higher in spleen sections from thalassemic mice in comparison to those from wild-type mice (Fig. 6a), suggesting that GDF11 overexpression in the spleen of thalassemic mice results in Smad2 pathway activation. Moreover, spleen cells in RAP-011–treated thalassemic mice showed decreased activation of the Smad2 pathway, whereas it did not affect Smad1/5 phosphorylation. (Fig. 6a), suggesting that the effects of RAP-011 are mediated by the Smad2 pathway. As expected, Smad2 and/or Smad3 (Smad2/3) activation was restricted to Ter-119+ erythroblasts in the nature medicine advance online publication Ab F1 1 tB D G th 1 th 1/ th bb 1/ th Knockdown of GDF11 expression by siRNA also resulted in apoptosis of cultured erythroblasts (Supplementary Fig. 5e). These results demonstrate that GDF11 overexpression is a previously undescribed mechanism regulating Fas-FasL pathway expression in immature erythroblasts that may contribute to erythroid expansion in β-thalassemia. Ab 1 1/ th bb H F1 D G th 1 1/ th bb H bb Ab 1 Ab Ab tB 1 th th 1/ th bb H Ac tA Ac bb H 1 th 1/ th th 1 th th 1/ Ab 1 G th 1/ th bb bb H H F1 1 D Ac Ac tB tA Ab Ab th 1/ th bb 1 th H 1/ th bb H 60 0 1 0 80 1/ 20 60 th 40 100 Ery.B 80 spleen (Fig. 6b–d). In C2C12 myoblasts, recombinant GDF11 (rGDF11) induced the activation of a CAGA box- but not a BRE Ery.C (BMP responsive element)-luciferase reporter AV+ gene (specific for Smad2/3 and Smad1/5 signAV+ 7AAD+ aling, respectively) (Supplementary Fig. 5f), consistent with the idea that GDF11 does not induce Smad1/5 pathway activation. In addition, SB431542 (an ALK5 inhibitor) and SB505124 (an ALK4 and ALK5 (ALK4/5) inhibitor) abolished GDF11-induced CAGAluciferase activity (Supplementary Fig. 5g). Finally, as expected, RAP-011 and GDF8 or GDF11 blocking antibodies inhibited rGDF8 and rGDF11 activity in functional CAGAluciferase reporter assays (Supplementary Fig. 5h)24. Taken together, these results confirm previous observations that GDF11 signals through the Smad2/3 pathway24 and show that this pathway is activated in splenic erythroblasts of thalassemic mice. To gain insight into the molecular mechanisms regulating GDF11 expression in β-thalassemia, we evaluated the relationship of GDF11 expression to ROS and cytotoxic membrane-bound α-globin aggregates29. GDF11 expression decreased and terminal erythroblast maturation increased in thalassemic erythroblasts cultured with the antioxidant pyrrolidine dithiocarbamate (Fig. 6e,f). In addition, RAP-011 treatment of primary thalassemic erythroblasts resulted in reduced ROS levels (Fig. 6g). Most notably, rGDF11, but not rGDF8 or rGDF15, increased ROS levels in primary thalassemic erythroblasts (Fig. 6h), suggesting that GDF11 contributes to the oxidative stress associated with α-globin precipitates. To further define the role of ActRIIA ligands in terminal erythroblast maturation, we cultured thalassemic ProE cells in the presence of blocking antibodies directed against activin A, activin B, GDF8 or GDF11. Antibodies to GDF11, but not to activin A, activin Ab Cell death (%) 60 5 Ac Ery.A 80 10 0 Cell death (%) 100 Ery.C 15 1 * 5 ProE 20 th 10 20 0 Ery.A 103 104 105 40 Ery.C 15 0 FasL 1/ 20 Ery.B 0 103 104 105 th Ery.A 0 Fas bb ProE 0 ** % FasL+ cells 20 ** 60 H % FasL+ cells % FasL+ cells (bone marrow) ** 40 % FasL+ cells % Fas+ cells (bone marrow) 60 0 Cell death (%) © 2014 Nature America, Inc. All rights reserved. ProE 80 0 d Spleen Ery.B population Count 0 Ery.C 80 c **** 20 H Ery.B th1/th1 Hbb PBS th1/th1 Hbb RAP-011 tA Ery.A 40 bb ProE Wild type th1/th1 Hbb PBS th1/th1 Hbb RAP-011 60 Ac 20 * H 40 0 ** ** 80 1 * 50 µm Count **** 60 % FasL+ cells (spleen) % Fas+ cells (spleen) 80 1 b 50 µm Figure 5 ActRIIA trap therapy promotes earlystage erythroblast apoptosis in thalassemic mice. (a) TUNEL staining of CD71+ erythroblasts. Confocal micrographs showing sections from wild-type and thalassemic mice (n = 3 mice for each group) treated with RAP-011 or PBS for 30 d. TUNEL+ staining is shown in green, Ter-119+ in blue and CD71+ in red. (b) Flow cytometric quantification of Fas+ and FasL+ erythroblast populations (Ery.A, Ery.B and Ery.C) from bone marrow and spleen of thalassemic mice treated with RAP-011 or with PBS for 30 d (n = 5 mice for each group). Representative FACS histograms of Fas and FasL staining in Ery.B spleen cells are also shown. (c) The percentage of Fas and FasL cells in cultured thalassemic erythroblast cells at the indicated stages of differentiation after treatment without or with neutralizing antibodies specific for GDF11 (GDF11 Ab), activin A (ActA Ab) or activin B (ActB Ab) (one out of three independent experiments, n = 3 mice for each group). (d) Quantification of apoptosis (annexin V (AV) and 7-AAD staining) in cultured erythroblasts from thalassemic mice treated with neutralizing antibodies against GDF11, activin A or activin B (one out of three independent experiments, n = 3 mice for each group). All data are expressed as the mean ± s.e.m. *P < 0.05 and **P < 0.01. Articles B or GDF8, promoted terminal erythroblast maturation (Fig. 6i and Supplementary Fig. 6a,b), supporting the hypothesis that GDF11 negatively regulates terminal erythroid maturation in β-thalassemia. e f 4,000 2,000 5,000 Ve hi cl e PD TC 0 j 200 µm 10,000 200 µm 10 Control Immature 81.4 ± 2.9% 103 0 102 0 5 50 0 F4/80 Hbbth1/th1 control isotype Immature 5 61.9% 10 4 10 4 3 10 3 10 50 µm 50 µm 10 2 10 0 th1/th1 Hbb Ter-119 Wild type 0 10 10 th1/th1 Hbb 3 10 10 0 10 4 10 4 3 10 3 CD71 p-Smad2/3 10 10 0 2 Mature 64.0% 10 3 2 0 102 103 10 4 5 10 Immature 58.9% Mature 10 0 13.5% ProE 27.9% 0 102 GDF11 Ab Immature 105 56.7% 2 50 Hbbth1/th1 activin B Ab 10 50 µm th1/th1 5 rGDF8 (ng/ml) ProE 18.0% 5 activin A Ab 10 CD71 4 0 Mature 18.6 ± 2.9% 10 5 ProE 24.5% 104 105 0 102 Mature 6.1 ± 1.7% 102 0 0 102 Ter-119 120 104 105 ProE Immature Mature 80 60 40 20 0 Ac tA tB Ab Ab 1 1/ th 1 Ac F1 D th 1 G H bb th th 1/ bb H Ab 1 th 1/ th bb H th 1 th 1/ bb 50 µm ** H 50 µm 105 100 l DAPI p-Smad2/3 120 100 80 60 40 20 0 104 Mature Immature Mature 14.9% 103 103 tro th1/th1 Cells (%) Bone marrow Hbb 105 104 % of cells th1/th1 Spleen Hbb 104 rGDF11 (100 ng/ml) Immature 93.9 ± 1.7% Ter-119 d 103 103 Mature 10 0 12.6% ProE 25.1% 50 Immature 15.5% 2 2 50 µm Hbb 5 10 5 rGDF15 (ng/ml) rGDF11 (ng/ml) CD71 Ter-119 0 i 4 5,000 Hbbth1/th1 Wild type * 10,000 105 p-Smad2/3 Spleen 40 * 5 Spleen 60 0 15,000 ROS (MFI) © 2014 Nature America, Inc. All rights reserved. c 80 * 15,000 20 Ve hi cl e PD TC R AP -0 11 h 200 µm p-Smad2/3 200 µm 200 µm b * 0 200 µm Immature Mature 100 1 200 µm g * 120 % of cells 200 µm * 6,000 p-Smad1/5 200 µm GDF11 (MFI) ActRII 8,000 F1 RAP-011 Ve hi cl e PD TC R AP -0 11 th1/th1 D Hbb on PBS rG Hbb ROS (MFI) th1/th1 Wild type C a In agreement with the observation that in vitro–cultured bone arrow–derived and spleen-derived erythroblasts showed similar m levels of activin receptor expression (Supplementary Fig. 3g,h), Figure 6 GDF11 inactivation promotes terminal erythropoiesis. (a) Immunohistochemical staining of phosphorylated Smad2/3 (p-Smad2/3), p-Smad1/5 and ActRIIA and ActRIIB in spleen samples from wild-type and thalassemic mice treated with PBS or RAP-011 for 30 d. (b,c) Confocal micrographs showing sections of spleen red pulp from wild-type and thalassemic mice. p-Smad2/3 protein expression (green), Ter-119 + erythroblasts (blue) and F4/80+ (b) and CD71+ (c) cells (red) are shown. (d) Confocal micrographs showing sections of spleen and bone marrow from thalassemic mice. p-Smad2/3 protein expression (green) and Ter-119 + erythroblasts (blue) are shown. (e–g) Erythroblast cultures, derived from cells from thalassemic mice, treated with pyrrolidine dithiocarbamate (PDTC) (5 µM), RAP-011 (10 µg/ml) or PBS as a vehicle for 48 h. (e) Flow cytometry analysis showing intracellular GDF11 levels after treatment with PDTC or RAP-011. (f) Erythroblast differentiation after treatment with PDTC. Cells were classified as immature (Ter-119+CD71+) or mature (Ter-119+CD71−) erythroblasts. (g) ROS levels in bone marrow–derived thalassemic erythroblasts after treatment with RAP-011 or PDTC. (h) ROS production after treatment of erythroblast cultures from bone marrow of thalassemic mice with rGDF11, rGDF15 or rGDF8 (5 or 50 ng/ml). ROS generation was measured by FACS using DCFH. (i) Erythroblast cultures, derived from bone marrow of thalassemic mice, treated with neutralizing antibodies against activin A, activin B or GDF11 propeptide. Flow cytometry analysis of erythroblast differentiation using CD71 and Ter-119 staining and FSC distribution is shown. Cells were classified as ProE (Ter-119 dimCD71+), immature (Ter-119+CD71+) and mature (Ter-119+CD71−) erythroblasts. (j) Erythroblast differentiation in samples treated with rGDF11 (100 ng/ml) for 48 h, as evaluated by CD71 and Ter-119 staining and FSC distribution. The percentages of immature (Ter-119 +CD71+) and mature (Ter-119+CD71−) erythroblast populations are shown. All data are expressed as the mean ± s.e.m. *P < 0.05, **P < 0.01; n = 3–5 mice per group for one out of three independent experiments. advance online publication nature medicine articles © 2014 Nature America, Inc. All rights reserved. rGDF11 induced Smad2 pathway signaling similarly in these two cell types (Supplementary Fig. 6c). Furthermore, rGDF11 induced a dose-dependent increase in Smad2/3 phosphorylation in thalassemic but not wild-type erythroblasts (Supplementary Fig. 6c,d). In agreement with this observation, rGDF11 treatment of bone marrow– and spleen-derived erythroblasts blocked terminal erythro blast maturation in thalassemic but not wild-type cells (Fig. 6j and Supplementary Fig. 7a,b), suggesting that GDF11 is sufficient to promote ineffective erythropoiesis in thalassemic cells. In addition, rGDF11 treatment had no effect on erythroblast survival or proliferation (Supplementary Fig. 7c,d). Based on these findings, we propose that ineffective erythropoiesis in β-thalassemia is a consequence of an autocrine amplification loop between oxidative stress and GDF11 expression. Chronic activation of this pathway results in terminal maturation arrest and a concomitant expansion of immature erythroblasts due to inhibition of the Fas-FasL pathway. DISCUSSION Oxidative stress promotes terminal erythroid maturation arrest in healthy erythroblasts30,31. In thalassemic erythroblasts, α-globin membrane precipitates are associated with increased oxidative stress and consequent ineffective erythropoiesis 22,32–34. However, the molecular pathways regulating oxidative stress and their specific role in ineffective erythropoiesis are poorly defined. In this study, we demonstrate that GDF11 is overexpressed in immature splenic erythroblasts along with type I (ALK4/5) and type II (ActRIIA and ActRIIB) TGF-β family receptors in β-thalassemia. The tissue-specific and activation of this pathway leads to an increased number of immature erythroblasts and increased oxidative stress, resulting in terminal erythroid maturation arrest that contributes to disease pathogenesis. ActRIIA ligand trap administration decreased GDF11 concentration, induced Fas-FasL pathway–dependent apoptosis in immature erythroblasts and reduced ROS levels and the amount of cytotoxic α-globin aggregates, thus promoting terminal erythroblast maturation. Together, these effects ameliorated ineffective erythropoiesis, resulting in reversal of splenomegaly, increased RBC counts, increased MCH and amelioration of anemia in β-thalassemic mice. Taken together, our findings show that GDF11, acting through ALK4/5–Smad2/3 signaling, modulates the Fas-FasL pathway and oxidative stress, thereby contributing to ineffective erythropoiesis in β-thalassemia. In mice, during steady-state conditions, hematopoietic progenitors derived from adult bone marrow are unresponsive to BMP4 stimulation35. However, BMP4 has a major role in the control of hypoxic stress erythropoiesis responses10,36. The data presented here demonstrate that GDF11 is overexpressed in the spleen of thalassemic mouse but not in the spleen of wild-type mice under steady-state conditions or under conditions of stress erythropoiesis induced by hypoxia or anemia, suggesting that the molecular mechanisms controlling ineffective erythropoiesis in β-thalassemia and in stress erythropoiesis are different. The Fas-FasL pathway is critical for the modulation of erythropoiesis, in both steady-state and stress conditions37,38, and mutation of FAS can result in ineffective erythropoiesis in humans 39. Our data demonstrate that, by inducting the Fas-FasL pathway and apoptosis, GDF11 blockade using an ActRIIA ligand trap results in fewer immature erythroblasts. Notably, ROS lead to activation of the Fas-FasL pathway40, suggesting that oxidative stress is linked to both terminal erythroid differentiation and apoptosis of immature erythroblasts. Our results identify TGF-β family members as negative modulators of the Fas-FasL pathway. nature medicine advance online publication Clinical studies in healthy subjects revealed that sotatercept administration rapidly increases RBC count, hemoglobin levels and hematocrit17. Consistent with this finding, sotatercept blocks the inhibitory effect of stromal cells on human erythroblasts, promoting erythroid maturation28. Therefore, ActRIIA ligand traps can promote erythropoiesis under steady-state conditions in the absence of GDF11 overexpression, suggesting that the ActRIIA ligands involved in healthy erythropoiesis28 may be different from those involved in β-thalassemia. In summary, our data support a role for activin and BMP signaling as a modulator of β-thalassemia pathophysiology. GDF11 overexpression in β-thalassemic, but not in normal, erythroblasts (in both mice and humans) provides strong evidence that this signaling promotes oxidative stress and α-globin precipitation, resulting in terminal maturation arrest. Furthermore, GDF11 expression is itself induced by oxidative stress, suggesting that an autocrine amplification loop is characteristic of ineffective erythropoiesis. In addition, GDF11-ActRIIA signaling acts to negatively modulate the Fas-FasL pathway that contributes to the accumulation of early erythroblasts. Therefore, GDF11 and activin receptor overexpression are key contributing factors to the impairment of the normal progression of terminal erythroblast maturation, resulting in expanded immature erythroblasts, suboptimal production of late erythroblasts and fewer mature circulating RBCs. In light of our RAP-011 data, we propose that sotatercept will have the combined effect of promoting terminal erythroid maturation and inducing apoptosis of immature erythroblasts. Increasing the proportion of mature to immature erythroblasts would be expected to reverse ineffective erythropoiesis and splenomegaly, derepress hepcidin expression and ameliorate anemia (Supplementary Fig. 8). Further study is needed to investigate the effects of sotatercept on erythropoietin production. Clinical studies are currently underway (NCT01571635) to determine the safety and tolerability of sotatercept administration in subjects with β-thalassemia intermedia. Methods Methods and any associated references are available in the online version of the paper. Note: Any Supplementary Information and Source Data files are available in the online version of the paper. Acknowledgments This work was supported by Agence Nationale de la Recherche (grants ANR-10JCJC-1108, ANR-12-BSV1-0039, ANR-11-LABX-0051 and ANR-10-BLAN-1109), Assistance Publique Hôpitaux de Paris–CNRS Contrats Hospitaliers de Recherche Translationnelle, Institut National du Cancer, Cancéropôle Île-de-France, Fondation pour la Recherche Médicale, Fondation de France, Association Laurette Fugain and Association pour la Recherche sur le Cancer. The Imagine Institute and the Laboratory of Excellence GR-Ex are funded by the program ‘Investissements d’avenir’ of the French National Research Agency (ANR-10-IAHU-01 and ANR-11-IDEX-0005-02, respectively). We thank S. Nelson and J. Bex for technical assistance, C. Brouzes for cytological advice, M.G. Traore and N. Goudin for assistance with confocal microscopy and O. Thibaudeau, F. Watier and N. Gadessaud for assistance in histological sample processing. 34-3C IgG2a antibody was provided by S. Izui (University Medical Center, University of Geneva). AUTHOR CONTRIBUTIONS M.D., T.T.M. and A.F. designed and performed all experiments, analyzed the data and helped write the manuscript. J.V., C.C., F.C., D.G., O.N., E. Paubelle and G.C. performed experiments and analyzed data. E. Payen, P.L. and Y.B. provided thalassemic mice, intellectual input and technical expertise for the hemoglobin analysis. J.-A.R. and J.-B.A. provided human samples. T.O.D., R.C. and V.S. participated in project planning, provided RAP-011 and ACE-011, actively contributed to the development of the project and contributed to the writing and editing of the manuscript. Y.Z.G. contributed to the writing and editing of the manuscript. O.H. and I.C.M. supervised the overall project, performed the experiments, analyzed the data and wrote the manuscript. Articles COMPETING FINANCIAL INTERESTS The authors declare competing financial interests: details are available in the online version of the paper. © 2014 Nature America, Inc. All rights reserved. Reprints and permissions information is available online at http://www.nature.com/ reprints/index.html. 1. Higgs, D.R., Engel, J.D. & Stamatoyannopoulos, G. Thalassaemia. Lancet 379, 373–383 (2012). 2. Weiss, M.J. & dos Santos, C.O. Chaperoning erythropoiesis. Blood 113, 2136–2144 (2009). 3. Kihm, A.J. et al. An abundant erythroid protein that stabilizes free α-haemoglobin. Nature 417, 758–763 (2002). 4. Ribeil, J.A. et al. Ineffective erythropoiesis in β-thalassemia. ScientificWorldJournal 2013, 1–11 (2013). 5. Sorensen, S., Rubin, E., Polster, H., Mohandas, N. & Schrier, S. The role of membrane skeletal-associated α-globin in the pathophysiology of β-thalassemia. Blood 75, 1333–1336 (1990). 6. Ginzburg, Y. & Rivella, S. β-thalassemia: a model for elucidating the dynamic regulation of ineffective erythropoiesis and iron metabolism. Blood 118, 4321–4330 (2011). 7. Zermati, Y. et al. Transforming growth factor inhibits erythropoiesis by blocking proliferation and accelerating differentiation of erythroid progenitors. Exp. Hematol. 28, 885–894 (2000). 8. Chadwick, K. et al. Cytokines and BMP-4 promote hematopoietic differentiation of human embryonic stem cells. Blood 102, 906–915 (2003). 9. Hegde, S. et al. An intronic sequence mutated in flexed-tail mice regulates splicing of Smad5. Mamm. Genome 18, 852–860 (2007). 10.Paulson, R.F., Shi, L. & Wu, D.C. Stress erythropoiesis: new signals and new stress progenitor cells. Curr. Opin. Hematol. 18, 139–145 (2011). 11.Tanno, T. et al. High levels of GDF15 in thalassemia suppress expression of the iron regulatory protein hepcidin. Nat. Med. 13, 1096–1101 (2007). 12.Broxmeyer, H.E. et al. Selective and indirect modulation of human multipotential and erythroid hematopoietic progenitor cell proliferation by recombinant human activin and inhibin. Proc. Natl. Acad. Sci. USA 85, 9052–9056 (1988). 13.Nakao, K., Kosaka, M. & Saito, S. Effects of erythroid differentiation factor (EDF) on proliferation and differentiation of human hematopoietic progenitors. Exp. Hematol. 19, 1090–1095 (1991). 14.Mizuguchi, T., Kosaka, M. & Saito, S. Activin A suppresses proliferation of interleukin-3-responsive granulocyte-macrophage colony-forming progenitors and stimulates proliferation and differentiation of interleukin-3-responsive erythroid burst-forming progenitors in the peripheral blood. Blood 81, 2891–2897 (1993). 15.Shiozaki, M., Kosaka, M. & Eto, Y. Activin A: a commitment factor in erythroid differentiation. Biochem. Biophys. Res. Commun. 242, 631–635 (1998). 16.Yu, J. et al. Importance of FSH-releasing protein and inhibin in erythrodifferentiation. Nature 330, 765–767 (1987). 17.Ruckle, J. et al. Single-dose, randomized, double-blind, placebo-controlled study of ACE-011 (ActRIIA-IgG1) in postmenopausal women. J. Bone Miner. Res. 24, 744–752 (2009). 18.Skow, L.C. et al. A mouse model for β-thalassemia. Cell 34, 1043–1052 (1983). 10 19.Ramos, P. et al. Iron metabolism and ineffective erythropoiesis in β-thalassemia mouse models. Ann. NY Acad. Sci. 1202, 24–30 (2010). 20.Liu, Y. et al. Suppression of Fas-FasL coexpression by erythropoietin mediates erythroblast expansion during the erythropoietic stress response in vivo. Blood 108, 123–133 (2006). 21.Mathias, L.A. et al. Ineffective erythropoiesis in β-thalassemia major is due to apoptosis at the polychromatophilic normoblast stage. Exp. Hematol. 28, 1343–1353 (2000). 22.Rivella, S. The role of ineffective erythropoiesis in non-transfusion-dependent thalassemia. Blood Rev. 26 (suppl. 1), S12–S15 (2012). 23.Tanno, T., Noel, P. & Miller, J.L. Growth differentiation factor 15 in erythroid health and disease. Curr. Opin. Hematol. 17, 184–190 (2010). 24.Wakefield, L.M. & Hill, C.S. Beyond TGFβ: roles of other TGFβ superfamily members in cancer. Nat. Rev. Cancer 13, 328–341 (2013). 25.Fainsod, A. et al. The dorsalizing and neural inducing gene follistatin is an antagonist of BMP-4. Mech. Dev. 63, 39–50 (1997). 26.Re’em-Kalma, Y., Lamb, T. & Frank, D. Competition between noggin and bone morphogenetic protein 4 activities may regulate dorsalization during Xenopus development. Proc. Natl. Acad. Sci. USA 92, 12141–12145 (1995). 27.Coulon, S. et al. Polymeric IgA1 controls erythroblast proliferation and accelerates erythropoiesis recovery in anemia. Nat. Med. 17, 1456–1465 (2011). 28.Iancu-Rubin, C. et al. Stromal cell-mediated inhibition of erythropoiesis can be attenuated by sotatercept (ACE-011), an activin receptor type II ligand trap. Exp. Hematol. 41, 155–166 (2013). 29.Yu, X. et al. An erythroid chaperone that facilitates folding of α-globin subunits for hemoglobin synthesis. J. Clin. Invest. 117, 1856–1865 (2007). 30.Marinkovic, D. et al. Foxo3 is required for the regulation of oxidative stress in erythropoiesis. J. Clin. Invest. 117, 2133–2144 (2007). 31.Suragani, R.N. et al. Heme-regulated eIF2α kinase activated Atf4 signaling pathway in oxidative stress and erythropoiesis. Blood 119, 5276–5284 (2012). 32.Nathan, D.G. & Gunn, R.B. Thalassemia: the consequences of unbalanced hemoglobin synthesis. Am. J. Med. 41, 815–830 (1966). 33.Schrier, S.L. Pathophysiology of thalassemia. Curr. Opin. Hematol. 9, 123–126 (2002). 34.Kong, Y. et al. Loss of α-hemoglobin-stabilizing protein impairs erythropoiesis and exacerbates β-thalassemia. J. Clin. Invest. 114, 1457–1466 (2004). 35.Utsugisawa, T. et al. A road map toward defining the role of Smad signaling in hematopoietic stem cells. Stem Cells 24, 1128–1136 (2006). 36.Perry, J.M., Harandi, O.F. & Paulson, R.F. BMP4, SCF, and hypoxia cooperatively regulate the expansion of murine stress erythroid progenitors. Blood 109, 4494–4502 (2007). 37.Socolovsky, M. Molecular insights into stress erythropoiesis. Curr. Opin. Hematol. 14, 215–224 (2007). 38.De Maria, R. et al. Negative regulation of erythropoiesis by caspase-mediated cleavage of GATA-1. Nature 401, 489–493 (1999). 39.Bader-Meunier, B. et al. Dyserythropoiesis associated with a Fas-deficient condition in childhood. Br. J. Haematol. 108, 300–304 (2000). 40.Devadas, S., Zaritskaya, L., Rhee, S.G., Oberley, L. & Williams, M.S. Discrete generation of superoxide and hydrogen peroxide by T cell receptor stimulation: selective regulation of mitogen-activated protein kinase activation and Fas ligand expression. J. Exp. Med. 195, 59–70 (2002). advance online publication nature medicine ONLINE METHODS Mice. C57BL/6 mice were bred and housed in the pathogen-free facilities of Bichat Medical School. All protocols were approved by the Animal Care Committee of INSERM. The Hbbth1/th1 mouse model originated from a natural occurring deletion of the gene encoding β-globin18. Hbbth1/th1 mice constitute a model of β-thalassemia intermedia. All in vivo experiments were performed with female mice. Treatment with RAP-011. Thalassemic mice were treated subcutaneously with RAP-011 at a dose of 10 mg per kg body weight in PBS, twice a week. RAP-011 is a version of sotatercept in which the Fc region is of mouse origin. Mice were analyzed at different time points (day 5 to day 60, n = 5 per time point). Data are representative of one out of three independent experiments. © 2014 Nature America, Inc. All rights reserved. Blood parameters. Blood samples were collected in EDTA-coated tubes, and complete blood counts were measured on a MS9-5 Blood Analyzer (Melet Schloesing Laboratories) according to the manufacturer’s instructions. Reticulocytes were determined with Retic-COUNT Reagent (BD Biosciences Retic-Count Kit). Blood smears collected from treated mice were air dried and stained with May-Grünwald-Giemsa. Serum ELISA. Erythropoietin concentration was determined from mouse sera using the Quantikine Mouse Epo Immunoassay (R&D Systems) according to the manufacturer’s procedures. Sandwich ELISA for GDF11 and for activin A and activin B was performed by coating plates with RAP-011 or sotatercept, respectively (5 µg/ml). Sera from control subjects and patients with β-thalassemia major, 1/50,000 dilution, as well as from control and thalassemic mice, 1/2 dilution. Proteins of interest were detected by antibody to GDF8 and GDF11 (sc28910, Santa Cruz Technologies) or antibodies to activin A (AF338, R&D Systems) or activin B (BAM3381, R&D Systems) at 2 µg/ml and developed by anti-rabbit or anti-mouse HRP-coupled antibodies, respectively. In vitro erythroblast cultures. Cells from bone marrow and spleen were cultured as described elsewhere41. Briefly, bone marrow or spleen cells were resuspended in serum-free ‘erythroid expansion medium’ consisting of StemPro34 plus nutrient supplement (Life Technologies Gibco-BRL) supplemented with 1 U/ml human recombinant erythropoietin (Roche), 100 ng/ml stem cell factor (SCF) (PeproTech), 1 µM dexamethasone (D2915; Sigma) and penicillinstreptomycin (Pen/Strep; Invitrogen). After 5 d of culture, the nonadherent cells were transferred to differentiation medium (StemPro-34 supplemented with 2 U/ml erythropoietin and 1 mg/ml human iron-saturated transferrin (Sigma)) for 2–3 d, supplemented or not with 10 µg/ml RAP-011, antibodies against GDF8 (ab71808, Abcam), GDF8 and GDF11 (sc28910, Santa Cruz) or GDF11 proform (ab71347, Abcam), activin A (AF338, R&D Systems) or activin B (MAB659, R&D Systems) blocking antibodies and rGDF11, rGDF8 or rGDF15 (Peprotech). Live cells were determined by Trypan blue (Gibco/BRL) exclusion, and cell concentration was adjusted to 2 × 10⁶ total cells per ml daily through partial medium changes. Analyses of a- and b-globin chains in plasma and on RBC membranes (TAU-PAGE). To visualize soluble as well as membrane-bound globins, we used TAU gel electrophoresis, which resolves α- and β-globin subunits under denaturing conditions5,34. 0.5% Triton X-100 was added to the washing solution. The fraction of sample loaded on the TAU gel was adjusted to 40 µg after determination of protein concentration (Thermo Scientific BCA Protein Assay Kit). In vitro generation of CD36+ erythroid cells. Umbilical cord blood units from normal full-term deliveries were obtained, after informed consent from the mother, from the Obstetrics Unit of Hôpital Necker-Enfants Malades, Paris, France. Peripheral blood from adult subjects with β-thalassemia major (β0-TM) was obtained from the Department of Biotherapy, Hôpital Necker-Enfants Malades. Subject samples were obtained with informed consent from the donors and after approval by the institutional review board at Hôpital Necker (Comité de protection des personnes “Ile-de-France II”). CD34+ progenitors isolated from cord blood (Miltenyi CD34 Progenitor Cell Isolation Kit) were cultured for 7 d with interleukin-6 (IL-6) (100 ng/ml), IL-3 (10 ng/ml) and doi:10.1038/nm.3468 SCF (100 ng/ml) in IMDM (Gibco cell culture) supplemented with 15% BIT 9500 (STEMCELL Technologies). CD36+ erythroid progenitors were then generated in the presence of IL-3 (10 ng/ml), SCF (100 ng/ml) and erythropoietin (2 U/ml). Cytospins were performed on CD36+ cells from cord blood and from the blood of β0-TM subjects at day 8 of culture. Hypoxia and chronic anemia models. Immune-mediated anemia was induced by a single intraperitoneal injection of 100 µg of purified antibodies to RBCs (34-3C IgG2a, provided by S. Izui, University Medical Center, University of Geneva). For intermittent chronic hypoxia, mice were exposed to hypoxia (8% oxygen; Messer) for 14 h followed by reoxygenation (20% oxygen) for 10 h for 3 d consecutively in a hypoxic animal chamber and killed immediately thereafter. Five hundred microliters of blood were taken by retro-orbital bleeding for further analysis. Immunofluorescence analysis by flow cytometry. Bone marrow and spleen cell suspensions were incubated with anti-FcγR mAb 2.4G2 to block IgG receptors. Cells (1 × 10⁶) were then stained with antibodies against Ter-119 (#553673, BD Biosciences; 1/100 dilution), mouse TfR1/CD71 (#553266, BD Biosciences; 1/100 dilution), Fas (#557653, BD Biosciences; 1/200 dilution) and biotinylated FasL (#555292, BD Biosciences; 1/200 dilution), which was detected by streptavidin-conjugated V450 (#560797, BD Biosciences; 1/200 dilution). Dead cells were excluded by 7-AAD labeling (BD Biosciences). Cells were further analyzed by flow cytometry (FACScanto; BD Biosciences) using FlowJo software (Tree Star). For intracellular staining, bone marrow and spleen cells were incubated for 4 h in culture medium containing 2 µg/ml brefeldin A (Sigma). Cells were then stained with antibodies for cell surface markers, fixed with paraformaldehyde and resuspended in permeabilization buffer (Ebiosciences). Binding of primary antibodies against GDF8 and GDF11 (sc28910, Santa Cruz; 1/50 dilution), GDF11 proform (ab71347, Abcam; 1/50 dilution), activin A (AF338, R&D Systems; 1/100 dilution) and activin B (MAB659, R&D Systems; 1/100 dilution) was detected by respective species-specific secondary antibodies conjugated with AlexaFluor 488 (Life Technologies; 1/200 dilution). Immunohistology. Paraffin-embedded bone marrow or spleen sections (5 µm) were stained with H&E for morphological analysis. For immunohistochemistry and confocal analysis, sections were processed for antigen retrieval as indicated by each manufacturer and incubated overnight with primary antibodies against GDF11 proform (ab71347, Abcam; 1/100 dilution), mature GDF11 (sc28910, Santa Cruz; 1/20 dilution), activin A (AF338, R&D Systems; 1/100 dilution), activin B (MAB659, R&D Systems; 1/100 dilution), activin receptor II (sc-25451, Santa Cruz; 1/100 dilution), phospho-Smad1/5 (#9511, Cell Signaling; 1/100 dilution), phospho-Smad2 (#3101, Cell Signaling; 1/100 dilution), Ter-119 (#553673, BD Biosciences; 1/100 dilution), CD71 (136800, Life Technologies; 1/200 dilution) or F4/80 (sc-377009, Santa Cruz Biotechnology; 1/50 dilution). Following incubation with biotinylated species-specific secondary antibodies (1/250 dilution) for 1 h and streptavidin-HRP for 30 min (Vectastain, ABC kit; Vector Laboratories, Burlingame, USA), the immunoperoxidase reaction was visualized by addition of 3,3′-diaminobenzidine (DAB) in chromagen solution (Dako, Carpinteria, USA). Slides were mounted with the Eukitt mounting medium (Electron Microscopy Sciences) and read with an upright microscope (Leica DM2000, Leica Microsystems) at magnification ×200. For confocal analysis, slides were incubated with AlexaFluor-conjugated secondary antibodies and counterstained with DAPI (Sigma Aldrich). For detection of TUNELpositive cells, paraffin sections were labeled first with TUNEL (Roche Diagnostic) and then with primary anti–Ter-119 and anti-CD71 antibodies. Slides were incubated with AlexaFluor-conjugated anti-rabbit and anti-mouse secondary antibodies (Life Technologies; 1/200 dilution) and then with DAPI. Confocal images were acquired on a Zeiss LSM 510 and analyzed using Imaris software at magnification ×400. Hemoglobin assay. Erythroblasts (5 × 10⁶ cells/condition) were incubated with 200 µl Drabkin’s reagent (Sigma), and total hemoglobin concentration was determined by absorbance at 540 nm. Cell membranes were then pelleted by centrifugation at 14,000g for 30 min, supernatants were collected and soluble hemoglobin was measured. For blood analysis, hemolysates were generated by nature medicine mixing 10 µL of blood (EDTA) with 90 µL of MilliQ water, incubating on ice for 10 min and homogenizing by vortex every 3 min. Total hemoglobin levels were determined by measuring absorbance at 540 nm (TECAN infinite 200) on 10 µL of hemolysate mixed with 190 µL of Drabkin’s reagent (Sigma Aldrich). Soluble hemoglobin levels were determined after centrifugation at 18,000g for 30 min at 4 °C and measuring absorbance at 540 nm. Reactive oxygen species. ROS levels were evaluated by incubation for 15 min, carried out at 37 °C in a humidified 5% CO2 incubator with 10 µM of the cell permeant reagent 2′,7′-dichlorofluorescein diacetate, a fluorogenic dye that measures hydroxyl, peroxyl and other ROS activity within the cell. DCFH fluorescence excitation and emission spectra were at 495 nm and 529 nm, respectively, and ROS levels were measured by flow cytometry. © 2014 Nature America, Inc. All rights reserved. siRNA oligonucleotides. Four individual siRNAs that target mouse GDF11 or activin B were purchased from Qiagen (SI01010863). In vitro differentiated erythroblasts were transfected with specific siRNA using HiPerFect Transfection Reagent (Qiagen). Knockdown efficiency was monitored by quantitative real-time PCR 48 h after transfection. Cells were further analyzed by flow cytometry. Immunoblotting. Cells were lysed in 1 ml of RIPA buffer supplemented with a phosphatase and protease inhibitor cocktail (P0044, Sigma-Aldrich) for 10 min at 4 °C and centrifuged to obtain the soluble fraction. Proteins were quantified by the bicinchoninic acid method according to the manufacturer’s instructions (Pierce). The concentrations were equalized, and the extracts were boiled for 5 min in Laemmli sample buffer (62 mM Tris-HCl pH 6.8, 10% glycerol, 2% SDS and 5% β-mercaptoethanol). The extract (30 µg per lane) was loaded on a 16% tricine-PAGE gel (Life Technologies) and transferred onto a PVDF membrane (GE Healthcare). Specific proteins were detected by immunoblotting using antibodies to GDF11 proform (ab71347, Abcam) and mature GDF11 and GDF8 (sc28910, Santa Cruz), 1/1,000 dilution, followed by detection using HRPconjugated secondary antibody, 1/50,000 dilution, and visualized by chemoluminescence with Luminata Forte Western HRP substrate (Millipore). β-actin (Ab8227-50, Abcam, 1/5,000 dilution) was used as a loading control. Quantitative real-time RT-PCR. Total RNA was extracted from erythroid progenitors (RNEasyPlus Mini kit, Qiagen) and quantified with a Nanodrop system. RNA quality was assessed by 260:280 nm absorbance ratio and agarose gel electrophoresis. Reverse transcription was carried out from 500 ng total RNA using the iScript reverse transcription Supermix (Bio-Rad, Hercules, CA, USA). Real-time PCR was performed using SsoFast EvaGreen Supermix (Bio-Rad). Primers with the following sequences were obtained from Eurofins MWG Operon (Ebersberg, Germany). Activin A (Inhba): (sense) 5′-TGGTGCCAGTCTAGTGCTTC-3′, (antisense) 5′-CCGTCACTCCCATCTTTCTT-3′; activin B (Inhbb): (sense) 5′-ACAGGCCCTTTGTAGTGGTG-3′, (antisense) 5′- GCTGCCCTCACAGT AGTTCC-3′; Acvr2a: (sense) 5′-GCGTTCGCCGTCTTTCTTATC-3′, (antisense) 5′-GTTGGTTCTGTCTCTTTCCCAAT-3′; Acvr2b: (sense) 5′-CAGTCG TGGCAGAGTGAAC-3′, (antisense) 5′-GGAGCCCTTGTCGTGGAAG-3′; ALK4 (Acvr1b): (sense) 5′-CGCTCCAGGATCTCGTCTAC-3′, (antisense) 5′-AACCAAGACCGTTCTTCACG-3′; ALK5 (Tgfbr1): (sense) 5′-ACCTTC TGATCCATCGGTTG-3′, (antisense) 5′-TTCCTGTTGGCTGAGTTGTG-3′; Bmp10: (sense) 5′-GACCCTTTGCTGGTTGTGTT-3′, (antisense) 5′-TCAT GTTCGACCTCATCTGC-3′; Gapdh: (sense) 5′-ACGGCAAATTCAACGGC ACAGTCA-3′, (antisense) 5′-TGGGGGCATCGGCAGAAGG-3′; Gdf8: (sense) nature medicine 5′-CTGTAACCTTCCCAGGACCA-3′, (antisense) 5′-TCTTTTGGGTGCG ATAATCC-3′; Gdf11: (sense) 5′-CTAAGCGCTACAAGGCCAAC-3′, (antisense) 5′-AGCATGTTGATTGGGGACAT-3′; Gdf15: (sense) 5′-CTTGAAGACTT GGGCTGGAG-3′, (antisense) 5′-TAAGAACCACCGGGGTGTAG-3′; Hba-a1: (sense) 5′-CCTGGAAAGGATGTTTGCTAGCT-3′, (antisense) 5′-GCCG TGGCTTACATCAAAGTG-3′; Hbb-bh1: (sense) 5′-AGTTTGGAAACCTCT CTTCTGCCCTG-3′, (antisense) 5′-TGTTCTTAACCCCCAAGCCCAAG-3′; Hbb-y: (sense) 5′-CTCTAGCTGTCCAGCAATCCTG-3′, (antisense) 5′-GCT TTCAAGGAACAGTCCAGTATTC-3′; Hepcidin (Hamp): (sense) 5′-TG TCTCCTGCTTCTCCTCCT-3′, (antisense) 5′-TGGGGAAGTTGGTGTCTC TC-3′; Rps3: (sense) 5′-GACCGCAGTTGTCCAGAA-3′, (antisense) 5′-TG CATAAAGCTCTACGCTG-3′. Gene quantification was performed in duplicate using the CFX96 PCR System (Bio-Rad). Data were normalized to GAPDH or RPS3 values. Mouse retrospective microarray analysis. Microarray data from CD71+Ter-119+FSChigh matched erythroblasts from E14.5 fetal livers of wild-type and Hbbth3/th3 embryos have been described previously42 and are available at the Gene Expression Omnibus database under the accession number GSE34125. Analysis was performed using GEO2R software (http://www.ncbi. nlm.nih.gov/geo/geo2r/). Gene reporter assays. C2C12 cells (ATCC) were transiently co-transfected with pGL3-BRE–luc or pGL3-CAGA-luc vectors and pcDNA3.1-GFP (9:1 mass proportion) with Lipofectamine LTX Plus (Invitrogen) following the manufacturer’s instructions. After 24 h, cells were incubated with the ALK4/5 inhibitor SB505124 (SelleckBio) (0.1, 1 and 10 µM) or the ALK5 inhibitor SB431542 (0.1, 1 and 10 µM) (Sigma-Aldrich). After 30 min, cells were treated with different concentrations of GDF11 (from 3 to 100 ng/ml, R&D systems), BMP2 (20 ng/ml, R&D) or TGF-β1 (5 ng/ml, Sigma-Aldrich). After 16 h, cells were lysed with Glo lysis buffer (Promega), and fluorescence was acquired on an Infinite M200 plate reader (Tecan). After addition of Bright Glo reagent (1:1 vol/vol, Promega), firefly luminescence were acquired on an Infinite M200 plate reader. Results were expressed as relative light units (RLU) normalized by relative fluorescence units (RFU). Iron, bilirubin and transferrin quantification. Blood was drawn into tubes and centrifuged (15 min, 4 °C, 3,000g). Serum biochemical parameters (transferrin, serum iron, total bilirubin and direct (conjugated) bilirubin) were quantified with an Olympus AU400 automated analyzer according to the manufacturer’s instructions. Statistical analyses. Statistical analyses were performed with GraphPad Prism (version 5.0; GraphPad software). The data are expressed as the mean ± s.e.m. of n determinations unless noted otherwise. Student’s t-test or the Mann-Whitney tests were used to compare two groups, whereas multigroup comparisons were made using two-way analysis of variance test followed by post hoc analysis (Bonferroni test). Differences were considered significant at a P value less than 0.05 (*), less than 0.01 (**) or less than 0.001 (***). 41.Dolznig, H. et al. Establishment of normal, terminally differentiating mouse erythroid progenitors: molecular characterization by cDNA arrays. FASEB J. 15, 1442–1444 (2001). 42.Khandros, E., Thom, C.S., D’Souza, J. & Weiss, M.J. Integrated protein qualitycontrol pathways regulate free α-globin in murine β-thalassemia. Blood 119, 5265–5275 (2012). doi:10.1038/nm.3468
© Copyright 2026 ExpyDoc