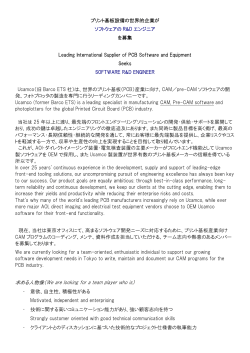
Hot Energy Topic
October 2015
12
The Market Stability Reserve: Assessing Reform
Needs and Possible Impacts on the EU ETS
Lead Author: Sylvain Cail (Enerdata)
Authoring team: Matthieu Jalard and Emilie Alberola (I4CE - Institute for Climate Economics / Climate KIC /
KIC Inno Energy)
Reviewers: Paul Deane (University College Cork), Robert Beestermoeller (University of Stuttgart)
Legal Notice: Responsibility for the information and views set out in this paper lies entirely with the authors.
This Hot Energy Topic assesses the European
Emissions Trading System (EU ETS)’s reform
with the introduction of the Market Stability
Reserve (MSR) as of 2019. This new reserve
mechanism has a number of aims; namely to
restore the EU ETS short-term scarcity by
absorbing the surplus of allowances, to build
resilience to supply-demand imbalances and
also to enhance synergies with other climate
and energy policies.
A growing surplus undermining
the EU ETS effectiveness
The EU ETS is on track to achieve its 2020
emissions target, namely a 21% reduction
compared to 2005 levels. EU ETS CO2
emissions have decreased by 14.5% (EUTL,
2015) since the beginning of phase II (20082014), and by 19% when taking into account
the introduction of new greenhouse gases
(nitrous oxide and perfluorocarbons) and
sectors (aluminium and part of the chemical
industry) in 2013.
an increasing surplus if the emissions cap is
not adjusted accordingly. Abatements linked
to the Energy Efficiency Directive enforced
after the definition of the EU ETS cap are
estimated to amount to roughly 500 MtCO2e
over Phase III and the cumulative inflow of
international credits will amount to 1.6 GtCO2e
in Phase III. A large share of abatements stem
from the RES directive as outlined in Figure 1,
but was considered when the cap was set in
2008. Only the overachievement of the 2020
target to generate 34% of EU 28 power with
RES is expected to lead to more abatement
compared to what was considered in the
emissions cap and to contribute to the surplus
by an estimated 120 MtCO2e in Phase III.
As a consequence of the decrease of CO2
emissions, and in the context of an inflexible
emissions cap, a large surplus has been
building up in the EU ETS without any
perspective of decreasing before 2030,
amounting to 2.1 GtCO2 in 2014. This is
expected to achieve 2.6 GtCO2 in 2020 and
more than 3.0 GtCO2 in 2030.
The decrease in CO2 emissions has been
particularly sharp in the power sector
(-20.5%) due to the economic downturn,
strong progress in terms of energy efficiency,
and the uptake of renewable energy sources
(RES) accounting for 32% of the EU ETS
power in 2014 (ENTSO-E, 2015). In the period
2005 to 2011, I4CE (2013) estimated that
more than 1 GtCO2 has been removed in the
EU ETS compared to a counterfactual scenario.
Complementary energy and climate policies
are reducing emissions under the umbrella of
the cap, and contribute to the building up of
The INSIGHT_E project is funded by the European Commission under the 7th
Framework Program for Research and Technological Development (2007-2013).
1
Hot Energy Topic
October 2015
12
return of backloaded allowances to the
reserve, the EUA surplus could be limited to
2 GtCO2 in 2020 and decrease gradually from
2021 to 2030 to 500 MtCO2. As such, the MSR
will likely help to restore the short-term
scarcity needed during Phase IV of the EU
ETS, enabling market participants to take into
consideration the long-term stringency of
climate policies. It will also help increase
resilience to external shocks (I4CE and
Enerdata, 2015).
Figure 1: Baseline, cap and emissions in the EU ETS
Phases II and III (Source: Institute for Climate
Economics – I4CE, estimations based on European
Commission data 2015).
This short-term surplus, combined with the
myopia of market participants and low
confidence in the long-term decarbonisation
target, has led to a fall in prices from
€15/tCO2e in 2011, to a price range of
€3-8/tCO2e in the 2013-2015 period which
removes firms’ incentives to invest in lowcarbon technologies.
MSR effectiveness and evolution of
surplus
The legislative proposal for the MSR, disclosed
in January 2014, was approved by the EU
Parliament on 7th July 2015 with some
substantial changes from its initial version.
The final parameters detail the following:
withdrawal and reinjection thresholds of 833
and 400 MtCO2e, a start date in 2019, the
reintroduction of 900 million backloaded
allowances and unallocated allowances in
Phase III into the MSR, provisions for the
monitoring of the MSR which includes two
reviews in Phase IV, and an increased
reactivity of the mechanism compared to the
two years’ time lag initially proposed. The
decision was adopted by the EU Council on
18th September 2015.
The MSR was designed to address the lack of
flexibility in the supply side and the shortsightedness of market participants. As shown
in Figures 2 and 3, without the implementation
of the MSR, the estimated surplus could
increase to 3 GtCO2 by 2020. With the
implementation of the MSR from 2019 and the
As a result, the MSR reinforces the robustness
of the EU ETS, which ensures better price
consistency, and provides a more credible
framework for investment in low-carbon
technology development and deployment.
The MSR is likely to enhance the dynamic
efficiency of the EU ETS, and is a positive step
towards achieving emission reductions at the
least cost in the long run. However, dynamic
modelling results (CEC, 2014) underline the
difficulties in forecasting the impact of the
MSR on the banking behaviour of operators
and EUA prices. Inadequate withdrawal and
reinjection thresholds, not in line with hedging
needs, are likely to spur volatility and can
have detrimental consequences on the lowcarbon investment framework. Given the wide
range
of
uncertainties,
an
appropriate
governance of the MSR will be essential to
ensure
its
efficiency
by
recalibrating
parameters to avoid important deviations from
an efficient decarbonisation pathway.
Figure 2: The surplus of allowances without MSR in
the EU ETS (Source: Institute for Climate Economics
– I4CE, based on data from EC, EU TL, 2015).
2
Hot Energy Topic
October 2015
Figure 3: Impact of the MSR implementation on
allowances surplus in the EU ETS (Source: Institute
for Climate Economics – I4CE, based on data from
EC, EU TL, 2015).
Possible consequences of the MSR
on the EU ETS
Based on the analysis performed above, the
possible consequences of the ETS reform with
the introduction of the MSR as of 2019 are
assessed. To this end, two comparative
scenarios (with and without the MSR) are
calculated with the POLES1 model. This section
focuses on the projected price of allowances,
on the reductions performed in the different
ETS sectors and the associated sectoral
abatement costs.
Most existing analysis on the potential impact
of the MSR were performed before the
adoption of the reform by the EU Council in
September 2015 and therefore account for an
introduction of the mechanism from 2021 as
initially planned.
-
Reference: the level of surplus is
increasing until 2021 and remains
relatively stable until 2030 (above
2 GtCO2, in line with the reference case
from
the
European
Commission’s
Impact Assessment (EC, 2014) which is
comparable to Figure 2);
-
MSR: the Market Stability Reserve is
introduced from 2019, leading up to a
declining level of surplus reaching
about 500 MtCO2 in 2030 (following the
evolution profile described in Figure 3).
The level of available allowances surplus will
obviously impact the amount of surplus credits
used from market participants to comply with
their respective targets. As a consequence,
the effective reduction cap – i.e. net of surplus
utilization – of the EU ETS until 2030 will be
reduced accordingly and the necessary carbon
price incentive in the market to reach this
yearly level of emissions reduction is observed
in the following. The introduction of the MSR,
and therefore the reduced availability of
surplus allowances, leads to a sharper
increase of the EUA price (Figure 4). The
difference observed is increasing over time
and reaches €15/tCO2 at the end of Phase IV2.
Such an impact is relatively in line with other
existing studies, even though based on an
introduction of the mechanism from 2021. As
an example, Point Carbon (2014) estimates a
rise in carbon price of €11/tCO2 in 2028,
induced from the MSR, whereas CEC (2014)
mentions a €26/tCO2 increase, compared to
€13.2/tCO2 in the present analysis for the
same year.
The present assessment is performed with the
assumption of an introduction of the MSR as of
2019. Up until 2018, the level of allowances
surplus follows a single path, as described in
the previous section. From 2019 onwards, two
cases are considered, depending on the
implementation or not of the MSR:
2
1
POLES (Prospective Outlook on Long-term Energy
Systems) is a world energy-economy partial equilibrium
simulation model of the energy sector developed jointly by
Enerdata, EDDEN-CNRS and the EC-JRC IPTS.
In this section, all prices are given in €2010. Possible
differences with other studies like (EC, 2014) in the
absolute levels of CO2 price may be explained by the
different modelling approaches and assumptions regarding
e.g. incentives considered for energy efficiency and
renewable energy sources.
12
3
Hot Energy Topic
October 2015
12
subject to carbon leakage over Phase IV;
possible options for a system to avoid carbon
leakage are not accounted for in the present
modelling work.
Figure 4: Impact of the MSR on EUA price (source:
POLES-Enerdata model, 2015).
For an in-depth understanding of the economic
consequences that the introduction of the MSR
could have in the different EU ETS sectors, a
model coupling is performed between the
POLES model and the Carbon Market Tool
which is a dedicated software for the analysis
of carbon markets worldwide. As a result,
Table 1 provides an overview of the
consequences of the MSR in terms of the
additional
abatement
costs3
that
can
potentially accumulate over the period 20152030, resulting in the ETS individual sectors
from the reform.
Approximately two
thirds of additional
abatement costs could be supported by the
power sector, offering the highest flexibility in
terms of the emissions reduction potential
derived from relatively low average reduction
costs (€39 per ton of CO2 avoided). To a lesser
extent, industrial sectors, and in particular the
sector
of
mineral
products,
contribute
significantly to the additional reduction effort
required. For the EU ETS as a whole, total
additional abatement costs amount to €1.7bn
cumulated over the whole period 2015-2030.
These results would probably be amplified in
reality by the potential continuation of free
allocations for industrial sectors which are
3
The combined use of POLES and Carbon Market Tool
allows to derive the cumulative sector-specific abatement
costs presented here that are necessary to perform a
given emissions reduction profile over time.
In addition to abatement costs due to
emission reductions, the EU ETS may be
subject to an additional cumulated investment
reaching €21bn over 2015-2030, induced by
the introduction of the MSR. The electricity
sector is estimated to contribute to about 66%
of this investment in new generation
capacities, whereas 34% would be invested in
final demand sectors (e.g. industry and
households). Further, the final average price
of electricity paid by end users in 2030 may be
2% higher compared to the case without the
market stability reserve.
Within the EU ETS, the electricity generation
sector could increase its permits sales onto the
market by 18 MtCO2, allowed by the additional
domestic reductions achieved. To a much
lesser
degree,
the
aviation
sectors’
international bunkers offer flexibility to
increase their emission reduction efforts and
become a net permit exporter in comparison
to the case without the MSR. On the demand
side of the EU ETS, industrial sectors may
increase their sourcing on the market by about
16 MtCO2. In particular, the sectors mineral
products as well as upstream and refining
would be responsible for this trend.
In conclusion, the market stability reserve
induces additional emissions reduction from
market participants in the EU ETS, in
particular from the electricity generation
sector. From an economic point of view, the
price of allowances could be increased by
about 24% in 2030 in comparison to a case
without the implementation of the reform,
with first effects being perceived between
2020 and 2025.
4
Hot Energy Topic
October 2015
Sector
∆
abatement
costs
[€m]
Share of
total
[%]
(cumulative 2015-2030)
Average cost
per tCO2
avoided
[€/tCO2]
Industry
403
23.6%
46
Chemicals
48
2.8%
41
Manufacturing
30
1.7%
38
178
10.4%
46
Steel
76
4.5%
71
Upstream and
Refining
71
4.2%
38
1,129
66.0%
39
Buildings
22
1.3%
16
Residential
15
0.8%
30
7
0.4%
8
153
8.9%
43
22
1.3%
43
International
131
7.7%
44
Agriculture
4
0.2%
28
1,711
100%
40
Mineral
Production
Power
Services
Air
Transport
Domestic
Total EU ETS
Table 1: Impact of the MSR on 2015-2030
cumulative abatement costs in the EU ETS (source:
POLES-Enerdata model and Carbon Market Tool,
2015).
Conclusion
The MSR is a highly welcome reform for the
EU ETS as it is expected to gradually absorb
the current surplus and improve resilience to
exogenous shocks. This mechanism will clearly
help overcome market imperfections linked
mainly to the short-sightedness of market
participants. Therefore, it will help drive the
price trajectories closer to more efficient ones
to achieve long-term targets at a lower cost.
Indeed, from 2019 the MSR may lead to an
increase in the CO2 price by roughly
€201015/tCO2 by 2030 compared to a case
without the reform. Additional reductions will
be
performed
and
the
corresponding
abatement costs will be supported mainly by
the power sector.
However, the major drawback of the
mechanism lies in its inability to discriminate
between surplus stemming from abatement
efforts and surplus stemming from exogenous
shocks. Such a “robot-like” withdrawal of
surplus is likely to spur volatility if not
adjusted to hedging needs and can have
detrimental consequences on the low-carbon
investment framework. Given the likely and
unforeseeable evolution of business models
and hedging needs in the power sector, some
degree of “human intervention” could be
essential to recalibrate the MSR in a timely
fashion and to safeguard the dynamic
efficiency. Some stakeholders have called for a
committee of experts to assess the state of
the
EU
ETS
before
formulating
recommendations to adapt the design of the
MSR accordingly.
12
5
Hot Energy Topic
October 2015
12
References
CEC, 2014: EU ETS reform in the ClimateEnergy Package 2030: First lessons from the
ZEPHYR model, Climate Economics Chair
(January 2014).
EC, 2014: Impact assessment, Accompanying
the Proposal for a Decision of the European
Parliament and of the Council concerning the
establishment and operation of a market
stability reserve for the Union greenhouse gas
emission trading scheme and amending
Directive 2003/87/EC (January 2014).
http://ec.europa.eu/clima/policies/ets/reform/
docs/swd_2014_17_en.pdf
ENTSO-E, 2015: Online Production Data,
European Network of Transmission System
Operators for Electricity.
EUTL, 2015: European Union Transaction Log.
I4CE – Institute for Climate Economics, 2013:
Assessing the factors behind CO2 emissions
changes over the phases 1 and 2 of the EU
ETS: an econometric analysis (October 2013).
I4CE – Institute for Climate Economics and
Enerdata, 2015: Assessing the European
Commission’s proposal to revise the EU ETS
Directive by 2030 (forthcoming).
Point Carbon, 2014: The MSR: Impact on
balance and prices, CEPS Task Force – EU ETS
Market Stability Reserve (April 2014).
For further reading or information, please visit
www.insightenergy.org
6
© Copyright 2026 ExpyDoc