Expy
Doc
Explore Categories
Log in
Create new account
technology and computing
2013 UK CMR COMPILED LE SC.docx
Download
Report
Year 11 Lit CA 2014 HWK PRJ – My Last Duchess
August 6, 2014 Contact: Mark Cooper
Severe Weather Letter
BT investing in London
英語表現法
the guidelines on religious content
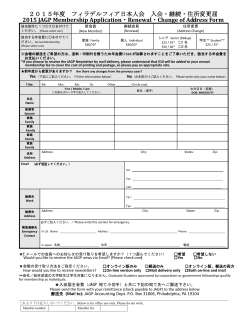
2015年度 フィラデルフィア日本人会 入会・継続・住所変更届 2015
英語Ⅱ 2015年度使用教科書一覧 【商 01/馬場崎 賢太】 『Welcome to
Charlene Polio 教授 特別講演会
BIOGRAPHY: ROB LEACH DIRECTOR OF
© Copyright 2026 ExpyDoc
About ExpyDoc
DMCA / GDPR
Report