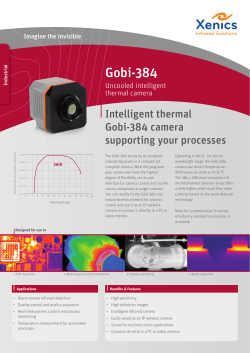
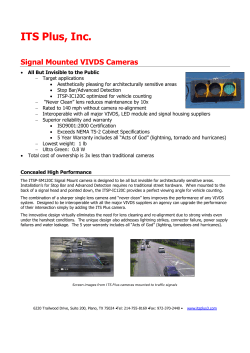
Optical Systems and Focal Plane Cameras
for the Cherenkov Telescope Array
Akira Okumura
for the CTA Consortium
Solar-Terrestrial Environment Laboratory, Nagoya University (Japan)
University of Leicester (UK)
at Workshop on Hanbury Brown & Twiss interferometry, Nice, France
May 12–13, 2014
Cherenkov Telescope Array (CTA)
The Next-generation Very-high-energy
(VHE) Gamma-ray Observatory
A Mixed Array of Four Different Telescopes
LST × (4 + 4)
MST × (~24 + ~15)
SCT × ~24
SST × ~70
D = 23 m
FOV = 4.5°
E = 20 GeV – 1 TeV
D = 12 m
FOV = 8°
E = 100 GeV – 10 TeV
D = 9.6 m
FOV = 8°
E = 100 GeV – 10 TeV
D = ~4 m
FOV ~9°
E = 1 TeV – 300 TeV
North
South
1 km
LST
MST
SCT
SST
3 km
Array Layout Examples
© G. Pérez, IAC, SMM
Detection Technique of VHE Gamma Rays
© G. Pérez, IAC, SMM
Detection Technique of VHE Gamma Rays
so that less improvement is expected, if any. The second are
waveform recording can improve performance concerns the sign
In particular for larger shower impact parameters, photon ar
not isochronous across the image (Fig. 10), and photons in th
the image arrive with significant delays compared to those fr
Use of variable and matched integration windows across the im
extraction of shower signals with minimal contamination from N
of signal shape and timing information is already used in the cu
[71] and VERITAS systems, and these results will help to gui
choices for CTA.
Gamma-ray Source
sum
Sum
ns
00.0ns
Air Shower (~10 km)
e, e+, γ
ns
55.0ns
ns
1010.0ns
θ ~ 1°
Atmospheric Cherenkov Light
Fig. 10 Integrated signal (upper left) and 1 ns samples of the development of
shower at 250 m core distance as seen in a telescope with optics and pixels simi
telescope but with a FoV of 10◦ diameter. Pixels near the “head” of the shower
dominated by the single photoelectron pulse width, while those in the “tail”
longer pulses. The shower image moves across almost half the FoV in about 25
Δt ~ 5 ns
m
R ~ 150
© NASA
© CORSIKA
© G. Pérez, IAC, SMM
The Basic Elements of the Cherenkov Telescope Array
A large primary mirror with segmented facets
Collect as many as photons possible to achieve a low energy threshold
Less expensive (a factor of 0.01 compared to astronomers’ telescopes)
Can reduce coma aberration in Davies-Cotton systems
Optical system
Parabolic system for LSTs to avoid timing spread of arrival photons
Davies-Cotton system for MSTs and/or SSTs to achieve wide FOV of ~8°
Schwarzschild-Couder system (primary and secondary mirrors) for SCTs and/or
SSTs to high resolution of ~0.05° over wide FOV of ~8°
Time spread < ~1 ns
Camera
Pixel size of ~0.1° (Cherenkov event image size ~ 1° × ~0.5°)
Fast and UV sensitive photodetectors (PMTs or SiPMs), some are AC coupled
Analog to digital conversion, fast signal sampling ~0.25 to 1 GHz, & trigger
6
Large-Sized Telescopes (LSTs)
Camera Structure
~2 m
Camera Prototype
23 m
Segmented parabolic mirror
f = 28 m, D = 23 m, FOV = 4.5°
Pixel = 50 mm (× 1,855 PMTs)
PSFD80 = ~ 0.05 – 0.2° (pix = 0.1°)
Artist’s View of an LST
1 optical system and 1 camera
designs
7
Medium-Sized Telescopes (MSTs)
Nectar Cam
~2 m
12 m
FlashCam
Davies-Cotton optical system
f = 16 m, D = 12 m, FOV = 8°
Pixel = 50 mm (× ~1,800 PMTs)
MST
PSFD68 = ~0.08 – 0.2° (pix = 0.18°)
1 optics and 2 camera designs
8
Schwarzschild-Couder Telescopes (SCTs)
SCT Camera
Schwarzschild-Couder optics
9.6 m
f = 5.6 m, D = 9.6 m, FOV = 8°
Pixel = 6 mm (× 11,328 SiPMs)
PSFD68 = ~0.04 – 0.08°(pix =
0.06°)
SCT
1 optics and 1 camera designs
9
Small-Sized Telescopes (SSTs)
SST-1M (Davies-Cotton)
SST-1M Cam
ASTRI
ASTRI
SST-GATE
CHEC
Davies-Cotton or SchwarzschildCouder optical system
f = 5.6 or 2.15 m, D = 4 m, FOV = ~9 –
10°
Pixel = 24.4 mm or ~6 mm (1307 or
~2000 SiPMs)
PSF = ~0.4° or ~0.05 – 0.15° (pix =
0.25° or ~0.15°)
2 optics and 3 camera designs…
10
The LST Optical System
Simulation with ROBAST by Koji Noda (MPI)
θ = 0.0°
θ = 0.5°
θ = 1.0°
θ = 2.0°
θ = 2.5°
PMT = 50 mm
θ = 1.5°
Spot Size (deg)
0.25
D80 in y-direction
FOV
D80 in x-direction
0.2
Default with 198 mirrors (y)
Default with 198 mirrors (x)
The on-axis performance is the
best, as the system is parabolic
0.15
0.1
D80 ~ 0.05°
0.05
80% containment diameter
0
0
198 spherical segmented
mirrors (387 m2)
0.5
1
1.5
2
2.5
Incident Angle (deg)
Large coma aberration may be
problematic if we put a HBT
detector at the camera edge
11
LST Mirrors
Cold Slumping Technique
90
Reflectance (%)
23 m
100
Press for 48 hrs
80
~92% @ 350 nm
70
60
(back) Glass
sheet 2.7mm
50 Konishi-E
Glue
Al Honeycomb of 60mm thick
A
3/8 inch Hexel
300
400
500
Wavelength (nm)
600
Glue Konishi-E
Glass
Sheet
Glassmm
sheet 2.7mm
t2.7
(surface)
(surface)
Mold ( R=56m )
±20 µm
Production with the cold slumping
technique and sputtering
PMT = 50 mm
Deviation from a Sphere
PSF by Ray Tracing
by Hironori Baba et al. (Ibaraki)
The mirror surface quality is
checked with the Phase Measuring
Deflectometry (PMD) method
Measured and simulated PSF sizes
are quite nice ~20% of a pixel
12
The LST Camera
ICRC 2013 Template
33 RD I NTERNATIONAL C OSMIC R AY C ONFERENCE , R IO DE JANEIRO 2013
Spectrometer*
Calibrated*photodiode***
or
*
Filters*
PMT
Tungsten*
&*
Deuterium*
Lamps*
Picoammeter*
Dynode
Cathode
Dark*Box*
Figure 1: Schematics of the QE measuring device
45
40
HA ZQ2905
HA ZQ2906
HA ZQ2909
HA X25
HA X27
HA X29
HA X31
HA X33
HA Z12
HA Z13
HA Z74
HA Z78
Cherenkov
35
30
25
20
15
10
5
0
200
300
400
500
600 700 800
Wavelength(nm)
Figure 2: Quantum Efficiency of 3 Hamamatsu R11920100-05 (ZQ2905, ZQ2906, ZQ2909) and 9 Hamamatsu
R11920-100 PMTs measured over wavelength 200 - 800nm.
The bottom dashed line is the simulated Cherenkov light
spectrum of 100GeV air showers from zenith measured at
2km a.s.l..
Hamamatsu provided us with a figure showing the QEs
of recently produced 300 PMTs, see Figure 3. One can see
that there are quite some number of PMTs showing peak
QEs in excess of 40%. The company could meet and even
further improve our requirements on QE and also on folded
with Cherenkov spectrum QE, see the green and yellow
lines on 3.
We measured also 6 samples of Electron Tubes Enter-
Figure 3: Quantum Efficiency of 300 recent PMTs
(R11920-100-05) from Hamamatsu. green circles: peak
QE. magenta dot: Average QE over Cherenkov spectrum
(290nm-600nm). The purple line shows the average over
Cherenkov spectrum QE request by CTA. The green and
the yellow lines show correspondingly the minimum peak
and the average over the Cherenkov spectrum QEs offered
by Hamamatsu.
range 350-400nm. These values are somewhat lower than
those from Hamamatsu PMTs. For further enhancing the
QE ETE is planning to use anti-reflective coat between the
photo cathode and the front glass. This should increase the
QE by 10-12%. Also, ETE is planning to use PMTs of mat
input window. This should further enhance the QE by another 6-8%. Thus we expect that in the end of the development work both types of PMTs will have similar QEs. The
relatively low QE of ETE PMTs at the 300nm and below is
due to the used glass type.
Eff. QE >40% @ 400 nm
Quantum Efficiency(%)
Quantum Efficiency(%)
We have measured 9 samples of Hamamatsu PMTs
(R11920-100) and 3 samples of new Hamamatsu PMTs
(R11920-100-05) that showed peak QEs over peak QE over
35%, see Figure 2. Serial numbers of new PMTs are shown
as ZQ29XX. New PMTs ZQ2906 & ZQ2909 show a QE in
excess of 43%. The bottom dashed line shows the spectrum
of Cherenkov light from 100GeV air showers coming from
near zenith direction. The simulated altitude is 2km a.s.l..
As one can see, the PMT QE curves make a good match to
the simulated Cherenkov light spectrum.
45
40
HA ZQ2905
HA ZQ2906
HA ZQ2909
ETE 218
ETE 222
ETE 223
ETE 224
ETE 226
ETE 227
Cherenkov
35
30
25
20
15
10
1,855 PMTs (UV sensitive)
Digitizes PMT waveforms at 1 GHz,
but continuous recording is not
possible
May be possible to install a
dedicated detector at the center
5
0
200
300
400
500
600 700 800
Wavelength(nm)
Figure 4: The QE of 6 PMTs of type D872/2A from ETE
and 3 from Hamamatsu (ZQ2905, ZQ2906, ZQ2909) for
the wavelength range of 200-800nm is shown. The bottom
dashed line is the simulated Cherenkov light spectrum of
100GeV air showers from zenith measured at 2km a.s.l..
Needs strong requests before
finalizing the design!
13
The SCT Optical System
.5 4 4.5 5
Field angle (deg)
Mirrors’ quality and
misalignment are not included
θ = 1.5°
θ = 2.0°
θ = 2.5°
θ = 3.5°
θ = 4.0°
Pixel = 6 mm
Angular Resolution (arcmin)
θ = 3.0°
5
4.5
The first optical system with a secondary
mirror in gamma-ray astronomy
2 × σSagittal
4
2 × σTangential
3.5
48 and 24 segmented aspherical mirrors
for the primary and the secondary,
respectively
3
2.5
2
1.5
1
0.5
0
0
0.5
1
1.5
2
2.5
3
3.5 4 4.5 5
Field angle (deg)
PSF will be dominated by the mirrors’
quality and misalignment, so it will be
more uniform over the FOV ~0.05 – 0.1°
14
The SCT Camera
TARGET Camera Module
see Bechtol+ (2012)
mm2
3×3
× 4 pixels
11,328 channels (× 4 SiPMs)
Signal digitization is done by very
compact and low power
consumption camera modules
(w/ TARGET ASICs)
From Hamamatsu Catalog
The camera center will be used
for optics alignment and
calibration
15
a
es
eof
e
ut
e
of
of
rs.
e
e
ll
d,
er
e
m
it
s
o
mttor
e
The shape and size of the PSF, defined here as the 80%
containment diameter on the focal plane for the photon
flux from a point source, has been simulated with ZEMAX,
with the sim telarray Monte Carlo programme [8] used
within the CTA consortium, and with the ROOT-based
ROBAST ray-tracing software [9].
As an example, the size of the PSF is shown in Fig. 3
as a function of the off-axis field angle, for point-sources
at infinity and at a distance of 5 km; the latter would correspond approximately to the distance of a very energetic
air shower. It can be seen that over most of the FoV, the
PSF is much smaller than the angular size of about 0.15◦
corresponding to a 6 mm pixel. It is still contained within
a single pixel at the edge of the FoV (field angle of 4.5◦).
The results shown here are based on simulations with
sim telarray and have been cross-checked with both ZEMAX and ROBAST. By simulating the PSF for small displacements in M1 and M2, tolerances of the mirror positions have been determined at ∼5 mm for M1 and ∼2 mm
for M2.
The SST-GATE Optical System
PSF (deg)
e
r-
0.25
source at infinity
PRELIMINARY
source at 5 km
0.2
0.15
θ = 0.0°
θ = 1.0°
θ = 2.0°
Pixel = 6 mm
θ = 3.0°
θ = 4.0°
One of three telescope designs,
based on the SchwarzschildCouder optical system
6 segmented primary mirrors,
and a monolithic secondary
0.1
0.05
0
0
Simulation with ROBAST by Cameron Rulten (Obs. Paris)
0.5
1
1.5
2
2.5
3
3.5
4
4.5
field angle (deg)
~0.05 – 0.15° over the FOV
16
Compact High-Energy Camera (CHEC) for SST
Camera Modules at Leicester
Compatible with both the SSTGATE and ASTRI optical systems
Sharing the common technologies
with the SCT camera
2,048 channels (× 4 SiPMs)
Again, it is difficult to put a
dedicated detector for HBT
interferometry
17
Where to Put Photodetectors for Interferometry?
???
LST
SCT
SST-CHEC
LSTs and MSTs could have a dedicated photodetector at the centers of the
cameras (but negotiations and feasibility study will be needed)
SCT and CHEC cannot, because an individual camera module has 64 channels
LST/MST/SCT have outskirts in the camera boxes, but the PSF is not excellent
The photon incident angle distribution at the focal plane is 0 to ~25 deg for LST,
~30 to ~60 deg for SCT and SST
18
Summary
Different designs of optical systems and cameras are being
developed in CTA
LST (parabolic), MST (Davies-Cotton), SCT (Schwarzschild-Couder), SST (DC or
SC)
Two and three cameras for MST and SST, respectively
They are all sensitive to UV (300 - 500 nm)
Typical PSF (D80) is ~0.05 – 0.1° (on-axis)
The default camera systems are of course designed only for gammaray astronomy
Need feedback and requests for the CTA camera teams
Willing to provide you the specifications and parameters of CTA
It is not easy to replace a camera pixel with a dedicated detector after
installation
We are finalizing camera designs!
19
© Copyright 2026 ExpyDoc