Expy
Doc
Explore Categories
Log in
Create new account
No category
Annual Report 2013
Download
Report
application for reimbursement of long service leave
Electricity Distribution Management
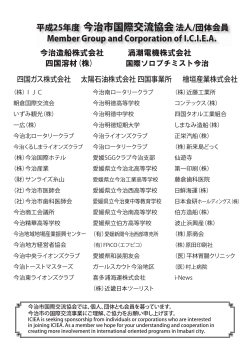
21. Member Groups and Corporations of ICIEA - 今治市国際交流協会
Techlead Profile (pdf)
The Build NYC Resource Corporation (the “Corporation”) is a not-for
Notice of Annual and Special General Meeting of Shareholders
Peter Doig - ROI Corporation
MONTHLY MARKET UPDATE: - Peak Financial Management
INPEX における技術開発の役割 - JOGMEC Techno Forum 2014
PFL Budget Newsletter 2014
© Copyright 2026 ExpyDoc
About ExpyDoc
DMCA / GDPR
Report