Expy
Doc
Explore Categories
Log in
Create new account
No category
DRAFT - LXP SUPPLEMENTAL 3Q 2014.xlsx
Download
Report
ElmTree announces Fund II Oversubscribed with
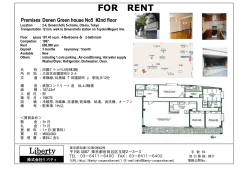
More Expansion⇒Click - Liberty Corporation 株式会社リバティ
March - Lin Andrews Real Estate
UNIT 5, STONEFIELD WAY, SOUTH RUSLIP, HA4 OJA.
lacy medical services, llc lacy medical services, llc
nft enterprises, inc - Seattle Apartments for Rents
Proyecto # 6 Sociales 7mo. Grado Marzo
view complete listing (pdf)
VALLEY FAIR VACANCIES.XLS
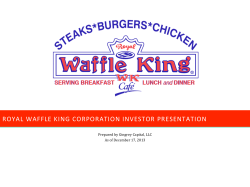
RWK Company Presentation
© Copyright 2026 ExpyDoc
About ExpyDoc
DMCA / GDPR
Report