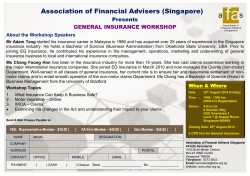
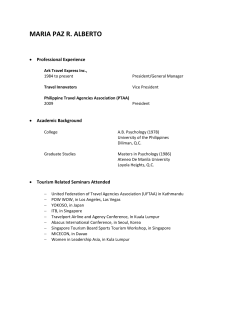
Oil & Gas - Equipment & Svs│Singapore October 27, 2014 COMPANY NOTE MTQ Corporation Ltd MTQ SP / MTLS.SI Market Cap Avg Daily Turnover Free Float Current S$1.20 Target S$1.56 US$143.3m US$0.08m 40.9% Prev. Target S$182.9m S$0.11m 152.4 m shares Up/Downside S$ 29.6% Conviction| Return of the prodigal son Notes from the Field ———————————————————————————————————————— YEO Zhi Bin T (65) 6210 8669 E [email protected] Company Visit Channel Check Expert Opinion Customer Views ———————————————————————————————————————— Show Style "View Doc Map" ‘‘ … I recently read an article that listed the top ten SGX listed companies by total shareholder value from 1 Jan 2004 to 1 Jun 2014 and was pleasantly gratified to see MTQ’s name featured, having delivered a total return of 1,190%. As investment horizons seem to get shorter, I think it is important to reflect on doing what is best for all shareholders in the longer term. Chairman Kuah Kok Kim in MTQ’s FY14 annual report The CIMB Stock Selection Tools (SST) are designed to complement and enhance the investment decision making process. The SST incorporate a range of analytical tools, providing ready access to key company and market data, valuation tools and charts. If you are interested in subscribing to the 'Stock Selection Tools', please contact your CIMB account manager. Price Close 151.2 1.60 135.7 1.40 120.1 1.20 104.6 1.00 600 89.0 Vol th 400 200 Jan-14 Apr-14 Jul-14 Source: Bloomberg EFAPChartPriceVolRelDaily| 52-week share price range 1.20 1.81 1.15 1.56 Current Target Far from being wasteful, MTQ can be construed as a story of filial piety, with the son, CEO Kuah Boon Wee, returning to help his father grow the business. Since his succession, Mr Kuah and his management team have grown the group’s earnings by a CAGR of 31% for FY11-14 on the back of three acquisitions over the last three years. Our base-case scenario factors in a consolidation of MTQ’s acquired businesses. We forecast 14% earnings CAGR for FY14-17, with earnings accelerating after bottoming in FY15. Given the undemanding valuations, we initiate coverage with an Add rating and target price of S$1.56 (blend of 7x CY16 P/E & 1.5x CY15 P/BV). Potential catalysts include earnings strength and accretive-acquisitions. Return of the prodigal son Mr Kuah Boon Wee succeeded his father, Chairman Mr Kuah Kok Kim, as CEO in FY11, armed with an impressive CV, having served as CEO of PSA Singapore terminals and CFO of ST Engineering. As the management team was strengthened, MTQ embarked on a series of earningsand value-accretive acquisitions (Premier group acquired at 3.5x trailing P/E and Neptune at 1x P/NTA) to transform itself from an oilfield equipment services provider to a diversified services provider for the oil & gas industry. As a result, its earnings took a much steeper trajectory from FY11. Laying the foundations While MTQ’s businesses are relatively small and compete in a very fragmented industry, the group enjoys healthy gross margins of 35-40%. The business is also highly cash-generative. For FY11-14, its operating cash flow was, on average, 1.6x net profit. We forecast 14% core earnings CAGR for FY14-17 as it consolidates its acquired businesses. We expect the growth to be underpinned by improving profitability from Neptune (a subsea specialist) as well as the scaling up of both the Bahrain facility (an organic greenfield development targeting the Middle East market) and Binder (focuses on pipe support product range). Undemanding valuations Backed by a solid management team and organic growth on a stream of positive FCF, investors can now Add the stock at 3.9x CY15 EV/EBITDA, ~40% discount to peers’ average of 6.3x. On a P/BV basis, the stock also looks undervalued at 1.3x CY14 P/BV vs. forward ROE of 18%, while offering a forward dividend yield of 3-4%. Financial Summary Relative to FSSTI (RHS) 1.80 Oct-13 | Revenue (S$m) Operating EBITDA (S$m) Net Profit (S$m) Core EPS (S$) Core EPS Growth FD Core P/E (x) DPS (S$) Dividend Yield EV/EBITDA (x) P/FCFE (x) Net Gearing P/BV (x) ROE % Change In Core EPS Estimates CIMB/consensus EPS (x) Mar-13A 208.7 34.91 15.40 0.13 26.0% 9.44 0.029 2.40% 6.31 19.7 26.4% 1.63 19.2% Mar-14A 313.3 42.93 24.18 0.16 24.6% 7.58 0.037 3.05% 5.06 248.8 20.2% 1.40 19.9% Mar-15F 294.6 42.23 22.15 0.15 (8.2%) 8.26 0.037 3.05% 4.78 8.3 6.3% 1.24 15.9% 0.81 Mar-16F 321.0 50.43 28.60 0.19 29.1% 6.40 0.045 3.75% 3.67 12.4 (4.4%) 1.08 18.1% Mar-17F 337.2 58.52 35.48 0.23 24.1% 5.15 0.050 4.17% 2.73 NA (16.3%) 0.93 19.4% 0.85 SOURCE: CIMB, COMPANY REPORTS IMPORTANT DISCLOSURES, INCLUDING ANY REQUIRED RESEARCH CERTIFICATIONS, ARE PROVIDED AT THE END OF THIS REPORT. Designed by Eight, Powered by EFA MTQ Corporation Ltd│Singapore October 27, 2014 PEER COMPARISON Research Coverage Bloomberg Code ASL SP CSE SP MMT SP MTQ SP ASL Marine CSE Global Mermaid Maritime MTQ Corporation Ltd Market SG SG SG SG Recommendation HOLD REDUCE ADD ADD Rolling P/BV (x) Mkt Cap US$m 196 273 371 143 Price 0.60 0.68 0.34 1.20 Target Price 0.66 0.66 0.53 1.56 Upside 11.0% -2.7% 58.6% 29.6% 12-month Forward Rolling FD P/E (x) 3.50 50.0 45.0 3.00 40.0 2.50 35.0 2.00 30.0 25.0 1.50 20.0 1.00 15.0 10.0 0.50 5.0 0.00 Jan-11 Jan-12 ASL Marine Jan-13 CSE Global Jan-14 0.0 Jan-11 Jan-15 Mermaid Maritime MTQ Corporation Ltd ASL Marine EFACChartValnBig1| Jan-13 CSE Global Jan-14 Jan-15 Mermaid Maritime MTQ Corporation Ltd EFACChartValnBig2| Peer Aggregate: P/BV vs ROE Peer Aggregate: 12-mth Fwd FD P/E vs FD EPS Growth 1.40 16.0% 1.20 13.7% 1.00 11.4% 0.80 0.60 0.40 4.6% 0.20 2.3% 0.00 Jan-11 Jan-12 25.0 80% 20.0 56% 9.1% 15.0 32% 6.9% 10.0 8% 5.0 0.0% Jan-12 Jan-13 Rolling P/BV (x) (lhs) Jan-14 Jan-15 -16% 0.0 Jan-11 Jan-16 ROE (See Footnote) (rhs) -40% Jan-12 Jan-13 Jan-14 12-mth Fwd FD P/E (x) (See Footnote) (lhs) Jan-15 Jan-16 FD EPS Growth (See Footnote) (rhs) EFACChartValnBig4| Valuation ASL Marine CSE Global Mermaid Maritime MTQ Corporation Ltd FD P/E (x) (See Footnote) Dec-14 Dec-15 Dec-16 11.88 10.78 10.74 10.07 9.25 8.68 7.53 7.32 NA 8.08 6.79 5.40 Dec-14 0.60 1.68 0.64 1.28 P/BV (x) Dec-15 0.57 1.52 0.59 1.12 Dec-16 0.55 1.38 NA 0.96 EV/EBITDA (x) Dec-15 7.98 5.87 3.78 3.92 Dec-16 7.89 5.02 NA 2.93 Dividend Yield Dec-14 Dec-15 1.89% 2.31% 4.44% 4.81% 0.00% 0.00% 3.05% 3.57% Dec-16 2.52% 5.19% 0.00% 4.07% Dec-14 8.63 6.81 3.55 4.85 Growth and Returns ASL Marine CSE Global Mermaid Maritime MTQ Corporation Ltd FD EPS Growth Dec-14 -23.9% -68.2% 103.9% -1.4% (See Footnote) Dec-15 Dec-16 10.2% 0.4% 8.8% 6.5% 3.0% -100.0% 19.0% 25.6% ROE (See Footnote) Dec-14 Dec-15 5.1% 5.4% 17.3% 17.3% 8.8% 8.4% 16.8% 17.5% Dec-16 5.2% 16.7% 19.1% SOURCE: CIMB, COMPANY REPORTS Calculations are performed using EFA™ Monthly Interpolated Annualisation and Aggregation algorithms to December year ends. NPAT/EPS values for calculations and valuations are based on recurring and normalised values for GAAP and IFRS accounting standard companies respectively. 2 MTQ Corporation Ltd│Singapore October 27, 2014 BY THE NUMBERS Share price info Share px perf. (%) 1M 3M 12M Relative -6.4 -25.3 -2.8 Absolute -8.4 Major shareholders Kuah Kok Kim Maclean Investments Ltd Tai Tak Securities -29 -2.1 P/BV vs ROE 2.50 25.0% 2.00 20.0% 12-mth Fwd FD Core P/E vs FD Core EPS Growth 14.0 80% 12.0 66% 10.0 51% % held 1.50 15.0% 8.0 37% 24.5 1.00 10.0% 6.0 23% 4.0 9% 2.0 -6% 0.0 Jan-11 Jan-12 Jan-13 Jan-14 Jan-15 Jan-16 -20% 17.6 8.5 0.50 5.0% 0.00 Jan-11 Jan-12 Jan-13 Jan-14 Jan-15 Jan-16 0.0% Rolling P/BV (x) (lhs) 12-mth Fwd Rolling FD Core P/E (x) (lhs) ROE (See Footnote) (rhs) FD Core EPS Growth (rhs) Profit & Loss We project 14% core earnings CAGR for FY14-17, with an 8% earnings decline in FY15 (softer Singapore and shortfall in activities in Binder), followed by a 29% rebound in FY16. (S$m) Total Net Revenues Gross Profit Operating EBITDA Depreciation And Amortisation Operating EBIT Financial Income/(Expense) Pretax Income/(Loss) from Assoc. Non-Operating Income/(Expense) Profit Before Tax (pre-EI) Exceptional Items Pre-tax Profit Taxation Exceptional Income - post-tax Profit After Tax Minority Interests Preferred Dividends FX Gain/(Loss) - post tax Other Adjustments - post-tax Net Profit Recurring Net Profit Fully Diluted Recurring Net Profit Mar-13A 208.7 73.0 34.9 (8.5) 26.4 (1.5) 0.0 0.0 25.0 (4.3) 20.6 (4.0) Mar-14A 313.3 103.8 42.9 (10.3) 32.6 (2.6) 0.1 0.0 30.1 0.3 30.3 (5.4) Mar-15F 294.6 106.6 42.2 (11.2) 31.0 (2.3) (0.5) 0.0 28.2 0.0 28.2 (5.1) Mar-16F 321.0 121.0 50.4 (11.9) 38.6 (2.1) 0.0 0.0 36.5 0.0 36.5 (6.6) Mar-17F 337.2 132.7 58.5 (12.5) 46.0 (1.2) 0.5 0.0 45.3 0.0 45.3 (8.2) 16.6 (1.2) 24.9 (0.8) 23.2 (1.0) 29.9 (1.3) 37.2 (1.7) 15.4 18.9 18.9 24.2 24.0 24.0 22.2 22.2 22.2 28.6 28.6 28.6 35.5 35.5 35.5 Cash Flow MTQ has a highly cash-generative business, generating in FY11-14, on average, operating cash flow of 1.6x net profit (S$m) EBITDA Cash Flow from Invt. & Assoc. Change In Working Capital (Incr)/Decr in Total Provisions Other Non-Cash (Income)/Expense Other Operating Cashflow Net Interest (Paid)/Received Tax Paid Cashflow From Operations Capex Disposals Of FAs/subsidiaries Acq. Of Subsidiaries/investments Other Investing Cashflow Cash Flow From Investing Debt Raised/(repaid) Proceeds From Issue Of Shares Shares Repurchased Dividends Paid Preferred Dividends Other Financing Cashflow Cash Flow From Financing Total Cash Generated Free Cashflow To Equity Free Cashflow To Firm Mar-13A 34.91 Mar-14A 42.93 Mar-15F 42.23 Mar-16F 50.43 Mar-17F 58.52 (8.53) (2.46) 1.23 (5.06) (3.11) 4.69 (4.31) (1.41) (3.51) 21.84 (4.06) 1.92 (39.94) 2.28 (39.79) 27.00 6.16 0.00 (1.69) 0.29 0.26 (2.66) (6.11) 32.26 (13.97) 1.50 (14.39) 0.99 (25.87) (5.66) 0.00 0.00 (2.60) 0.00 0.00 (2.30) (5.08) 36.08 (12.00) 0.00 0.00 0.00 (12.00) (2.00) 0.00 0.00 (5.58) 0.00 0.00 (2.10) (6.56) 36.71 (12.00) 0.00 0.00 0.00 (12.00) (10.00) 0.00 0.00 (6.86) 0.00 0.00 (1.20) (8.16) 46.05 (12.00) 0.00 0.00 0.00 (12.00) (37.00) 0.00 0.00 (7.62) (0.05) 31.43 13.48 9.06 (16.49) (0.34) (8.59) (2.20) 0.73 9.32 0.00 (7.58) 16.50 22.08 26.58 0.00 (16.86) 7.86 14.71 27.01 0.00 (44.62) (10.57) (2.95) 35.45 SOURCE: CIMB RESEARCH, COMPANY 3 MTQ Corporation Ltd│Singapore October 27, 2014 BY THE NUMBERS Balance Sheet With minimal maintenance capex of S$12m p.a., we expect MTQ to turn net cash by FY16 (from 0.2x net gearing at end-FY14). MTQ historically enjoyed healthy margins but margins declined in FY14 due to a change in sales mix on consolidation of Neptune and Binder. We expect margins to expand, thanks to overhead reduction and operating leverage. (S$m) Total Cash And Equivalents Total Debtors Inventories Total Other Current Assets Total Current Assets Fixed Assets Total Investments Intangible Assets Total Other Non-Current Assets Total Non-current Assets Short-term Debt Current Portion of Long-Term Debt Total Creditors Other Current Liabilities Total Current Liabilities Total Long-term Debt Hybrid Debt - Debt Component Total Other Non-Current Liabilities Total Non-current Liabilities Total Provisions Total Liabilities Shareholders' Equity Minority Interests Total Equity Mar-13A 41.7 80.0 29.3 2.7 153.7 77.2 0.0 19.4 6.7 103.3 Mar-14A 37.4 78.3 29.0 2.7 147.5 81.5 2.3 31.7 8.5 124.0 Mar-15F 53.9 76.7 28.2 2.7 161.5 82.3 1.8 31.7 8.5 124.3 Mar-16F 61.8 83.5 30.8 2.7 178.8 82.4 1.8 31.7 8.5 124.4 Mar-17F 51.2 87.8 32.3 2.7 174.0 82.0 2.3 31.7 8.5 124.4 9.5 52.1 6.2 67.8 64.1 7.3 49.6 6.9 63.8 58.6 7.3 48.4 6.9 62.6 56.6 7.3 52.8 6.9 67.0 46.6 7.3 55.4 6.9 69.7 9.6 0.0 64.1 4.4 136.3 110.4 10.4 120.8 4.6 63.2 3.8 130.8 131.0 9.7 140.6 4.6 61.2 3.8 127.7 147.5 10.7 158.2 4.6 51.2 3.8 122.0 169.3 12.0 181.2 4.6 14.2 3.8 87.7 197.1 13.7 210.8 Mar-13A 62.6% 65.0% 16.7% (0.21) 0.73 17.11 19.4% 18.3% 93.74 72.20 101.6 29.9% 16.0% Mar-14A 50.1% 23.0% 13.7% (0.19) 0.86 11.20 17.8% 19.0% 92.19 50.81 88.6 20.8% 16.2% Mar-15F (6.0%) (1.6%) 14.3% (0.07) 0.97 12.41 18.0% 20.5% 96.01 55.61 95.2 17.7% 14.4% Mar-16F 9.0% 19.4% 15.7% 0.05 1.11 16.76 18.0% 19.5% 91.35 54.02 92.6 22.1% 16.8% Mar-17F 5.1% 16.0% 17.4% 0.23 1.29 32.89 18.0% 17.5% 92.71 56.33 96.6 25.6% 19.8% Mar-13A N/A N/A N/A N/A N/A N/A Mar-14A N/A N/A N/A N/A N/A N/A Mar-15F N/A N/A N/A N/A N/A N/A Mar-16F N/A N/A N/A N/A N/A N/A Mar-17F N/A N/A N/A N/A N/A N/A Key Ratios Revenue Growth Operating EBITDA Growth Operating EBITDA Margin Net Cash Per Share (S$) BVPS (S$) Gross Interest Cover Effective Tax Rate Net Dividend Payout Ratio Accounts Receivables Days Inventory Days Accounts Payables Days ROIC (%) ROCE (%) Key Drivers Outstanding Orderbook (S$m) Order Book Wins (S$m) Order Book Depletion (S$m) Average Day Rate Per Ship (US$) No. Of Ships (unit) Average Utilisation Rate (%) SOURCE: CIMB RESEARCH, COMPANY 4 MTQ Corporation Ltd│Singapore October 27, 2014 Return of the prodigal son Table of Contents 1. BACKGROUND p.5 2. BUSINESS DIVISIONS p.6 3. MANAGEMENT p.11 3. OUTLOOK p.14 5. FINANCIALS p.17 6. VALUATION AND RECOMMENDATION p.21 7. RISKS p.24 1. BACKGROUND 1.1 Growth through acquisitions Established in 1959, MTQ specialises in engineering solutions for oilfield equipment. The company repairs, manufactures and rents oilfield equipment and tools. The stock has a long listing history, having listed on the SGX SESDAQ in 1988 (subsequently upgraded to the mainboard in 1999). We consider the company to be a well-run, family business churning steady cashflows and profits, and one that has found its sweet spot among multinational customers in a very fragmented and competitive equipment supplier landscape. The company’s growth trajectory, however, took on a much steeper turn in FY11 when Mr Kuah Boon Wee (son of current Chairman Mr Kuah Kok Kim) was appointed CEO. Within three years, the company more than doubled its profits to S$24m in FY14, achieving a 3-year CAGR of 31% for FY11-14. Growth was fuelled by three acquisitions – Premier (Jul 2011), Neptune Marine Services (Nov 2012) and Binder (Jan 2014) – in the span of three years, which enabled MTQ to expand its services and geographic presence. Figure 1: Key milestones: In a span of three years, MTQ acquired three companies, propelling an FY11-14 earnings CAGR of 31% 2014 Expanded into design and manufacturing of proprietary and custom-built pipe support and pipe suspension through acquisition of Binder Group which has production facilities in Perth and Indonesia 2012 Acquisition of Neptune Marine Services Ltd located in Perth, Western Australia, which provides engineering services with a focus in subsea and topside services and has operational presence in the UK and Asia Acquisition of Premier Group with repair and manufacture oilfield equipment as well as supply oilfield equipment and tools manufactured by some of the leading global brands Incorporated MTQ Oilfield Services W.L.L in Bahrain to provide services to the oil & gas industry in Bahrain and Gulf states Metalock (Singapore) Ltd (originally known as Metalock (Singapore) Pte Ltd) renamed to MTQ Corporation Ltd and expanded into fuel injection business in Australia Divestment of marine related business Listed on SGX Mainboard and expanded into sales and repair of turbochargers business in Australia 2011 2009 2003 2002 1999 1988 1969 1959 Listed on SGX SESDAQ Metalock (Singapore) Pte Ltd was incorporated as private ltd company in Singapore and subsequently embarked on oilfield engineering, fabrication and equipment rental business Commenced operations in Singapore as Metalock (Far East) Ltd to set up a branch specialising in repairs of marine equipment SOURCES: CIMB, COMPANY REPORTS 5 MTQ Corporation Ltd│Singapore October 27, 2014 2. BUSINESS DIVISIONS MTQ has three distinct business divisions 1) oilfield engineering, 2) subsea services through 86.8%-owned Neptune Marine Services (NMS AU, Not Rated), and 3) engine systems. Figure 2: Revenue by segment 100% S$92m - S$128m - Figure 3: EBITDA by segment S$209m S$17m S$313m 100% 4 59 80% - 55 80% 160 50 S$21m Title: Source:- S$31m S$43m 2 3 Please fill in the values above to have them 12 entered in your report 5 4 60% 55 60% 49 40% 40% 13 18 23 27 74 20% 42 95 20% 105 0% FY11 Oilfield engineering FY12 FY13 Engine systems 0% FY14 FY11 Neptune Marine Oilfield engineering SOURCES: CIMB, COMPANY REPORTS FY12 FY13 Engine systems FY14 Neptune Marine SOURCES: CIMB, COMPANY REPORTS 2.1 Oilfield engineering: the core business Oilfield engineering accounted for 33% of the group’s FY14 revenue (S$105m) and 63% of EBITDA (S$27m). This division repairs, manufactures and rents oilfield equipment and tools. Oilfield equipment can be broadly categorised as 1) drilling equipment (drill pipe, drill collar), 2) pressure & flow control equipment (blowout preventer, valve, manifold), and 3) fishing and other equipment. MTQ’s core competency lies in the repair and refurbishment of blowout preventers (BOPs), which are safety devices (essentially large, high-pressure valves) used to prevent the uncontrolled flow of liquids and gases during well drilling operations. They are installed onboard drilling rigs such as jack-ups, semis or drillships. Generally, MTQ steps in when a drilling rig is undergoing its maintenance cycle. Classed vessels are required to undergo a comprehensive special survey including dry docking at each 5th anniversary of its delivery. In addition, an intermediate survey is required to be completed at the midpoint of the 5-year survey. A typical “bread-and-butter” job for MTQ would be the changing of components of the BOPs. Such jobs could take about 3-4 weeks to complete and could cost the customer US$200k-500k. A large contract would involve the stripping and re-assembly of the BOP. This could take up to three months and cost the customer US$6m-7m. MTQ also undertakes contract manufacturing in compliance with American Petroleum Institute Standards (API), fabrication of steel structures as well as rental of BOPs. Repair and contract manufacturing form the bulk of the division’s business. On average, each contributes around 50% of the division’s revenue. 6 MTQ Corporation Ltd│Singapore October 27, 2014 Figure 4: Apart from its core competency (repair & refurbishment of oil drilling equipment), MTQ offers contract manufacturing, steel fabrication and rental of BOPs Repair and refurbishment ▪ Ram and Annular Blowout Preventers (BOP) ▪ Assembly and testing of BOP stacks ▪ Gate valves ▪ Elevators Contract manufacturing ▪ Choke and Kill Manifolds ▪ Wellheads ▪ Tree Blocks ▪ Flanges ▪ DSA ▪ Clamps ▪ Diverters ▪ Mud Cross Fabrication ▪ Compressor Skids ▪ BOP Transporter Frames ▪ Scrubber Skids ▪ "U" Stamp Vessels ▪ Tree Frames ▪ Marine Risers ▪ Shipping Skids Rental ▪ BOPs ▪ ▪ ▪ ▪ ▪ ▪ ▪ ▪ Master Valve Body Casing Heads Riser Spools Diverter Support Housing Packer Housing Test Flanges Intermediate Flanges Fluid Ends SOURCES: CIMB, COMPANY REPORTS Figure 5: Rebuilt and complete stack-up 183/4’’ 15,000 PSI (pressure square inch) for a semi-submersible rig Figure 6: Contract manufacturing of choke and kill manifolds SOURCE: COMPANY SOURCE: COMPANY Figure 7: Fabrication works Figure 8: Rental of annular blowout preventer SOURCE: COMPANY SOURCE: COMPANY 7 MTQ Corporation Ltd│Singapore October 27, 2014 Premier group a star buy. Underpinned by the organic start-up of the Bahrain facility and acquisition of Premier group in FY12, the oilfield engineering division registered 35% revenue CAGR in FY11-14 and 27% EBITDA CAGR. Premier was a peripheral business that a US-listed company wanted to exit. MTQ acquired 100% of Premier for S$27.3m cash in Jul 2011. The acquisition enabled MTQ to increase its production capacity and expand its oilfield equipment range. On a proforma basis, Premier accounted for 29% (S$40.1m) of the group’s revenue and 47% (S$7.7m) of net profits in FY12. This implied that Premier was transacted at 3.5x trailing P/E. Considering Premier’s contributions to the group and its cheap acquisition cost, our view is that Premier has turned out to be the star buy for MTQ. Growing organically in Bahrain. The Bahrain facility is a greenfield investment located in an industrial park, costing around US$20m. The facility has been fully operational since late 2011, after around two years of development. It represents the fruition of MTQ’s efforts to organically expand its oilfield engineering division into the much larger Middle East market, which is 2-3x that of Southeast Asia. Essentially, MTQ aims to replicate its Singapore operations in the Middle East. In FY14, the Bahrain facility achieved S$8.5m revenue (8% of the division’s turnover). The facility is continuing to ramp up its operations but remains in red, albeit with losses narrowing. Latest acquisition: Binder group. The division took in a new business unit with the acquisition of 100% of Perth-based Binder group in Jan 2014 for S$22m cash. The acquisition of Binder increased MTQ’s scope of oilfield engineering solutions. Binder focuses on the pipe support product range, specifically for LNG processing plants. On a proforma basis, Binder accounted for 12% (S$40.5m) of the group’s revenue and 10% (S$2.7m) of net profits in FY14. This implied that Binder was transacted at 8x trailing P/E. Figure 9: Oilfield engineering by business units Business unit Pandan loop (original facility) Premier Binder Bahrain Oilfield engineering division Est. revenue (S$m) 30-50 20-40 20-40 >15 85-145 Est. gross margins 35-40% 35-40% 20-25% Breakeven level at S$15m 33-38% SOURCES: CIMB, COMPANY REPORTS Facilities. Oilfield engineering services are carried out at five facilities – Pandan Loop and Loyang in Singapore, Bahrain, Perth and Jakarta. MTQ is headquartered in its incumbent facility in Pandan Loop. Pandan Loop contains a fully equipped workshop with blasting and painting facilities. It also houses equipment that is among the largest vertical and horizontal boring equipment in Singapore. The facility in Loyang resulted from the acquisition of Premier. It contains an AOS-certified machine workshop and is capable of complete refurbishment, manufacturing and repair services. The facility in Bahrain is API-certified and is almost three times bigger than the facility in Pandan Loop. The Binder group has a facility in Perth, Australia. It also has a JV in Indonesia which operates a manufacturing facility in Jakarta. 8 MTQ Corporation Ltd│Singapore October 27, 2014 Figure 10: Oilfield engineering services are carried out at five facilities – Pandan Loop and Loyang in Singapore, Bahrian, Perth and Jakarta Pandan Loop (headquarters) ▪ Fully-equipped workshop with blasting and painting facilities ▪ Houses one of the largest vertical and horizontal boring equipment ▪ 14,000 sqm Loyang (acquired through Premier group) ▪ ▪ ▪ ▪ ▪ ▪ ▪ Bahrain Binder - Australia and Indonesia API certified machine workshop Capable of complete refurbishment and repair services API certified and fully operational since late 2011 Over 40,000 sqm of production area Design and manufacture to international standards Total of 11,600 sqm facility in Australia 21,800 sqm facility in Indonesia SOURCES: CIMB, COMPANY REPORTS Customers. MTQ is the authorised working partner for some of the world’s largest OEMs in drilling equipment such as GE oil & gas, Aker Solutions and National Oilwell Varco as well as drilling contractors/rig owners such as Transocean, Seadrill and Ensco. Figure 11: MTQ is the authorised working partner for some of the world’s largest OEMs in drilling equipment as well as drilling contractors/rig owners SOURCES: COMPANY 2.2 Subsea services: rebuilding profitability MTQ has a subsea arm through its 86.8% stake in Neptune Marine Services. Listed on the ASX, Perth-based Neptune is a subsea specialist with a presence in Australia and the UK. MTQ initially took a 12% equity stake in Neptune for A$1om in FY11. It launched a general offer for Neptune in Nov 12 at A$0.032/share. The offer closed in Apr 2013, with MTQ acquiring 86.8% of Neptune for S$54.2m cash, valuing Neptune at an implied FY12 P/BV of 0.7x or 1x FY12x P/NTA (if we were to erase goodwill/tangibles from the books). The group started consolidating Neptune’s contributions in 4Q13. CEO Mr Kuah Boon Wee was appointed Chairman of Neptune in Jun 2013 while CFO Dominic Siu was appointed non-executive director of Neptune. In FY14, Neptune accounted for 51% of the group’s revenues (S$160m) and 28% of its EBITDA (S$12m). The company is asset-light and does not own vessels to carry out its subsea jobs. It offers a variety f services including ROV (remotely operated vehicles), survey, diving, IRM and engineering manufacturing to oil companies such as Eni, Apache Energy as well as EPIC (engineering procurement installation commissioning) companies such as McDermott. 9 MTQ Corporation Ltd│Singapore October 27, 2014 Neptune is rebuilding profitability following a period of significant losses from asset and goodwill write-downs. The company went on an acquisition spree in 2008-10, which unfortunately coincided with an industry downturn. After shedding its non-core assets (disposal of a subsea vessel) and exiting businesses such as USA Diving and Australian fabrication over the last three years, the leaner Neptune has returned to the black. With a majority shareholder at its helm, MTQ is looking to enhance Neptune’s operational efficiency and further unlock shareholder value. Figure 13: Having right-sized its asset base, Neptune is in a net cash position Figure 12: Neptune returned to the black in FY14 (A$m) (A$m) 250 200 (x) Title: 329 Source: 350 189 300 136 150 118 290 15 Please fill in the values above to have them entered in your rep 136 116 20 17 250 100 10 7 5 200 50 21 5 1 FY09 FY10 FY11 (50) FY12 0 146 150 - 106 FY14 (40) -10 -7 (100) -14 50 (150) -15 FY09 Net income FY10 FY11 Total assets SOURCES: CIMB, BLOOMBERG -15 -20 - (143) (200) Revenue -5 98 93 -6 100 FY12 fy13 FY14 Net debt to equity (RHS) SOURCES: CIMB, BLOOMBERG *DUE TO A NEW FINANCIAL END DATE OF MAR 31 (TO ALIGN WITH MTQ), FY13 RESULTS IS NOT COMPARABLE 2.3 Engine systems: slower growth prospects Through its wholly-owned subsidiary MTQ Engine Systems (Aust) Pty Ltd (acquired in 1999), MTQ is the leading independent supplier of turbocharger and fuel injection parts and services in Australia with a nationwide network, representing reputable brands such as Bosch, IHI, Garrett, Denso and Schwitzer. Engine systems made up 16% of the group’s revenues (S$49m) and 8% of its EBITDA (S$4m) in FY14. Weighed down by negative consumer sentiment and the downturn in Australia’s resources sector, engine systems recorded tepid sales growth in recent years. Given its limited growth prospects, management has raised the possibility of selling this division should a good offer come along. 10 MTQ Corporation Ltd│Singapore October 27, 2014 3. MANAGEMENT 3.1 Return of the prodigal son Having sat on the board of directors since 2006, Mr Kuah Boon Wee succeeded his father, Chairman Mr Kuah Kok Kim as CEO on 1 Jul 2010. A UK-qualified chartered accountant with a degree in mechanical engineering, he was previously a senior management executive of PSA International Pte Ltd, having served as CEO of PSA Singapore terminals. He had also served as CFO of ST Engineering and held senior positions in the Jardine Matheson group. Meanwhile, Chairman Mr Kuah Kok Kim was CEO of the group since 1997 to 2010. Mr Kuah has extensive business experience through his many years of involvement in the marine logistics as well as oil & gas industry. He was also engaged in the machine distribution and repair business before joining MTQ. Since his appointment, CEO Boon Wee has refreshed and strengthened the management team. CFO Dominic Siu joined MTQ in FY12, having worked with Boon Wee in PSA International. Group Resources Director Mr Tan Chee Keong joined the group in FY13 to strength its human resource management. Mr Vincent Tan also joined MTQ in FY13. He has over 15 years of experience in general and operations management in the oil & gas industry. Prior to joining MTQ, Mr Tan was the Director of Sales, Pacific Rim of National Oilwell Varco’s fibre glass systems division. At its acquired subsidiaries, the group has retained talent and kept employee turnover at a minimum. There have been no changes at the managing director level for the various acquired subsidiaries – Premier, Neptune, Binder and MTQ Systems (Aust). The acquired business units are run somewhat autonomously, with regular/monthly reviews conducted by the corporate office. Management does not see much advantage in consolidating the various acquired operating business brands into one single banner. The various brands offer different services and have cultivated a certain degree of brand equity through the years. Lastly, to align management with shareholder interest, MTQ established a share plan for senior management in 2013. 11 MTQ Corporation Ltd│Singapore October 27, 2014 Figure 14: To align management with shareholder interest, MTQ established a share plan for senior management in 2013 SOURCES: COMPANY REPORTS 12 MTQ Corporation Ltd│Singapore October 27, 2014 3.2 Shareholders The four largest shareholders of MTQ collectively own about 59% of the company, with 41% of the company in the hands of the public. Chairman Kuah owns 24.5% of MTQ while CEO Kuah has a direct stake of 2.9%. Through Maclean Investments, Mr Kurt Robert Malkolm Lindbald (the original founder of MTQ) holds 17.6% of the company. His stake has been diluted through the years. The third largest shareholder is the Ho family which owns 8.5% of the company through Tai Tak Securities. The family’s main source of wealth is through its UOB Bank shareholdings. The fourth largest shareholder is SGX-listed Hwa Hong Corporation (an investment holding company) which owns 5.4% of the company through Singapore Warehouse Company Pte Ltd. The Ho family and Hwa Hong have one board representative each. Chairman Kuah took control of MTQ in the late 1990s, following a boardroom tussle. Figure 15: MTQ’s four largest shareholders own about 59% of the company Kuah family , 27.4% Public, 41.1% Original founder through Maclean Investments Ltd, 17.6% Hw a Hong through Singapore Warehouse Company Pte Ltd, 5.4% Ho family through Tai Tak Securities , 8.5% SOURCES: CIMB, BLOOMBERG 13 MTQ Corporation Ltd│Singapore October 27, 2014 4. OUTLOOK 4.1 Laying the foundations Having made three acquisitions over the last three years, the group will be in consolidation mode in the near term as it seeks to improve the performance of the acquired businesses. In addition, MTQ intends to start reaping cost synergies from consolidation of back-office functions as well as revenue synergies from the cross-selling of its services. We believe that acquisitions will take a breather and resume from FY16 onwards. 4.2 Softer Singapore due to slack in jack-up market In Singapore, utilisation (as measured by man-hours) in the Pandan facility has been firm but the Loyang facility has suffered a dip. Overall, the softer utilisation is due to weaker macro prospects and some slackness in the jack-up market. Jack-up utilisation serves as a leading indicator for MTQ’s utilisation. Higher utilisation implies higher activities and therefore, higher likelihood of wear and tear, which would then require MTQ’s services. Due to the growing availability of units, the Southeast Asian jack-up market has softened a little vs. the robust rates at the beginning of the year. IHS Petrodata estimates that there is currently a marketed supply of 68 jack-ups in the region, 62 of which are being contracted. This means that marketed utilisation stands at 92%. However, with a significant influx of newbuilds coming onstream in 2015-16, utilisation is projected to decrease to 81% towards end-2015. In addition, MTQ’s Singapore operations face a manpower crunch due to restriction of foreign workers, which has curtailed growth opportunities. In our view, MTQ’s Singapore operations have plateaued and could suffer a minor contraction in FY15. Figure 16: Southeast Asia jack-up supply & demand: Though the market is still healthy, utilisation is projected to decrease towards end-2015 due to growing availability of rigs Brunei Indonesia Malaysia Philippines Thailand Vietnam Others Demand Total supply Marketed supply Marketed utilisation Marketed surplus 2014 Dec 3.0 14.6 17.0 0.0 11.0 16.7 0.0 62.3 70.0 68.0 92% 5.7 Jan 3.0 14.9 17.5 1.0 12.0 16.1 0.0 64.5 70.0 68.0 95% 3.5 Feb 3.0 15.0 18.7 1.0 12.0 16.0 0.0 65.7 71.0 70.0 94% 4.3 Mar 3.0 14.2 18.0 1.0 12.0 16.5 0.0 64.7 71.0 70.0 92% 5.3 Apr 3.0 15.0 18.4 1.0 12.0 15.3 0.0 64.7 71.0 70.0 92% 5.3 May 3.0 14.3 18.1 1.0 12.9 15.0 0.0 64.3 71.0 70.0 92% 5.7 Jun 3.0 15.0 18.0 1.0 13.0 14.9 0.0 64.9 71.0 70.0 93% 5.1 2015 Jul 5.0 17.0 19.0 1.0 13.0 15.0 0.0 70.0 73.0 72.0 97% 2.0 Aug 5.0 16.8 19.0 1.0 12.9 14.7 0.0 69.4 74.0 73.0 95% 3.6 Sep 5.0 16.0 18.0 1.0 12.0 14.7 0.0 66.7 74.0 73.0 91% 6.3 Oct 5.0 15.6 18.0 1.0 13.0 13.9 0.0 66.5 75.0 74.0 90% 7.5 Nov 5.0 15.0 18.5 1.0 11.1 12.0 1.0 63.6 76.0 75.0 85% 11.4 Dec 5.0 15.0 17.9 1.0 10.0 12.0 1.0 61.9 77.0 76.0 81% 14.1 Avg 4.0 15.3 18.3 1.0 12.2 14.7 0.2 65.7 72.8 71.8 92% 6.2 SOURCES: CIMB, IHS PETRODATA WORLD RIG FORECAST: SHORT TERM TRENDS 4.3 Bahrain facility holds huge potential The Bahrain facility holds huge potential for the group. The Middle East is the largest market for jack-up rigs. IHS Petrodata estimates that there is currently a marketed supply of 145 jack-ups in the Middle East, 131 of which are being contracted, resulting in a marketed utilisation of 90%. Jack-up demand in the Middle East is expected to increase in the near term with an additional 10 units being required by end-2015, achieving a marketed utilisation of 96% by end-2015. Since 1Q11, demand in the region has grown in a linear fashion, by about 12 units per year. Given the rosy outlook, we think that the Bahrain facility will be able to capture a share of the expanding demand and contribute more significantly to the group’s profits in 2-3 years. The Bahrain facility achieved S$8.5m revenue in FY14 and we expect it to increase to S$15m in FY15, which would be the breakeven point for the facility. With further scaling up, we expect the Bahrain 14 MTQ Corporation Ltd│Singapore October 27, 2014 facility to contribute positively to the bottomline from FY16 onwards and become the group’s growth driver in the years ahead. Figure 17: Middle East jack-up supply and demand: jack-up demand in the Middle East is expected to increase in the near term with an additional 10 units being required by end-2015 Bahrain Egypt Iran Oman Qatar Saudi Arabia UAE Others Demand Total supply Marketed supply Marketed utilisation Marketed surplus 2014 Dec 0.0 11.0 26.6 0.0 14.0 54.0 25.0 0.0 130.6 149.0 145.0 90% 14.4 Jan 0.0 11.0 27.0 1.0 14.1 54.0 25.7 0.0 132.8 149.0 145.0 92% 12.2 Feb 0.0 11.0 28.0 2.0 14.0 54.0 28.0 0.0 137.0 150.0 146.0 94% 9.0 Mar 0.0 10.9 28.0 0.1 13.6 54.0 30.0 0.0 136.6 150.0 146.0 94% 9.4 Apr 0.0 10.0 28.0 1.0 14.0 54.0 31.0 0.0 138.0 150.0 146.0 95% 8.0 May 0.0 10.0 29.3 1.0 14.0 54.0 31.0 0.0 139.3 150.0 146.0 95% 6.7 Jun 0.0 10.5 29.0 1.0 14.0 55.0 31.0 0.0 140.5 150.0 146.0 96% 5.5 2015 Jul 0.0 10.0 28.8 1.0 14.0 56.0 31.4 0.0 141.2 150.0 146.0 97% 4.8 Aug 0.0 10.0 28.1 1.0 14.9 56.8 32.0 0.0 142.8 150.0 146.0 98% 3.2 Sep 0.0 10.0 28.0 1.0 14.0 57.3 32.0 0.0 142.3 150.0 146.0 97% 3.7 Oct 0.0 9.9 28.3 2.0 14.0 57.0 31.5 0.0 142.7 150.0 146.0 98% 3.3 Nov 0.0 10.0 28.0 2.0 15.0 56.8 32.0 0.0 143.8 150.0 146.0 98% 2.2 Dec 0.0 10.0 28.8 1.0 14.6 56.8 29.6 0.0 140.8 150.0 146.0 96% 5.2 Avg 0.0 10.3 28.3 1.2 14.2 55.5 30.4 0.0 139.9 150.0 146.0 96% 6.1 SOURCES: CIMB, IHS PETRODATA WORLD RIG FORECAST: SHORT TERM TRENDS 4.4 Neptune: demand from Icythys & Prelude LNG projects With development of Inpex’s A$34bn-Ichthy LNG project in full swing (first gas expected in end-2016) and the installation of Shell’s Prelude FLNG in 2015, activities are set to be robust for Neptune in the next three years. Already, Neptune has already secured a string of contracts to support the Ichthys project. The company was recently awarded the design and fabrication of specialist scour protection systems. It also successfully delivered concrete mattresses for the project earlier in the year. Just this month, it has been awarded a 40-month rig positioning and survey services contract. The services are scheduled to start at end-2014 and generate revenue of US$3.5m. In addition, Neptune has taken delivery of a newbuild dive support vessel, the Bhagwan Dryden, built in collaboration with Australian-based Bhagwan Marine. The vessel will commence a 5+3 year contract with Apache Energy. Accordingly, Neptune will provide the dive and survey equipment while Bhagwan will provide the vessel. The long-term contract is expected to contribute meaningfully in 2HFY15 and provide a baseline of income from the rental of the dive and survey equipment. Cost-wise, MTQ intends to streamline Neptune’s office locations in Perth and Singapore. Neptune has combined four of its current Perth locations into a single facility which will result in rent savings and operating efficiencies. The move will happen in Mar 2015 (beg-FY16) and we expect further margin expansion. On a last point, we note that Neptune’s sales in FY14 were propped up by an ad-hoc vessel campaign in FY14. Neptune bareboat chartered a third-party dive support vessel to carry out various scopes of subsea works such as diving, ROV and IMR services. Though revenues from a vessel campaign are undoubtedly higher, margins are crimped due to the third-party hire costs. Management does not rule out chartering in a vessel if it is able to match the charter-in period with a contract of similar length. 15 MTQ Corporation Ltd│Singapore October 27, 2014 4.5 Scaling up Binder Binder is facing a challenging FY15 due to a shortfall in activities. Management revealed that contracts for Binder tend to be rather lumpy in nature. However, MTQ is bullish on Binder’s longer-term prospects, with LNG demand in Asia set to climb ~36% from 2013 to 2020, according to energy consulting company, IHS CERA. The group sees opportunities in the Phase 3 expansion of the Singapore LNG terminal as well as further capacity expansion in Indonesia and Malaysia. We forecast a decline in Binder’s profits in FY15 but expect its fortunes to reverse in FY16 with a pick-up in activities in the region. Figure 18: SWOT analysis Strengths ▪ Experienced & strong management team ▪ Excellent M&A track record Opportunities ▪ Increasing market share in the Middle East through the greenfield Bahrain facility ▪ Neptune to ride on increased demand from Ichthys and Prelude LNG projects off Australia ▪ Positioning Binder for secular LNG demand in Asia ▪ Resilient business which is exposed to oil companies' opex ▪ Pretty financial metrices: ~10% net profit margin, ~18- ▪ M&A opportunities: we expect M&As to resume from 20% ROEs, FCF-positive & net cash by FY16 FY16 Weaknesses ▪ Small businesses in a compeititive and fragmented market ▪ Singapore operations have reached a matured stage Threats ▪ Sustained lull in oil prices ▪ Tepid growth prospects for the engine systems distribution business ▪ OEMs going in-house ▪ Softness in the drilling market ▪ Manpower crunch in Singapore SOURCES: CIMB 16 MTQ Corporation Ltd│Singapore October 27, 2014 5. FINANCIALS 5.1 FY14-17 core earnings CAGR of 14% Underpinned by improving profitability for Neptune as well as the scaling up of both the Bahrain facility and Binder, we expect MTQ to record 14% core earnings CAGR for FY14-17. Nearer term, we project MTQ’s net profits to decline by 8% yoy to S$22m in FY15 due to a softer Singapore and a shortfall in activities in Binder. We expect net profit to rebound by 29% to S$29m in FY16. Essentially, we expect earnings to accelerate in FY15-17 (2-year CAGR of 27%) after bottoming out in FY15. Our forecasts are based on the following segmental contributions: Supported by the scaling up of the Bahrain facility and Binder, we expect oilfield engineering to achieve revenue CAGR of 13% for FY14-17. We expect the Singapore operations and Premier to report steady turnover of S$90m p.a. Meanwhile, we project revenues for Bahrain to double from S$15m in FY15 to S$30m in FY17. We expect Binder to generate S$20m-30m revenue pa. We expect oilfield engineering to achieve 11% EBITDA CAGR for FY14-17. We expect EBITDA margins for oilfield engineering to expand from 21.7% in FY15 to 24.6%. We forecast Bahrain to break even in FY15 on S$15m revenues. Thereafter, we expect margins to pick up speed due to operating leverage. We also expect Binder to contribute meaningfully from FY16 onwards. On average, we expect Neptune to write S$130m-140m revenue p.a. Neptune has historically achieved S$130m-160m revenue p.a. Ad-hoc vessel campaign may push turnover to the higher end of the band. Boosted by cost reductions, we expect Neptune to achieve 14% EBITDA CAGR for FY14-17. We estimate Neptune’s EBITDA margins to widen from 10% in FY15 to 13% in FY17. We expect contributions from the Engine system to be flattish. Figure 19: Underpinned by Neptune’s improving profitability and scaling up of both Bahrain facility and Binder, we expect MTQ to record 14% core earnings CAGR for FY14-17 (S$m) (S$m) 400 40 35 350 300 30 29 24 250 25 22 200 20 15 150 15 100 50 35 10 209 313 295 321 337 FY13A FY14A FY15F FY16F FY17F - 5 - Revenue Core net profit SOURCES: CIMB, COMPANY REPORTS 17 MTQ Corporation Ltd│Singapore October 27, 2014 Figure 20: Segmental forecasts Revenue (S$m) Oilfield Engineering Engine systems Neptune Group FY13A 95 55 59 209 FY14A 105 49 160 313 FY15F 121 44 130 295 FY16F 136 45 140 321 FY17F Comments 151 47 140 337 Revenue (% yoy chg) Oilfield Engineering FY13A 28% FY14A 11% FY15F 15% FY16F 12% 1% NA -11% 171% -10% -19% 3% 8% 63% 50% -6% 9% FY17F Comments 11% We expect growth to be underpinned by scaling up of the Bahrain facility and Binder. We expect Singapore operations and Premier to write steady turnover of ~S$90m pa. Meanwhile, we project revenues for Bahrain to double from S$15m in FY15 to S$30m in FY17. We expect Binder to generate S$20-30m revenue pa 3% Expect tepid sales growth 0% On average, Neptune generates S$130-160m p.a. Ad-hoc vessel campaign may push turnover to the higher-end of the band 5% Revenue-mix(%) Oilfield Engineering Engine systems Neptune FY13A 45% 26% 28% FY14A 33% 16% 51% FY15F 41% 15% 44% FY16F 42% 14% 44% FY17F Comments 45% In terms of revenue contribution, oilfield engineering and Neptune are on equal footing 14% 42% EBITDA (S$m) Oilfield Engineering Engine systems Neptune Group FY13A 23 5 2 31 FY14A 27 4 12 43 FY15F 26 3 13 42 FY16F 32 3 15 50 FY17F 37 3 18 59 EBITDA margins (%) Oilfield Engineering FY13A 24.4% FY14A 26.1% FY15F 21.7% FY16F 23.5% FY17F Comments 24.6% We expect margins expansion from the Bahrain facility and Binder. We forecast Bahrain to breakeven in FY15 on S$15m of revenues. Thereafter, we expect margins to pick up speed on operating leverage. We also expect Binder to meaningfully contribute from FY16 onwards. 9.6% 3.7% 7.4% 7.7% 7.0% 10.0% 7.0% 11.0% Engine systems Neptune Group Engine systems Neptune 14.7% 13.8% 14.3% 15.7% 7.0% 13.0% We expect costs reduction to boost Neptune's performance. For eg, Neptune is streamlining four of its Perth offices into a single location 17.4% EBITDA (% yoy chg) Oilfield Engineering Engine systems Neptune Group FY13A 30% 10% NA 65% FY14A 18% 7% 459% 23% FY15F -4% 7% 6% -2% FY16F 22% 7% 18% 19% FY17F 16% 7% 18% 16% EBITDA-mix (%) Oilfield Engineering Engine systems Neptune FY13A 75% 17% 7% FY14A 63% 8% 28% FY15F 62% 7% 31% FY16F 63% 6% 31% FY17F 63% Oilfield engineering still contributes to around 2/3 of the group's earnings 6% 31% Group SOURCES: CIMB, COMPANY REPORTS 5.2 Margin expansion MTQ historically enjoyed healthy gross margins of 35-40% and EBITDA margins of 16-19%. Gross margins declined in FY14 to 33.1% due to a change in sales mix with the consolidation of Neptune and Binder. However, gross margins for the core Singapore operations and Premier have stayed at the 35-40% level. We expect gross margins to expand to 39.4% in FY17. We forecast Bahrain’s margins to pick up speed from FY15 due to operating leverage while Binder enjoys a turn of fortunes in FY16-17. We also expect further cost reductions from Neptune as it streamlines its operations. 18 MTQ Corporation Ltd│Singapore October 27, 2014 Figure 21: MTQ historically enjoyed healthy GM of 35-40% and 16-19% EBITDA margin; margins to expand as Bahrain and Binder scale up and Neptune cuts cost 45% 41% 40% 37% 39% 38% 36% 35% 33% 35% 30% 25% 20% 19% 16% 17% 14% 14% 15% 16% 17% 10% 5% 0% FY11A FY12A FY13A Gross margins FY14A FY15F FY16F FY17F EBITDA margins SOURCES: CIMB, COMPANY REPORTS 5.3 2QFY15 review MTQ is set to announce its 2QFY15 results on 30 Oct. We expect 2Q net profit to come in at S$5.5m-6m, flat yoy. 1QFY15 core earnings dropped 31% yoy to S$4.2m due to a softer Singapore and a quiet start for Binder. Revenue was also lower due to the absence of a vessel campaign, which had enhanced revenue in 1QFY14. 5.4 Growing earnings on positive FCF stream At end-FY14, MTQ had a net gearing of 0.2x, mainly due to increased borrowings to fund the acquisition of Neptune. However, we expect the group to quickly turn to net cash by FY16. MTQ has a highly cash-generative business. For FY11-14, it has, on average, generated operating cash flow 1.6x that of its net profit. Barring future acquisitions, we estimate that the group will incur minimal maintenance capex of S$12m p.a. This also implies that MTQ is highly FCF-generative. The point is not lost on us that most high-growth companies are propelled by similarly high expansionary capex, which translates into negative FCF. However, MTQ’s growth is one which is driven by a “back-to-basics” via improvement of the target’s performance (in this instance, Neptune and Binder) and growing market share through the organic development of the greenfield Bahrain facility. 19 MTQ Corporation Ltd│Singapore October 27, 2014 Figure 22: MTQ is growing its earnings on the back of a positive FCF stream (S$m) 30% 50 40 20% 30 20 10% 10 FY13A FY14A FY15F FY16F FY17F 0% (10) (20) -10% (30) (40) -20% (50) Operating cash flow Maintenance capex FCF Net gearing (RHS) Expansionary capex, net SOURCES: CIMB, COMPANY REPORTS 5.5 Increasing dividends MTQ has been paying increasing dividends through the years. Dividends paid have grown at a 16% CAGR for FY11-14. While the group does not have a formal dividend policy, we expect dividends paid out to be steady and sustainable. Over the past four years, the payout has ranged from 22% to 33%. We are forecasting a payout of low- to mid-20s, which translates into a forward dividend yield of 3-4%. Note that shareholders can opt to receive the dividends in scrip. Figure 23: Dividends paid has grown at 16% CAGR from FY11-14. We expect dividends to be steady and sustainable and forecast 3-4% dividend yields (S$m) 9.0 35% 33% 8.0 30% 28% 7.0 25% 25% 6.0 25% 24% 23% 21% 5.0 20% 4.0 15% 3.0 10% 2.0 1.0 3.5 3.6 4.3 FY11A FY12A FY13A 5.6 5.6 6.9 7.6 FY16F FY17F 0.0 5% 0% FY14A Gross dividend declared FY15F Payout ratio (RHS) SOURCES: CIMB, COMPANY REPORTS 20 MTQ Corporation Ltd│Singapore October 27, 2014 6. VALUATION AND RECOMMENDATION 6.1 CY15 EV/EBITDA at 40% discount to peers On the back of softer 1QFY15 results and oil price jitters, the stock has fallen by some 30% since end-Jul. In terms of EV/EBITDA, MTQ is trading at 3.9x CY15 vs. peers’ average of 6.3x (~40% discount). In terms of price multiples, the stock is trading at 6.8x CY15 P/E and 1.3x CY14 P/BV. Meanwhile, its oil equipment peers, excluding Keppel-backed Dyna-Mac and KS Energy, are trading at a similar valuation of 6.5x CY15 P/E. We observed that some of MTQ’s peers have similarly diversified from their core oilfield equipment business. For example, Baker Technology, which supplies jack-up legs, has branched into the fabrication of liftboats. KS Energy, which is a diversified supplier of equipment and components for the offshore industry, has refocused its efforts on its drilling rig division in recent years. Others like Viking Offshore and Mencast have horizontally diversified in a bid to become integrated one-stop service providers of oilfield equipment. Viking Offshore is also taking equity stakes in newbuild jack-up rigs. Figure 24: Singapore's listed oilfield-equipment service providers Company Baker Technology Service offerings ▪ Supplies deck equipment such as offshore pedestal cranes & anchor winches. ▪ Core competency lies in the supply of jack-up legs ▪ Turnkey project management of FPSO topside modules construction ▪ Fabricates compressors & topside processing equipment ▪ Main business lies in construction & maintenance of downstream plants in Jurong Island, Singapore Dyna-Mac Hiap Seng Engineering ▪ Fabricates works of sections or components of drilling rigs & drillships ▪ Installs offshore production modules and systems ▪ Does afloat repairs, maintenance and refurbishment of offshore rigs, platforms & vessels ▪ Integrated one-stop oilfield equipment service provider ▪ Supplies a wide-variety of equipment including instrumentation and process flow equipment, consumable products, carbon and stainless steel pipes & structural steel plates ▪ Has re-focused its efforts on its drilling division in recent years ▪ Complete MRO (Maintenance, Repair & Overhaul) solutions provider for the offshore & maritime sector ▪ Established leader in the manufacture and repair of propellers and sterngear equipment ▪ Has augmented its core competency with horizontal-acquisitions along the productchain, making 8 acquisitions since its IPO in 2008 ▪ Automation systems integration solutions provider for offshore vessels ▪ Design and fabrication of process modules and equipment for offshore platforms & FPSOs ▪ Provider of heating, ventilation and air-conditioning systems as well as refrigeration systems (key pillar for the group), hydraulic winches & power packs as well as telecommunication systems ▪ Vertical diversification through investment in newbuild jack-up rigs ▪ Diesel engine, propulsion and power generating solutions provider for the offshore & marine sector Kim Heng Offshore & Marine KS Energy Mencast Nordic group Technics Oil & Gas Viking Offshore XMH SOURCES: CIMB, COMPANY REPORTS Figure 25: Peers Comparison Company Bloomberg Ticker Dyna-Mac Holdings Ltd DMHL SP Kim Heng Offshore & Marine Hol KHOM SP KS Energy Ltd KST SP Mencast Holdings Ltd MCAST SP MTQ Corporation Ltd MTQ SP All simple average (ex. MTQ) Recom. Price (lcl curr) Target Price (lcl curr) Market Cap (US$ m) NR NR NR NR Add 0.39 0.21 0.45 0.44 1.20 na na na na 1.56 300 114 185 123 143 FD Core P/E (x) 2-year EPS CY2014 CY2015 CAGR (%) 13.3 7.6 na 8.3 8.1 9.7 9.4 6.4 40.9 6.5 6.8 15.8 21.0% 1.6% 1429.8% 18.9% 7.6% 367.8% P/BV (x) CY2014 Recurring ROE (%) CY2014 Dividend Yield (%) CY2014 1.93 1.32 na na 1.28 1.62 15.4% 21.0% 13.8% 17.6% 16.9% 16.9% 5.2% 2.4% na 3.6% 3.0% 3.8% SOURCES: CIMB, COMPANY REPORTS, BLOOMBERG 21 MTQ Corporation Ltd│Singapore October 27, 2014 6.2 Initiate with Add and target price of S$1.56 We initiate coverage with an Add rating and a target price of S$1.56, based on a blend of 7x CY16 P/E and 1.5x CY15 P/BV. Since the entry of a capable and experienced management team in FY11, MTQ has achieved 31% core earnings CAGR for FY11-14. Growth has been propelled by a series of earnings- and value-accretive acquisitions over the last three years. For example, MTQ acquired the Premier group at 3.5x trailing P/E and acquired Neptune at 1x P/NTA. While the businesses of MTQ are relatively small and compete in a very fragmented industry, the group enjoys healthy gross margins of 35-40% and EBITDA margins of 16-19%. The business is also highly cash-generative. For FY11-14, its operating cash flow was, on average, 1.6x net profit. Hence, we expect the group to turn to net cash by FY16 (from net gearing of 0.2x in FY14). Meanwhile, we forecast MTQ to achieve 14% core earnings CAGR for FY14-17 as it consolidates its acquired businesses. Further accretive-acquisitions in the mid-term could drive earnings and value. For now, we expect growth to be underpinned by improving profitability from Neptune as well as the scaling up of both the Bahrain facility and Binder. Backed by a solid management team and organic growth on a stream of positive FCF, investors can now Add MTQ at 3.7x CY15 EV/EBITDA, 40% discount to peers’ average of 6.3x. On a P/BV basis, the stock also looks undervalued, at 1.3x CY14 P/BV vs. a forward ROE of 18%, while offering a forward dividend yield of 3-4%. We envision the stock to potentially reach S$500m market cap in the years to come and believe that this is one for small-cap specialist funds. Potential catalysts include stronger-than-expected earnings and accretive-acquisitions. Figure 26: Blended P/E & P/BV valuation Method Per share items (S cts) Multiple Share Justification peg price (S$) FD CY16 P/E FD CY15 P/BV 22.15 103.99 7.0 1.5 1.55 1.56 Average Implied CY16 P/E (x) Implied CY15 P/BV (x) 1 s.d above its 5-year mean of 6x Justified P/BV multiple based on forward ROE of 18% 1.56 7.0 1.5 SOURCES: CIMB Figure 27: MTQ’s 12-month rolling forward P/E Figure 28: MTQ’s rolling P/BV 2.1 Title: 13.0 Source: 12.0 1.9 Please fill in the values above to have them entered in your report 11.0 1.7 10.0 9.0 1.5 8.0 +1SD: 7.1x 7.0 1.3 (B$2250:$B$2333) 6.0 #VALUE! 1.1 +1SD: 7.1x 5-yr Ave (09-13): 5.8x +1SD: 1.3x 5-yr Ave (09-13): 1.1x 5.0 3.0 Jan 09 Jan 10 Jan 11 -1SD: 0.9x 0.9 -1SD: 4.6x 4.0 Jan 12 Jan 13 0.7 Jan 09 Jan 14 12-mth Fwd Rolling FD Core P/E (x) Jan 10 Jan 11 Jan 12 Jan 13 Jan 14 Rolling P/BV (x) SOURCES: CIMB, BLOOMBERG 22 SOURCES: CIMB, BLOOMBERG MTQ Corporation Ltd│Singapore October 27, 2014 Lastly, we cross-check our primary valuation methodology (blended P/E & P/BV) with a sum-of-parts (SOP) approach, valuing MTQ’s distinct divisions separately. We use DCF (WACC: 9.5%, LTG: 2%) to value the highly cash-generative oilfield engineering business. We simply peg Neptune at its market value while using book value for the engine systems business. The intrinsic-valuation approach suggests that the highly cash-generative oilfield engineering business is very much under-appreciated and that the market has also priced in a wide discount for Neptune. Figure 29: SOP valuation shows that the oilfield engineering business is very much under-appreciated and the market has priced in a wide discount for Neptune Business division Oilfield Engineering 86.8% owned-Neptune Engine system MTQ group Equity valuation (S$m) 215.0 85.2 24.4 324.6 Equity (S$/share) 1.41 0.56 0.16 2.13 Valuation method DCF Market value Book value SOURCES: CIMB, COMPANY REPORTS Figure 30: DCF of oilfield engineering EBITDA less tax Add depn shield less investment in fixed capital less net increase in working capital FCFF PV of FCFF Terminal value EV less debt Equity value no. of shares (m) Equity valuation of Oilfield engineering business 2015 27.3 4.9 1.2 8.2 1.4 14.0 64.9 164.6 229.6 14.6 215.0 152.4 1.41 2016 31.4 5.7 1.4 9.4 1.6 16.2 2017 34.5 6.2 1.6 10.4 1.7 17.8 2018 36.2 6.5 1.6 10.9 1.8 18.7 2019 37.0 6.7 1.7 11.1 1.8 19.0 Assumptions LTG: 2% Discount rate: 9.5% SOURCES: CIMB 23 MTQ Corporation Ltd│Singapore October 27, 2014 7. RISKS 7.1 Lower oil price environment A sustained drop in oil prices would slow down oil companies’ E&P programme. In turn, rig operators could attempt to delay periodic maintenance cycles and push back discretionary maintenance, adversely affecting MTQ. 7.2 Softer jack-up market The global jack-up market is anticipated to be somewhat softer come 2015-16, with ~150 deliveries anticipated through 2017, forming ~30% of the global rig count. Around 63 jack-ups are due to be delivered in 2015 and another 47 for 2016. A drop in utilisation would impact MTQ’s repair activities as requirements for regular repairs would dissipate. One mitigating factor is that half of these newbuilds are built from Chinese yards and there could be some delivery delays, hence, potentially avoiding a severe oversupplied situation. 7.3 OEMs going in-house Several of the major OEMs have expanded their presence in Southeast Asia and are going in-house. This could adversely affect MTQ’s Singapore operations. For example, US-based oilfield equipment giants such as Halliburton and Cameron have completed their plans to develop its own after-market facility in Singapore to better service its customers. Meanwhile, another US-based oilfield equipment giant, FMC Technologies has shifted part of its operations from Singapore to Kuala Lumpur, Malaysia. To remain relevant, the company is dedicated to offering a customised and personalised service proposition to these multinational OEMs. 7.4 Acquisition risks MTQ’s growth in the last three years has been underpinned by earnings- and value-accretive acquisitions. However, a misjudged acquisition could easily wipe out its profits. Failure to integrate could also crush some of the synergies the company expects when it makes the deal. 7.5 Manpower crunch Retaining and developing manpower is a perennial issue facing all companies, but particularly in the manufacturing sector in which MTQ operates. The restriction of growth of foreign workers in Singapore has curtailed growth opportunities as the group faces a manpower crunch. To mitigate this, the company has invested in new equipment to boost productivity and also ensured that it is able to successfully retain existing staff and attract new employees. Though manpower in Singapore has remained stagnant, the company has managed to grow revenue. In Bahrain, MTQ has grown its staff strength to 130. It faces the challenge of recruiting adequate supervisory staff and developing the local team so that they can maximise the output of the facility. For now, the company is augmenting the local team with overseas recruitment for experienced and managerial positions. 24 MTQ Corporation Ltd│Singapore October 27, 2014 #01 DISCLAIMER This report is not directed to, or intended for distribution to or use by, any person or entity who is a citizen or resident of or located in any locality, state, country or other jurisdiction where such distribution, publication, availability or use would be contrary to law or regulation. By accepting this report, the recipient hereof represents and warrants that he is entitled to receive such report in accordance with the restrictions set forth below and agrees to be bound by the limitations contained herein (including the “Restrictions on Distributions” set out below). Any failure to comply with these limitations may constitute a violation of law. This publication is being supplied to you strictly on the basis that it will remain confidential. No part of this report may be (i) copied, photocopied, duplicated, stored or reproduced in any form by any means or (ii) redistributed or passed on, directly or indirectly, to any other person in whole or in part, for any purpose without the prior written consent of CIMB. Unless otherwise specified, this report is based upon sources which CIMB considers to be reasonable. Such sources will, unless otherwise specified, for market data, be market data and prices available from the main stock exchange or market where the relevant security is listed, or, where appropriate, any other market. Information on the accounts and business of company(ies) will generally be based on published statements of the company(ies), information disseminated by regulatory information services, other publicly available information and information resulting from our research. Whilst every effort is made to ensure that statements of facts made in this report are accurate, all estimates, projections, forecasts, expressions of opinion and other subjective judgments contained in this report are based on assumptions considered to be reasonable as of the date of the document in which they are contained and must not be construed as a representation that the matters referred to therein will occur. Past performance is not a reliable indicator of future performance. The value of investments may go down as well as up and those investing may, depending on the investments in question, lose more than the initial investment. No report shall constitute an offer or an invitation by or on behalf of CIMB or its affiliates to any person to buy or sell any investments. CIMB, its affiliates and related companies, their directors, associates, connected parties and/or employees may own or have positions in securities of the company(ies) covered in this research report or any securities related thereto and may from time to time add to or dispose of, or may be materially interested in, any such securities. Further, CIMB, its affiliates and its related companies do and seek to do business with the company(ies) covered in this research report and may from time to time act as market maker or have assumed an underwriting commitment in securities of such company(ies), may sell them to or buy them from customers on a principal basis and may also perform or seek to perform significant investment banking, advisory, underwriting or placement services for or relating to such company(ies) as well as solicit such investment, advisory or other services from any entity mentioned in this report. CIMB or its affiliates may enter into an agreement with the company(ies) covered in this report relating to the production of research reports. CIMB may disclose the contents of this report to the company(ies) covered by it and may have amended the contents of this report following such disclosure. The analyst responsible for the production of this report hereby certifies that the views expressed herein accurately and exclusively reflect his or her personal views and opinions about any and all of the issuers or securities analysed in this report and were prepared independently and autonomously. No part of the compensation of the analyst(s) was, is, or will be directly or indirectly related to the inclusion of specific recommendations(s) or view(s) in this report. CIMB prohibits the analyst(s) who prepared this research report from receiving any compensation, incentive or bonus based on specific investment banking transactions or for providing a specific recommendation for, or view of, a particular company. Information barriers and other arrangements may be established where necessary to prevent conflicts of interests arising. However, the analyst(s) may receive compensation that is based on his/their coverage of company(ies) in the performance of his/their duties or the performance of his/their recommendations and the research personnel involved in the preparation of this report may also participate in the solicitation of the businesses as described above. In reviewing this research report, an investor should be aware that any or all of the foregoing, among other things, may give rise to real or potential conflicts of interest. Additional information is, subject to the duties of confidentiality, available on request. Reports relating to a specific geographical area are produced by the corresponding CIMB entity as listed in the table below. The term “CIMB” shall denote, where appropriate, the relevant entity distributing or disseminating the report in the particular jurisdiction referenced below, or, in every other case, CIMB Group Holdings Berhad ("CIMBGH") and its affiliates, subsidiaries and related companies. Country Australia Hong Kong Indonesia India Malaysia Singapore South Korea Taiwan Thailand CIMB Entity CIMB Securities (Australia) Limited CIMB Securities Limited PT CIMB Securities Indonesia CIMB Securities (India) Private Limited CIMB Investment Bank Berhad CIMB Research Pte. Ltd. CIMB Securities Limited, Korea Branch CIMB Securities Limited, Taiwan Branch CIMB Securities (Thailand) Co. Ltd. Regulated by Australian Securities & Investments Commission Securities and Futures Commission Hong Kong Financial Services Authority of Indonesia Securities and Exchange Board of India (SEBI) Securities Commission Malaysia Monetary Authority of Singapore Financial Services Commission and Financial Supervisory Service Financial Supervisory Commission Securities and Exchange Commission Thailand (i) As of October 27, 2014 CIMB has a proprietary position in the securities (which may include but not limited to shares, warrants, call warrants and/or any other derivatives) in the following company or companies covered or recommended in this report: (a) ASL Marine, Bumi Armada, Daewoo Shipbuilding & Marine, Ezion Holdings, Ezra Holdings, Hyundai Heavy Industries, Hyundai Mipo Dockyard, Keppel Corporation, Malaysia Marine & Heavy Eng, Nam Cheong, Perisai Petroleum, Samsung Heavy Industries, SapuraKencana Petroleum, Sembcorp Industries, Sembcorp Marine, SIA Engineering, UMW Oil & Gas, Yangzijiang Shipbuilding (ii) As of October 27, 2014, the analyst(s) who prepared this report, has / have an interest in the securities (which may include but not limited to shares, warrants, call warrants and/or any other derivatives) in the following company or companies covered or recommended in this report: (a) 25 MTQ Corporation Ltd│Singapore October 27, 2014 The information contained in this research report is prepared from data believed to be correct and reliable at the time of issue of this report. CIMB may or may not issue regular reports on the subject matter of this report at any frequency and may cease to do so or change the periodicity of reports at any time. CIMB is under no obligation to update this report in the event of a material change to the information contained in this report. This report does not purport to contain all the information that a prospective investor may require. CIMB or any of its affiliates does not make any guarantee, representation or warranty, express or implied, as to the adequacy, accuracy, completeness, reliability or fairness of any such information and opinion contained in this report. Neither CIMB nor any of its affiliates nor its related persons shall be liable in any manner whatsoever for any consequences (including but not limited to any direct, indirect or consequential losses, loss of profits and damages) of any reliance thereon or usage thereof. This report is general in nature and has been prepared for information purposes only. It is intended for circulation amongst CIMB and its affiliates’ clients generally and does not have regard to the specific investment objectives, financial situation and the particular needs of any specific person who may receive this report. The information and opinions in this report are not and should not be construed or considered as an offer, recommendation or solicitation to buy or sell the subject securities, related investments or other financial instruments thereof. Investors are advised to make their own independent evaluation of the information contained in this research report, consider their own individual investment objectives, financial situation and particular needs and consult their own professional and financial advisers as to the legal, business, financial, tax and other aspects before participating in any transaction in respect of the securities of company(ies) covered in this research report. The securities of such company(ies) may not be eligible for sale in all jurisdictions or to all categories of investors. Australia: Despite anything in this report to the contrary, this research is provided in Australia by CIMB Securities (Australia) Limited (“CSAL”) (ABN 84 002 768 701, AFS Licence number 240 530). CSAL is a Market Participant of ASX Ltd, a Clearing Participant of ASX Clear Pty Ltd, a Settlement Participant of ASX Settlement Pty Ltd, and, a participant of Chi X Australia Pty Ltd. This research is only available in Australia to persons who are “wholesale clients” (within the meaning of the Corporations Act 2001 (Cth)) and is supplied solely for the use of such wholesale clients and shall not be distributed or passed on to any other person. This research has been prepared without taking into account the objectives, financial situation or needs of the individual recipient. France: Only qualified investors within the meaning of French law shall have access to this report. This report shall not be considered as an offer to subscribe to, or used in connection with, any offer for subscription or sale or marketing or direct or indirect distribution of financial instruments and it is not intended as a solicitation for the purchase of any financial instrument. Hong Kong: This report is issued and distributed in Hong Kong by CIMB Securities Limited (“CHK”) which is licensed in Hong Kong by the Securities and Futures Commission for Type 1 (dealing in securities), Type 4 (advising on securities) and Type 6 (advising on corporate finance) activities. Any investors wishing to purchase or otherwise deal in the securities covered in this report should contact the Head of Sales at CIMB Securities Limited. The views and opinions in this research report are our own as of the date hereof and are subject to change. If the Financial Services and Markets Act of the United Kingdom or the rules of the Financial Conduct Authority apply to a recipient, our obligations owed to such recipient therein are unaffected. CHK has no obligation to update its opinion or the information in this research report. This publication is strictly confidential and is for private circulation only to clients of CHK. This publication is being supplied to you strictly on the basis that it will remain confidential. No part of this material may be (i) copied, photocopied, duplicated, stored or reproduced in any form by any means or (ii) redistributed or passed on, directly or indirectly, to any other person in whole or in part, for any purpose without the prior written consent of CHK. Unless permitted to do so by the securities laws of Hong Kong, no person may issue or have in its possession for the purposes of issue, whether in Hong Kong or elsewhere, any advertisement, invitation or document relating to the securities covered in this report, which is directed at, or the contents of which are likely to be accessed or read by, the public in Hong Kong (except if permitted to do so under the securities laws of Hong Kong). India: This report is issued and distributed in India by CIMB Securities (India) Private Limited (“CIMB India”) which is registered with SEBI as a stock-broker under the Securities and Exchange Board of India (Stock Brokers and Sub-Brokers) Regulations, 1992 and in accordance with the provisions of Regulation 4 (g) of the Securities and Exchange Board of India (Investment Advisers) Regulations, 2013, CIMB India is not required to seek registration with SEBI as an Investment Adviser. The research analysts, strategists or economists principally responsible for the preparation of this research report are segregated from the other activities of CIMB India and they have received compensation based upon various factors, including quality, accuracy and value of research, firm profitability or revenues, client feedback and competitive factors. Research analysts', strategists' or economists' compensation is not linked to investment banking or capital markets transactions performed or proposed to be performed by CIMB India or its affiliates. Indonesia: This report is issued and distributed by PT CIMB Securities Indonesia (“CIMBI”). The views and opinions in this research report are our own as of the date hereof and are subject to change. If the Financial Services and Markets Act of the United Kingdom or the rules of the Financial Conduct Authority apply to a recipient, our obligations owed to such recipient therein are unaffected. CIMBI has no obligation to update its opinion or the information in this research report. This publication is strictly confidential and is for private circulation only to clients of CIMBI. This publication is being supplied to you strictly on the basis that it will remain confidential. No part of this material may be (i) copied, photocopied, duplicated, stored or reproduced in any form by any means or (ii) redistributed or passed on, directly or indirectly, to any other person in whole or in part, for any purpose without the prior written consent of CIMBI. Neither this report nor any copy hereof may be distributed in Indonesia or to any Indonesian citizens wherever they are domiciled or to Indonesia residents except in compliance with applicable Indonesian capital market laws and regulations. Malaysia: This report is issued and distributed by CIMB Investment Bank Berhad (“CIMB”). The views and opinions in this research report are our own as of the date hereof and are subject to change. If the Financial Services and Markets Act of the United Kingdom or the rules of the Financial Conduct Authority apply to a recipient, our obligations owed to such recipient therein are unaffected. CIMB has no obligation to update its opinion or the information in this research report. This publication is strictly confidential and is for private circulation only to clients of CIMB. This publication is being supplied to you strictly on the basis that it will remain confidential. No part of this material may be (i) copied, photocopied, duplicated, stored or reproduced in any form by any 26 MTQ Corporation Ltd│Singapore October 27, 2014 means or (ii) redistributed or passed on, directly or indirectly, to any other person in whole or in part, for any purpose without the prior written consent of CIMB. New Zealand: In New Zealand, this report is for distribution only to persons whose principal business is the investment of money or who, in the course of, and for the purposes of their business, habitually invest money pursuant to Section 3(2)(a)(ii) of the Securities Act 1978. Singapore: This report is issued and distributed by CIMB Research Pte Ltd (“CIMBR”). Recipients of this report are to contact CIMBR in Singapore in respect of any matters arising from, or in connection with, this report. The views and opinions in this research report are our own as of the date hereof and are subject to change. If the Financial Services and Markets Act of the United Kingdom or the rules of the Financial Conduct Authority apply to a recipient, our obligations owed to such recipient therein are unaffected. CIMBR has no obligation to update its opinion or the information in this research report. This publication is strictly confidential and is for private circulation only. If the recipient of this research report is not an accredited investor, expert investor or institutional investor, CIMBR accepts legal responsibility for the contents of the report without any disclaimer limiting or otherwise curtailing such legal responsibility. This publication is being supplied to you strictly on the basis that it will remain confidential. No part of this material may be (i) copied, photocopied, duplicated, stored or reproduced in any form by any means or (ii) redistributed or passed on, directly or indirectly, to any other person in whole or in part, for any purpose without the prior written consent of CIMBR. As of October 27, 2014, CIMBR does not have a proprietary position in the recommended securities in this report. South Korea: This report is issued and distributed in South Korea by CIMB Securities Limited, Korea Branch ("CIMB Korea") which is licensed as a cash equity broker, and regulated by the Financial Services Commission and Financial Supervisory Service of Korea. The views and opinions in this research report are our own as of the date hereof and are subject to change, and this report shall not be considered as an offer to subscribe to, or used in connection with, any offer for subscription or sale or marketing or direct or indirect distribution of financial investment instruments and it is not intended as a solicitation for the purchase of any financial investment instrument. This publication is strictly confidential and is for private circulation only, and no part of this material may be (i) copied, photocopied, duplicated, stored or reproduced in any form by any means or (ii) redistributed or passed on, directly or indirectly, to any other person in whole or in part, for any purpose without the prior written consent of CIMB Korea. Sweden: This report contains only marketing information and has not been approved by the Swedish Financial Supervisory Authority. The distribution of this report is not an offer to sell to any person in Sweden or a solicitation to any person in Sweden to buy any instruments described herein and may not be forwarded to the public in Sweden. Taiwan: This research report is not an offer or marketing of foreign securities in Taiwan. The securities as referred to in this research report have not been and will not be registered with the Financial Supervisory Commission of the Republic of China pursuant to relevant securities laws and regulations and may not be offered or sold within the Republic of China through a public offering or in circumstances which constitutes an offer or a placement within the meaning of the Securities and Exchange Law of the Republic of China that requires a registration or approval of the Financial Supervisory Commission of the Republic of China. Thailand: This report is issued and distributed by CIMB Securities (Thailand) Company Limited (CIMBS). The views and opinions in this research report are our own as of the date hereof and are subject to change. If the Financial Services and Markets Act of the United Kingdom or the rules of the Financial Conduct Authority apply to a recipient, our obligations owed to such recipient therein are unaffected. CIMBS has no obligation to update its opinion or the information in this research report. This publication is strictly confidential and is for private circulation only to clients of CIMBS. This publication is being supplied to you strictly on the basis that it will remain confidential. No part of this material may be (i) copied, photocopied, duplicated, stored or reproduced in any form by any means or (ii) redistributed or passed on, directly or indirectly, to any other person in whole or in part, for any purpose without the prior written consent of CIMBS. CIMB Securities (Thailand) Co., Ltd. may act or acts as Market Maker and issuer including offering of Derivative Warrants Underlying securities of the following securities. Investors should carefully read and study the details of the derivative warrants in the prospectus before making investment decisions. AAV, ADVANC, AMATA, ANAN, AOT, AP, ASP, BANPU, BAY, BBL, BCH, BCP, BEC, BECL, BGH, BH, BIGC, BJC, BJCHI, BLA, BLAND, BMCL, BTS, CENTEL, CK, CPALL, CPF, CPN, DCC, DELTA, DEMCO, DTAC, EARTH, EGCO, ERW, ESSO, GFPT, GLOBAL, GLOW, GUNKUL, HEMRAJ, HMPRO, INTUCH, IRPC, ITD, IVL, JAS, KBANK, KCE, KKP, KTB, KTC, LH, LOXLEY, LPN, M, MAJOR, MC, MCOT, MEGA, MINT, NOK, NYT, PS, PSL, PTT, PTTEP, PTTGC, QH, RATCH, ROBINS, RS, SAMART, SCB, SCC, SCCC, SIRI, SPALI, SPCG, SRICHA, STA, STEC, STPI, SVI, TASCO, TCAP, TFD, THAI, THCOM, THRE, THREL, TICON, TISCO, TMB, TOP, TPIPL, TTA, TTCL, TTW, TUF, UMI, UV, VGI, TRUE, WHA. Corporate Governance Report: The disclosure of the survey result of the Thai Institute of Directors Association (“IOD”) regarding corporate governance is made pursuant to the policy of the Office of the Securities and Exchange Commission. The survey of the IOD is based on the information of a company listed on the Stock Exchange of Thailand and the Market for Alternative Investment disclosed to the public and able to be accessed by a general public investor. The result, therefore, is from the perspective of a third party. It is not an evaluation of operation and is not based on inside information. The survey result is as of the date appearing in the Corporate Governance Report of Thai Listed Companies. As a result, the survey result may be changed after that date. CIMBS does not confirm nor certify the accuracy of such survey result. Score Range: Description: 90 - 100 Excellent 80 - 89 Very Good 70 - 79 Good Below 70 or N/A No Survey Result United Arab Emirates: The distributor of this report has not been approved or licensed by the UAE Central Bank or any other relevant licensing authorities or governmental agencies in the United Arab Emirates. This report is strictly private and confidential and has not been reviewed by, deposited or registered with UAE Central Bank or any other licensing authority or governmental agencies in the United Arab Emirates. This report 27 MTQ Corporation Ltd│Singapore October 27, 2014 is being issued outside the United Arab Emirates to a limited number of institutional investors and must not be provided to any person other than the original recipient and may not be reproduced or used for any other purpose. Further, the information contained in this report is not intended to lead to the sale of investments under any subscription agreement or the conclusion of any other contract of whatsoever nature within the territory of the United Arab Emirates. United Kingdom and Europe: In the United Kingdom and European Economic Area, this report is being disseminated by CIMB Securities (UK) Limited (“CIMB UK”). CIMB UK is authorised and regulated by the Financial Conduct Authority and its registered office is at 27 Knightsbridge, London, SW1X 7YB. This report is for distribution only to, and is solely directed at, selected persons on the basis that those persons: (a) are persons that are eligible counterparties and professional clients of CIMB UK; (b) have professional experience in matters relating to investments falling within Article 19(5) of the Financial Services and Markets Act 2000 (Financial Promotion) Order 2005 (as amended, the “Order”); (c) are persons falling within Article 49 (2) (a) to (d) (“high net worth companies, unincorporated associations etc”) of the Order; (d) are outside the United Kingdom; or (e) are persons to whom an invitation or inducement to engage in investment activity (within the meaning of section 21 of the Financial Services and Markets Act 2000) in connection with any investments to which this report relates may otherwise lawfully be communicated or caused to be communicated (all such persons together being referred to as “relevant persons”). This report is directed only at relevant persons and must not be acted on or relied on by persons who are not relevant persons. Any investment or investment activity to which this report relates is available only to relevant persons and will be engaged in only with relevant persons. Only where this report is labelled as non-independent, it does not provide an impartial or objective assessment of the subject matter and does not constitute independent "investment research" under the applicable rules of the Financial Conduct Authority in the UK. Consequently, any such non-independent report will not have been prepared in accordance with legal requirements designed to promote the independence of investment research and will not subject to any prohibition on dealing ahead of the dissemination of investment research. United States: This research report is distributed in the United States of America by CIMB Securities (USA) Inc, a U.S.-registered broker-dealer and a related company of CIMB Research Pte Ltd, CIMB Investment Bank Berhad, PT CIMB Securities Indonesia, CIMB Securities (Thailand) Co. Ltd, CIMB Securities Limited, CIMB Securities (Australia) Limited, CIMB Securities (India) Private Limited, and is distributed solely to persons who qualify as "U.S. Institutional Investors" as defined in Rule 15a-6 under the Securities and Exchange Act of 1934. This communication is only for Institutional Investors whose ordinary business activities involve investing in shares, bonds and associated securities and/or derivative securities and who have professional experience in such investments. Any person who is not a U.S. Institutional Investor or Major Institutional Investor must not rely on this communication. The delivery of this research report to any person in the United States of America is not a recommendation to effect any transactions in the securities discussed herein, or an endorsement of any opinion expressed herein. CIMB Securities (USA) Inc, is a FINRA/SIPC member and takes responsibility for the content of this report. For further information or to place an order in any of the above-mentioned securities please contact a registered representative of CIMB Securities (USA) Inc. Other jurisdictions: In any other jurisdictions, except if otherwise restricted by laws or regulations, this report is only for distribution to professional, institutional or sophisticated investors as defined in the laws and regulations of such jurisdictions. Distribution of stock ratings and investment banking clients for quarter ended on 30 September 2014 1552 companies under coverage for quarter ended on 30 September 2014 Rating Distribution (%) Investment Banking clients (%) Add 54.9% 5.0% Hold 29.5% 2.3% Reduce 15.6% 1.0% Spitzer Chart for stock being researched ( 2 year data ) MTQ Corporation Ltd (MTQ SP) Price Close 2.00 1.80 1.60 1.40 1.20 1.00 0.80 0.60 0.40 Oct-12 Feb-13 Jul-13 Nov-13 tzerKR_KRSpitzer 28 Mar-14 Jul-14 MTQ Corporation Ltd│Singapore October 27, 2014 Corporate Governance Report of Thai Listed Companies (CGR). CG Rating by the Thai Institute of Directors Association (IOD) in 2013. AAV - Good, ADVANC - Excellent, AMATA - Very Good, ANAN – Good, AOT - Excellent, AP - Very Good, BANPU - Excellent , BAY - Excellent , BBL Excellent, BCH – Good, BCP - Excellent, BEAUTY – Good, BEC - Very Good, BECL - Excellent, BGH - not available, BH - Very Good, BIGC - Very Good, BJC – Very Good, BMCL - Very Good, BTS - Excellent, CCET – Very Good, CENTEL – Very Good, CHG – not available, CK - Excellent, CPALL - Very Good, CPF - Excellent, CPN - Excellent, DELTA - Very Good, DTAC - Excellent, EA - Good, EGCO - Excellent, GFPT - Very Good, GLOBAL - Good, GLOW - Very Good, GRAMMY - Excellent, HANA - Excellent, HEMRAJ - Excellent, HMPRO - Very Good, ICHI - not available, INTUCH - Excellent, ITD – Very Good, IVL Excellent, JAS – Very Good, KAMART – not available, KBANK - Excellent, KCE - Very Good, KKP – Excellent, KTB - Excellent, LH - Very Good, LPN Excellent, M - not available, MAJOR - Very Good, MAKRO – Very Good, MC - not available, MCOT - Excellent, MEGA – not available, MINT - Excellent, OFM – Very Good, PS - Excellent, PSL - Excellent, PTT - Excellent, PTTGC - Excellent, PTTEP - Excellent, QH - Excellent, RATCH - Excellent, ROBINS - Excellent, RS - Excellent, SAMART - Excellent, SAPPE - not available, SC – Excellent, SCB - Excellent, SCC - Excellent, SCCC - Very Good, SIM - Excellent, SIRI - Very Good, SPALI - Excellent, STA - Good, STEC - Very Good, SVI – Excellent, TASCO – Very Good, TCAP - Excellent, THAI - Excellent, THCOM – Excellent, TICON – Very Good, TISCO - Excellent, TMB - Excellent, TOP - Excellent, TRUE - Excellent, TTW - Excellent, TUF - Very Good, VGI – Excellent, WORK – Good. CIMB Recommendation Framework Stock Ratings Definition: Add The stock’s total return is expected to exceed 10% over the next 12 months. Hold The stock’s total return is expected to be between 0% and positive 10% over the next 12 months. Reduce The stock’s total return is expected to fall below 0% or more over the next 12 months. The total expected return of a stock is defined as the sum of the: (i) percentage difference between the target price and the current price and (ii) the forward net dividend yields of the stock. Stock price targets have an investment horizon of 12 months. Sector Ratings Overweight Neutral Underweight Definition: An Overweight rating means stocks in the sector have, on a market cap-weighted basis, a positive absolute recommendation. A Neutral rating means stocks in the sector have, on a market cap-weighted basis, a neutral absolute recommendation. An Underweight rating means stocks in the sector have, on a market cap-weighted basis, a negative absolute recommendation. Country Ratings Overweight Neutral Underweight Definition: An Overweight rating means investors should be positioned with an above-market weight in this country relative to benchmark. A Neutral rating means investors should be positioned with a neutral weight in this country relative to benchmark. An Underweight rating means investors should be positioned with a below-market weight in this country relative to benchmark. *Prior to December 2013 CIMB recommendation framework for stocks listed on the Singapore Stock Exchange, Bursa Malaysia, Stock Exchange of Thailand, Jakarta Stock Exchange, Australian Securities Exchange, Taiwan Stock Exchange and National Stock Exchange of India/Bombay Stock Exchange were based on a stock’s total return relative to the relevant benchmarks total return. Outperform: expected to exceed by 5% or more over the next 12 months. Neutral: expected to be within +/-5% over the next 12 months. Underperform: expected to be below by 5% or more over the next 12 months. Trading Buy: expected to exceed by 3% or more over the next 3 months. Trading Sell: expected to be below by 3% or more over the next 3 months. For stocks listed on Korea Exchange, Hong Kong Stock Exchange and China listings on the Singapore Stock Exchange. Outperform: Expected positive total returns of 10% or more over the next 12 months. Neutral: Expected total returns of between -10% and +10% over the next 12 months. Underperform: Expected negative total returns of 10% or more over the next 12 months. Trading Buy: Expected positive total returns of 10% or more over the next 3 months. Trading Sell: Expected negative total returns of 10% or more over the next 3 months. 29
© Copyright 2026 ExpyDoc