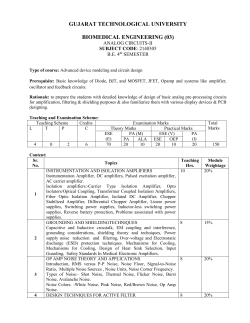
Speech Denoising via Low-Rank and Sparse Matrix Decomposition Jianjun Huang, Xiongwei Zhang, Yafei Zhang, Xia Zou, and Li Zeng In this letter, we propose an unsupervised framework for speech noise reduction based on the recent development of low-rank and sparse matrix decomposition. The proposed framework directly separates the speech signal from noisy speech by decomposing the noisy speech spectrogram into three submatrices: the noise structure matrix, the clean speech structure matrix, and the residual noise matrix. Evaluations on the Noisex-92 dataset show that the proposed method achieves a signal-to-distortion ratio approximately 2.48 dB and 3.23 dB higher than that of the robust principal component analysis method and the non-negative matrix factorization method, respectively, when the input SNR is –5 dB. Keywords: Low-rank and sparse matrix decomposition, noise reduction, robust principal component analysis. component analysis [2], non-negative matrix factorization (NMF) [3]-[5], and K-SVD [6]. However, these always require particular features or prior training for supervised separation. In this letter, we propose separating the speech signal from the noisy speech in an unsupervised manner using the low-rank and sparse matrix decomposition technique. The proposed method directly decomposes the noisy speech spectrogram Y into three submatrices, Y L S R , where L, S, and R represent the noise structure matrix, the speech structure matrix, and the residual noise matrix, respectively. This formulation is intrinsically different from robust principal component analysis (RPCA) [7], [8], which assumes Y L S and can efficiently and robustly estimate the sparse formant structures of clean speech from the noisy speech signal. I. Introduction Speech denoising in a real world situation is an important task in many signal processing applications, including telecommunication devices, hearing aids, and speech recognition. This topic has been profoundly studied in the past and many successful models have been put forward [1]. However, speech denoising remains a challenging problem in real world environments and at very low signal-to-noise ratios (SNRs) [1]. A major challenge is to devise an effective speech denoising strategy with the ability to cope with low SNRs and with various noise types frequently encountered in real life situations. To overcome this limitation, many noise reduction algorithms based on the source separation principal have been reported. Examples of such methods include independent Manuscript received Jan. 21, 2013; revised Apr. 16, 2013; accepted May 14, 2013. Jianjun Huang (phone: +86 135 1250 1916, [email protected]), Xiongwei Zhang, ([email protected]), Yafei Zhang ([email protected]), Xia Zou ([email protected]), and Li Zeng ([email protected]) are with the Institute of Command Automation, People’s Liberation Army University of Science and Technology, Nanjing, China. ETRI Journal, Volume 36, Number 1, February 2014 http://dx.doi.org/10.4218/etrij.14.0213.0033 © 2014 II. Proposed Method Preliminary experiments show that the original RPCA method [7], which simply decomposes the noisy speech spectrogram into two submatrices, is not robust and effective enough to extract the formant structure of clean speech. Thus, we extend the original RPCA method by setting noisy speech spectrogram Y as the superposition of L, S, and R, that is, Y L S R . We assume that L lies on a low-rank subspace, the speech structure is sparse, and R is a random matrix whose entries follow independent and identically distributed zero-mean Gaussian distributions. The assumption is based on the observation that the noise spectral always exhibits a repetitive pattern whereas the speech signal has more variation and is relatively sparse within the noise. The problem is to recover low-rank matrix L and sparse matrix S from Y under the perturbation of R. We reformulate the problem as follows. Jianjun Huang et al. 167 Y L S R, rank(L) r , card(S) k , (1) Noisy spectrogram Noisy speech where rank (L) is the rank of L and card (S) is the cardinality of S. For (1), we use the GoDec algorithm to estimate low-rank matrix L and sparse matrix S. GoDec was proposed by Zhou and Tao [9] to solve the following minimization problem: 2 min Y L S F , L ,S STFT |•| Y L Lt arg min Y L St 1 , F rank ( L ) r 2 min Y Lt S F . S t arg card( S) k R S s.t. rank(L) r , card(S) k . (2) This problem is solved by alternatively solving the following two subproblems: Low-rank and sparse matrix decomposition Binary time-frequency masking Enhanced speech sˆ(t ) M Estimated spectrogram STFT–1 ˆ l , n) M (l , n) Y (l , n) S( 2 (3) Practically, the cardinality of S is hard to estimate because the length of the speech signal is unknown beforehand. Therefore, we use the Semi-Soft GoDec algorithm [9], wherein parameter k can be automatically determined by soft threshold for matrix decomposition. Moreover, the computation load of Semi-Soft GoDec is substantially smaller than that of the original GoDec while the error rate is kept the same or even smaller. Semi-Soft GoDec is formulated as the following optimization problem and can be solved by the alternative optimization method (3). min Y L S L ,S 2 F S 1, s.t. rank(L) r . (4) After the low-rank part and the sparse part of noisy speech are extracted, audible noise is masked according to an auditory masking effect using a binary time-frequency mask method [10]. The formulation of the binary time-frequency mask is written as 1, M (l , n) 0, S(l , n) > L(l , n) , otherwise. (5) R is derived as R=Y–L–S when L and S are estimated. In (5), R is discarded. The reason is twofold. Firstly, S and L have been robustly calculated under the perturbation of R in GoDec and the residual noise will not leak into the extracted speech. Secondly, the dense distribution nature of R will reduce the performance of the binary time-frequency mask module, which is confirmed in the experiments. After the binary time-frequency mask is calculated, the estimated speech spectral can be formulated as ˆ l , n) M (l , n) Y (l , n) Y (l , n) , S( (6) where Y (l , n) denotes the phase of noisy speech. Finally, the estimated speech magnitude spectral can then be transformed back to the time domain using the inverse shorttime Fourier transform (STFT) and synthesis with the overlap168 Jianjun Huang et al. Fig. 1. Overview of proposed framework. and-add method. For the sake of clarity, an overview of the proposed framework is illustrated in Fig. 1. III. Experiments and Results 1. Dataset and Quality Measures We use speech from the TIMIT database and noise from the Noisex-92 database [11]. All the signals are resampled at 8 kHz. Specifically, the test speech signals, which consist of ten speakers (five male and five female), are degraded by a variety of noises, including Babble noise, F16 noise, and Factory1 noise, at the input SNR values of –5 dB, 0 dB, 5 dB, and 10 dB. Therefore, there are a total of 30 experiments for a given SNR. Since this is essentially a signal separation problem, we evaluate the proposed algorithm using the BSS-EVAL metrics [12]. The metrics consist of three objective ratios: signal-todistortion ratio (SDR), signal-to-interference ratio (SIR), and signal-to-artifacts ratio (SAR). 2. Effect of Two Important Parameters In Semi-Soft GoDec, the value of is used to trade off the error term of the decomposition with the sparsity of S. The higher is, the sparser matrix S, and vice versa. If matrix S is sparser, there is less residual noise in matrix S. However, the sparser S is, the more speech components will be lost during the separation process, leading to higher speech distortion. On the other hand, if S is less sparse, the extracted speech will suffer less distortion but will contain more residual noise. The rank of the low-rank matrix, r, is used to restrict the rank of L. A high value of r means that the noise spectrum exhibits significant variation. The effect of the combination of and r on the quality of the extracted speech is depicted in Fig. 2. In the experiments, we obtain the spectrograms of noisy speech using a Hamming window with window size 512 and ETRI Journal, Volume 36, Number 1, February 2014 http://dx.doi.org/10.4218/etrij.14.0213.0033 10 6 4 15 2 0 –2 –4 Proposed algorithm RPCA NMF 20 SIR (dB) SDR (dB) 25 rank=1 rank=2 rank=3 rank=4 rank=5 8 10 5 0 0.05 0.1 0.15 0.2 0.25 0.3 0.35 0.4 0.45 0.5 0.55 0.6 0.65 0.7 0.75 0.8 0.85 0.9 0.95 1 λ 0 Fig. 2. Effects of two parameters to SDR metric at input SNR of 5 dB. –5 –5 0 5 10 input SNR (dB) Fig. 3. Average of SIRs and all noise types. 16 14 12 SAR (dB) hop size 256. The same parameters are used in the following subsection. For the two important parameters, r and , we use values 1, 2, 3, 4, and 5 and the range of 0 to 1, respectively. We perform speech denoising using all combinations of the two parameters on our dataset, which amounts to 30 experiments for a given SNR. We average the SDR values for all these experiments and analyze the effect of the two parameters. The experimental curves are depicted in Fig. 2. As shown in the figure, for all values of the rank, the SDR value increases rapidly as changes from 0 to 0.05. The results tend to be worse as the value of increases. This indicates that = 0.05 is an optimal value for all the ranks. Additionally, we find that r=2 provides the best result. It reveals that r=2 is enough to characterize the variation of the noise’s statistics. Larger ranks result in higher speech distortion because some elements of the sparse matrix leak into the low-rank matrix. Similar curves can be observed with other SNRs. Proposed algorithm RPCA NMF 10 8 6 4 2 0 –5 0 5 10 input SNR (dB) Fig. 4. Average of SNRs and all noise types. 14 3. Comparison with Related Denoising Systems ETRI Journal, Volume 36, Number 1, February 2014 http://dx.doi.org/10.4218/etrij.14.0213.0033 10 8 SDR (dB) From previous observations, = 0.05 and r=2 are found to be optimal in terms of SDR in the denoising task and are used in the following experiments. As a comparison, we report the same metrics using the RPCA method. In addition, we also perform speech denoising using NMF, which is another wellknown matrix decomposition method for supervised source separation. Figures 3 through 5 show the average results over all noise types and speakers for each algorithm and input SNR condition. The suppression of noise is reflected in the SIR metric. As shown in Fig. 3, the proposed algorithm achieves significantly better results than the other algorithms at all input SNRs. The RPCA method performs worst in term of SIR. The main reason for the worst noise suppression capability (SIR) when using RPCA is that it simply decomposes the noisy spectrogram into two matrices and some part of the low-rank matrix L leaks into the sparse matrix S. The low-rank matrix Proposed algorithm RPCA NMF 12 6 4 2 0 –2 –4 –5 0 5 10 input SNR(dB) Fig. 5. Average of SDRs and all noise types. does not suffice to characterize the variation of noise statistics. By contrast, the proposed method uses the residual noise matrix to model the variation of noise while the steady statistics of noise are represented in the low-rank matrix. As a result, the extracted speech is less polluted by noise. In addition, we can Jianjun Huang et al. 169 decomposition model by introducing suitable constraints on the sparse part S to alleviate the speech distortion. Table 1. PESQ score. Algorithm SNR = –5 SNR = 0 SNR = 5 SNR = 10 Proposed 1.73 2.13 2.45 2.81 RPCA 1.45 1.94 2.38 2.79 NMF 1.32 1.77 2.12 2.42 see that NMF achieves slightly higher SIR values than RPCA. One reason is that the NMF method is performed in a supervised manner, whereas RPCA is an unsupervised denoising method. In NMF, noises are trained before denoising. Thus, NMF can utilize more prior information in the denoising task than the RPCA method can. The artifacts introduced by the denoising process are reflected in the SAR metric. Figure 4 shows that RPCA introduces less artifacts than the proposed algorithm introduces. However, the difference is small for an input SNR larger than 0 dB. NMF obtains the worst performance in term of SAR. The difference between NMF and the other two methods is large and tends to be larger as the input SNR increases. The reason is that the NMF method requires prior training of the noises and a prior that is too strong prevents it from achieving a sufficient estimate of speech when the mixture contains litter noise [13]. The overall performance is reflected in the SDR metric. Figure 5 shows that the proposed algorithm achieves better performance due to the higher noise suppression and relatively small increase in artifacts. Compared with RPCA, the difference is larger when the SNR is lower. It suggests that the proposed algorithm is especially suitable to deal with noise in a low SNR condition. We can also see that the SDR of the proposed method is close to that of RPCA at a high input SNR. This is because the perturbation of R is slight at a high input SNR, and, when R is absent, (1) reduces to the original RPCA problem. The averaged PESQ scores for the above-mentioned methods are also provided in Table 1. We can see that the PESQ scores exhibit similar trends to the SDR values. IV. Conclusion The initial denoising results obtained using the low-rank and sparse matrix decomposition techniques presented herein are promising. The advantages of the proposed method are that it does not require prior training or other particular features and always outperforms the original RPCA method. Although the proposed method can eliminate most of the interferers, it leads to speech distortion when some of the extracted speech formant structures are lost in the matrix decomposition process. We plan to develop a new low-rank and sparse matrix 170 Jianjun Huang et al. References [1] P.C. Loizou, Speech Enhancement: Theory and Practice, Boca Raton, FL: CRC Press, 2007. [2] J. Hao et al., “Speech Enhancement, Gain, and Noise Spectrum Adaptation Using Approximate Bayesian Estimation,” IEEE Trans. Audio, Speech, Lang. Process., vol. 17, no. 1, Jan. 2009, pp. 24-37. [3] D.C. Balcan and J. Rosca, “Independent Component Analysis for Speech Enhancement with Missing TF Content,” Proc. 6th Int. Conf. Independent Compon. Anal. Blind Signal Separation, Charleston, SC, USA, Mar. 5-8, 2006, pp. 552-560. [4] K.W. Wilson et al., “Speech Denoising Using Nonnegative Matrix Factorization with Priors,” IEEE Int. Conf. Acoust., Speech, Signal Proc., Las Vegas, NV, USA, Mar. 31-Apr. 4, 2008, pp. 4029-4032. [5] M.N. Schmidt, J. Larsen, and F.T. Hsiao, “Wind Noise Reduction Using Non-negative Sparse Coding,” IEEE Workshop Mach. Learning Signal Process., Thessaloniki, Greece, Aug. 27-29, 2007, pp. 431-436. [6] C.D. Sigg, T. Dikk, and J.M. Buhmann, “Speech Enhancement with Sparse Coding in Learned Dictionaries,” IEEE Int. Conf. Acoust., Speech, Signal Proc., Dallas, TX, USA, Mar. 14-19, 2010, pp. 4758-4761. [7] P.S. Huang et al., “Singing-Voice Separation from Monaural Recordings Using Robust Principal Component Analysis,” IEEE Int. Conf. Acoust., Speech, Signal Proc., Kyoto, Japan, Mar. 25-30, 2012, pp. 57-60. [8] E.J. Candes et al., “Robust Principal Component Analysis?” J. ACM, vol. 58, no. 3, May 2011, pp. 11:1-37. [9] T. Zhou and D. Tao, “GoDec: Randomized Low-Rank & Sparse Matrix Decomposition in Noisy Case,” Proc. ICML, Bellevue, WA, USA, June 2011, pp. 33-40. [10] Y. Li and D.L.Wang, “Musical Sound Separation Based on Binary Time-Frequency Masking,” EURASIP J. Audio, Speech, Music Process., vol. 2009, July 2009, pp. 1-10. [11] Rice University Digital Signal (DSP) Group, Noisex92 Noise Database, 1995. http://spib.rice.edu/spib/select_noise.html [12] E. Vincent, R. Gribonval, and C. Fevotte, “Performance Measurement in Blind Audio Source Separation,” IEEE Trans. Audio, Speech, Lang. Process., vol. 14, no. 4, July 2006, pp. 1462-1469. [13] G.J. Mysore and P. Smaragdis, “A Non-negative Approach to Semi-supervised Separation of Speech from Noise with the Use of Temporal Dynamics,” IEEE Int. Conf. Acoust., Speech, Signal Proc., Prague, Czech Republic, May 22-27, 2011, pp. 17-20. ETRI Journal, Volume 36, Number 1, February 2014 http://dx.doi.org/10.4218/etrij.14.0213.0033
© Copyright 2026 ExpyDoc