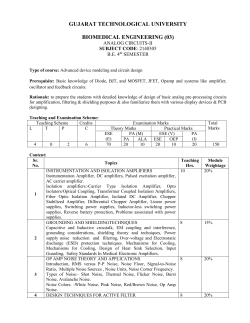
RADIATION-PRESSURE ENHANCED OPTO-ACOUSTIC OSCILLATOR
Matthew J. Storey, Siddharth Tallur, and Sunil A. Bhave
Cornell University, Ithaca, USA
ABSTRACT
This paper presents a driving scheme for silicon optoacoustic oscillators (OAO) by simultaneously exploiting
radiation-pressure (RP) and RF feedback oscillation
mechanisms to achieve significantly lower phase noise than
could be realized by either phenomenon solely. A
theoretical model and experimental results are presented
corroborating this scheme, demonstrating a silicon OAO
operating at 175 MHz with a phase noise of -128.6 dBc/Hz
at 1 MHz offset with 2.77 dBm RF output power, resulting
in a 10dB far-from-carrier phase noise improvement.
INTRODUCTION
Reference oscillators are ubiquitous elements used in
virtually every communication system in existence. The
need for miniaturized, batch manufacturable oscillators as
chip scale timing references stems from the need to replace
the well-established, high performing, albeit expensive
quartz oscillators without compromising on performance.
MEMS oscillators have recently found applications in
various consumer electronic applications. With numerous
advances in fabrication technology and materials
processing, these oscillators are being pushed to create a
presence in the high performance base-band market and
high frequency applications. Scaling MEMS oscillators to
high frequencies presents challenges in terms of reduced
transduction efficiencies and material limits on quality
factors. Opto-mechanical transduction offers higher
sensitivity and opens up possibilities to interrogate high
frequency mechanical resonances hitherto inaccessible. In
the past, our group has demonstrated an opto-mechanically
transduced MEMS oscillator designed in silicon nitride with
zero flicker noise [1], which greatly simplifies the oscillator
design and does away with active noise sources that would
otherwise add flicker noise, thereby degrading the oscillator
phase noise.
Opto-mechanical resonator based oscillators have been
previously demonstrated in both open and closed loop
configurations utilizing radiation–pressure (RP) [1,2] and
RF feedback (RF) [3], respectively. Simultaneous
incorporation of these oscillating mechanisms can be
achieved with a 2-coupled-ring opto-mechanical resonator.
Figure 1 shows an SEM of our device. The coupled
resonator can be transduced through either capacitive
electrostatics or evanescent optical coupling. While each
ring utilizes a different forcing mechanism, the
displacement is conserved and transferred between ring
resonators through the λ/2 coupling beam.
In the following sections, a model is presented for the
2-coupled-ring opto-mechanical cavity dynamics utilizing
both RP and RF feedback forces. This model was nondimensionalized to examine the relative affects between
978-1-4799-3509-3/14/$31.00 ©2014 IEEE
1209
Figure 1: Scanning electron micrograph (SEM) of the 2coupled-ring resonator. The resonator-waveguide gap is
100nm, each ring has an inner radius of 5.7µm and outer
radius of 9.5µm and the resonator-electrode gap is 130nm.
these driving mechanisms and simulations were performed.
The 2-coupled-ring resonator was fabricated and tested in
vacuum at low temperatures under three operating
conditions - RP, RF feedback, and both simultaneously. The
phase noise of the oscillator was measured in all three cases
and compared at both close-to-carrier and far-from-carrier
offset frequencies. We present and discuss these results in
subsequent sections.
OAO MODEL
Theoretical Framework
The dynamics of an opto-mechanical cavity have been
extensively studied in previous work [4]. The displacement
inside the cavity are related
u and optical field
Ω
through the following coupled equations of motion [5]
Ω
Δ
,
⁄
(1)
.
(2)
Here, Ω0 is the mechanical resonance frequency, m is the
effective mass, and γ0 is natural damping of the harmonic
resonator. The total optical cavity detuning Δ Δ
is a function of both the laser detuning at zero displacement
Δ0, the dynamic displacement of the cavity u, and the opto. The total (loaded)
mechanical coupling coefficient
can be expressed as a sum of
optical linewidth
the intrinsic and extrinsic (coupling) linewidths,
respectively. The normalized intra cavity photon number
| | and the input power Pin can be
can be expressed as
expressed in terms of the maximum intra cavity photon
⁄
number
4
Ω [5].
The 2-coupled-ring design of our opto-mechanical
resonator allows for a unique transduction scheme via
simultaneous forcing through both radiation pressure and
MEMS 2014, San Francisco, CA, USA, January 26 - 30, 2014
capacitive electrostatic forces. The force on the cavity
generated through radiation pressure is only dependent on
the opto-mechanical coupling coefficient and the intra
[5].
cavity photon number
The RF electrostatic force, however, depends on the
feedback loop design incorporating the resonator. In our
setup, the cavity’s output optical power is sent to a
photodetector and converted into a photocurrent. The optical
field transmitted from the cavity can be expressed in terms
of the input optical field and intra cavity field
| is normalized to the output power and
where |
| | is normalized to the input power (Pin) [6]. The total
photocurrent is proportional to the output power
|
|
|
|
2
∗
.
Non-dimensionalized Dynamics
To better understand the relative interaction between
these two forcing mechanisms, the coupled equations of
motion are put into a dimensionless form [5]
Δ
̃
2
̃.
̃
Δ
, (4)
(5)
Here, the time was scaled by the mechanical resonance
frequency
Ω and the displacement was scaled as
⁄Ω . All other frequencies were scaled by Ω0 [5] such
⁄Ω , ̃
⁄Ω , and Δ
that
Δ ⁄Ω . The
normalized extrinsic linewidth is a fraction of the total
normalized linewidth, which depends on the coupling. In
̃ where 0
1, but for the rest of this
general, ̃
analysis the device is assumed to be critically coupled such
that
0.5.
The intra cavity optical field was normalized by the
⁄
and
maximum photon number such that
⁄
. The strength of the radiation pressure force was
⁄Ω and a detailed
scaled as
2
explanation of the radiation pressure coupling strength can
be found in [5]. The strength of the RF feedback force is
both a combination of the input optical power contained in
and the scaled gain from the amplifier. Therefore, the
total dimensionless strength of the closed loop RF feedback
force is given by
.
1210
.
(6)
Here, δv is the narrowed linewidth, Δv is the natural
linewidth of the resonator, and meff is the effective mass.
The relationship between the oscillator’s linewidth and its
phase noise (dBc/Hz) at a carrier offset frequency Δf in
the 1/f 2 regime is given by [8]
(3)
Since the input power is constant, the current fluctuations
are contained in the difference between the output and input
power. Therefore, the photocurrent that is fed back to the
|
|
| | . The
resonator can be expressed as
photocurrent is then amplified (gain G) with appropriate
phase shift and electrostatically applied to the optomechanical resonator to close the feedback loop. The
general forcing function for the RF feedback is given as
[7].
̃
Phase Noise Improvement
Assuming the harmonic oscillations of the optomechanical cavity have an energy that is proportional to the
square of the displacement, the oscillation linewidth can be
expressed as [8]
2 Δ
10
⁄
.
(7)
By only varying the driving schemes of an OAO, a change
in the displacement can vary the degree in which the
linewidth narrows. This in turn can change the phase noise
at a given carrier offset. Equations (6) and (7) were
combined and the phase noise difference at a constant offset
was solved for as a function of the displacement ratio
Δ
20
.
(8)
The equation above shows that the phase noise
improvement is proportional to the ratio of oscillation
energies. Therefore, if the displacement of second driving
scheme is larger than the first driving scheme (u2 > u1), then
there will be an improvement in the phase noise (Δ < 0).
Numerical Simulations
The relative displacements of the different driving
schemes were compared by numerically integrating
and . Our
equations (4) and (5) for different cases of
OAO operates in the unresolved sideband regime (USR) and
typically exhibit mechanical quality factors on the order of a
couple thousand, so the dimensionless parameters chosen
were
0.0005, ̃ 10,and Δ
3 [5].
The values for
and
for the three cases are
determined from the threshold behavior of both the RF
feedback and radiation pressure induced oscillations. The
threshold for radiation pressure oscillations was found to be
0.015 and the threshold for closed loop RF feedback
was
0.007.
The first case is just RP oscillations, so the amplifier
gain was set to
0 and the radiation pressure coupling
0.03.
coefficient was set to twice the threshold at
The second case is for just RF feedback, so the radiation
0.005
pressure force is set well below threshold at
and the amplifier gain was set to just above RF feedback
threshold at
2. In the third case, both forces were
placed above threshold. Since the RF feedback force is a
function of both gain terms, two comparisons arise for RP
enhanced RF feedback oscillations. As com is raised above
a.)
b.)
Figure 2: Limit cycle comparisons of the three driving
schemes. For RP enhanced RF feedback, plot (a) is when
amplifier gain is held constant and plot (b) is for the total
closed loop gain held constant.
threshold (0.03), either the amplifier gain
can be held
constant at 2 or the total closed loop gain can be held
constant at
0.01, which requires reducing the
amplifier gain to
1⁄3.
Figure 2 shows the simulation results of the three cases.
When the driving scheme was only radiation pressure or RF
feedback, the oscillator reached a steady limit cycle with
scaled displacement amplitude of approximately 5. When
both driving schemes were incorporated while holding the
amplifier gain constant, the scaled amplitude reached a
value of 12 (plot (a) of figure 2). If the total closed loop gain
was held constant, the scaled amplitude reached a value of
7.2 (plot (b) of figure 2). Plugging these values into
equation (8), the resulting phase noise improvement would
be approximately 8 dB and 3 dB, respectively.
EXPERIMENTAL SETUP
The 2-coupled-ring opto-mechanical resonator was
fabricated on a silicon-on-insulator (SOI) wafer and the
fabrication process was described in detail in [3]. All
experiments were performed in a Lakeshore probe station
under vacuum (30μTorr) using Liquid Nitrogen to cool the
chamber to 80 K. An optical probe was used to send
continuous wave (CW) light into the device through a pair
of on-chip grating couplers. A GSG probe was used to apply
an RF signal to the bond pads, which connected to the
Figure 3: RF Transmission spectrum for the opto-acoustic
resonator measured in vacuum (30µTorr) and low
temperature (80 K). The mechanical mode at 175.3 MHz
corresponds to the fundamental radial expansion mode
(inset: mode-shape) with a quality factor of 6,000.
1211
Figure 4: Experimental setup for radiation pressure
oscillations
electrodes around the resonator.
Open loop measurements were performed on the optoacoustic resonator to determine the RF transmission
spectrum of the mechanical mode of interest. As the applied
RF signal was swept, the transmitted power was sent to a
photodetector and the resulting photocurrent was input to a
Network Analyzer. Figure 3 shows the electromechanical
transmission measurement for the fundamental radial mode.
The resonance frequency (175.3 MHz) and mechanical
quality factor (6,000) were estimated through a Lorentzian
curve fit.
For comparison purposes, the phase noise performance
of the opto-mechanical resonator based oscillator was first
evaluated for RP and RF feedback separately. Since the RP
and RF feedback driving mechanisms differ in their
application to the resonator, this experiment required two
separate setups. Figure 4 shows the setup for a RP driven
opto-mechanical oscillator. A CW diode laser was input to
the device and then the output optical power is measured
with a Newfocus 1647 photodetector and sent to the phase
noise analyzer. RP induced oscillations are achieved by blue
detuning the laser within the optical resonance and using an
input power above threshold [1,2].
To ensure that the only means of achieving oscillations
is by closing the feedback loop, the laser power is reduced
below the threshold for RP oscillations. To create a RF
feedback oscillator, the output RF signal from the
photodetector is amplified and the required phase shift is
introduced to overcome the FB oscillation threshold. The
signal is sent through a 3dB splitter and one half is applied
to the resonator through the GSG probe while the other half
Figure 5: Experimental setup for feedback oscillations
Figure 6: Phase noise data for all three driving
mechanisms. For each plot, the RF output signal power and
driving scheme is given.
Figure 7: Phase noise data normalized to the power
consumption. For each plot, the input optical power and
driving scheme is given.
is sent to the phase noise analyzer. Figure 5 shows the
experimental setup for the RF feedback oscillator. To
achieve oscillations induced simultaneously by both RP and
RF feedback, the closed loop setup shown in Figure 5 is
used with the laser blue detuned and with the optical power
raised above RP threshold conditions.
normalization’s effectiveness). The RP enhanced RF
feedback oscillations had no 1/f 4 or higher order noise and
the close-to-carrier phase noise is dominated by 1/f 3 flicker
noise from both the amplifier and input laser. A 10dB
improvement in far-from-carrier phase noise was observed.
RESULTS
The 2-coupled-ring resonator based oscillator with a
mechanical quality factor of 6,000 and resonant frequency
of 175.3 MHz was tested under vacuum (30μTorr) and low
temperature (80 K) for different driving schemes.
Simultaneous RP and RF feedback induced oscillations
resulted in an increased RF output signal power (2.77 dBm)
when compared to only RP (-21.4 dBm) and RF feedback (15.1 dBm) oscillations. The combined driving scheme
resulted in more energy stored in the oscillator and a 10dB
improvement in far-from-carrier phase noise (1MHz).
Using the setup in figure 4, the device was driven into
RP oscillations at an input optical power of 17 dBm with a
determined RP threshold of 11 dBm. The setup in figure 5
was then used to obtain RF feedback oscillations with an
input optical power below RP threshold (10 dBm). While in
the same closed loop configuration, the input optical power
was increased well above threshold (17 dBm) to observe RP
enhanced RF feedback oscillations. Any further increase in
laser power would result in thermal nonlinearities and
chaotic oscillations. All of the closed loop measurements
were carried out with 30 V DC bias. Figure 6 shows the
resulting phase noise for the three measurements, along with
the carrier powers and driving scheme. The individual RP
and RF feedback oscillations had the lowest carrier powers
(-21.4 dBm and -15.1 dBm, respectively) with comparable
phase noise performance. The simultaneous RP and RF
feedback oscillations demonstrated a large increase in
carrier power (2.77 dBm) while experiencing an
improvement in the far-from-carrier phase noise.
The phase noise measurements were normalized to the
oscillator’s laser and amplifier power consumption and
compared in figure 7 and table 1 (photodetector power
consumption was too large and would have diminished the
Table 1: Phase noise comparisons at offset frequencies.
Operation
mode
RP
RF
RP+RF
(Normalized power consumption)
Phase Noise (dBc/Hz)
1kHz
100kHz
1MHz
Offset
Offset
Offset
-53.62
-109.6
-118.4
-53.95
-108.2
-115.8
-54.74
-112.6
-128.6
1212
CONCLUSION
Acknowledgement: This work was supported under the
DARPA ORCHID program. We would also like to
acknowledge Tanay Gosavi and Professor Clark Nguyen for
discussions of phase noise models.
REFERENCES
[1] S. Tallur, S. Sridaran and S. A. Bhave, MEMS 2012, pp.
19-22.
[2] T. O. Rocheleau, C.T.-C. Nguyen, et al., MEMS 2013,
pp. 118-121.
[3] S. Sridaran and S. A. Bhave, Transducers ‘11, pp.
2920-23.
[4] T.J. Kippenberg and K. J. Vahala, Science, vol. 321, pp.
1172-1176 (2008)
[5] M. Poot, H. Tang, et al, Phys. Rev. A, vol. 86, p.
053826 (2012)
[6] A. Schliesser, T. Kippenberg, et al, Nature Physics, vol.
4, pp. 415-19 (2008)
[7] G. I. Harris, U. L. Andersen, J. Knittel, W. P. Bowen,
Phys. Rev. A, vol. 85, p. 061802 (2012)
[8] H. Rokhsari, M. Hossein-Zadeh, A. Hajimiri, K.
Vahala, Appl. Phys. Lett., vol. 89, p. 261109 (2006)
© Copyright 2026 ExpyDoc