ABSTRACT
CAMPBELL, CAROLINE LLOYD. The Effects of Cocoa Polyphenols and Whey Proteins
on Biomarkers of Satiety and Lipid Metabolism. (Under the direction of Dr. Keith Harris, Dr.
Allen Foegeding, and Dr. Clay Clark).
Low-calorie, hunger suppressing snacks are important in regulating daily calorie
intake and in preventing long-term weight gain. Satiety, or the feeling of fullness that occurs
between meals, is an important factor in determining total calorie intake. Formulation of
appetizing foods with bioactive ingredients is a potential strategy to increase satiety and
promote weight management. Possible ingredients include plant and dairy proteins to induce
long-lasting satiety as well as fruit, vegetable, and whole grain phytonutrients for disease
prevention. Whey protein has been demonstrated to decrease subjective ratings of hunger and
ad libitum food intake as well as to increase levels of satiation and satiety hormones. Cocoa
polyphenolics may moderate glucose levels and increase physiological and psychological
markers of satiety. While flavored whey protein beverages are popular supplements for
muscle recovery, the combined effects of whey protein and cocoa upon satiety and lipid
metabolism are unknown.
This study investigated the bioactive effects of cocoa and whey protein in vitro and in
a human clinical trial. In vitro, 3T3-L1 pre-adipocytes and differentiated adipocytes were
treated with 0.5-100 µg/ml cocoa polyphenolic extract (CPE) and/or 1-15 mM leucine, a
major whey protein amino acid. Extent of differentiation and lipid accumulation were
quantified by Oil-Red-O staining and leptin production was measured by leptin ELISA. 10,
50, and 100 µg/ml CPE treatments inhibited pre-adipocyte lipid accumulation by 17, 35, and
50%, respectively. CPE treatment of 0.5 µg/ml increased leptin production but was not
statistically significant. Leucine treatment had no effect upon lipid accumulation but
increased leptin production by 26-37%. In combination, CPE and 15 mM leucine inhibited
lipid accumulation by 10-36% and slightly increased leptin production.
In a six-week clinical trial, nine healthy panelists (age: 22.6 ± 1.7; BMI: 22.3 ± 2.1)
consumed chocolate-protein beverages once per week. Isocaloric beverage formulations
included: placebo, whey protein isolate (WPI), low polyphenolic cocoa (LP), high
polyphenolic cocoa (HP), LP-WPI, and HP-WPI. Panelists responded to a hunger
questionnaire, measured blood glucose levels, and provided blood samples after fasting and
0.5, 1, 2, and 4 hours following beverage consumption. Hunger ratings were measured using
a 100 mm visual analogue scale (VAS), blood glucose levels were measured using a
commercial blood sugar meter, and serum leptin and adiponectin levels were assayed with
appropriate ELISA kits. While not statistically significant, the WPI beverage produced the
greatest decreases in hunger ratings while HP cocoa suppressed hunger better than LP cocoa.
30 minutes post-consumption, the WPI, HP-WPI, and LP-WPI beverages increased blood
glucose 8, 12, and 16% above baseline levels, respectively, compared to increases of 27, 39,
and 58% in HP, LP, and placebo beverages, respectively. The moderation of blood glucose
by all beverages was statistically significant as compared to the placebo and WPI and HP
cocoa-containing beverages were the most effective. Serum leptin decreased after
consumption of all beverages while WPI and cocoa-containing beverages significantly
increased adiponectin levels above that of the placebo. These studies indicate that WPI and
high polyphenolic cocoa may have beneficial effects upon lipid metabolism, feelings of
satiety, and blood glucose and adiponectin levels. The combination of these bioactive
ingredients in foods formulated for health may provide substantial benefits in promoting
satiety and weight maintenance and in regulating lipid and glucose metabolism.
© Copyright 2014 Caroline Lloyd Campbell
All Rights Reserved
The Effects of Cocoa Polyphenols and Whey Proteins on Biomarkers
of Satiety and Lipid Metabolism
by
Caroline Lloyd Campbell
A thesis submitted to the Graduate Faculty of
North Carolina State University
in partial fulfillment of the
requirements for the degree of
Master of Science
Food Science
Raleigh, North Carolina
2014
APPROVED BY:
_______________________________
Dr. E. Allen Foegeding
Committee Co-Chair
________________________________
Dr. A. Clay Clark
______________________________
Dr. G. Keith Harris
Committee Co-Chair
BIOGRAPHY
Caroline Campbell was born and raised in the idyllic town of Moscow, Idaho.
Though Idaho is widely renowned for its superior potatoes, Moscow and the surrounding
region is actually the pea and lentil capitol of the world. Caroline enjoyed a busy childhood,
including eleven years of competitive swimming and playing piano, and eventually decided
to remain in Moscow to attend the University of Idaho. She spent four years as a VandalCougar hybrid, pursuing her B.S. in Food Science in the University of Idaho/Washington
State University Bi-State School of Food Science. During her years at the UI, Caroline was
an active member of the Student Alumni Relations Board, served as the president and vicepresident of the UI Food Science Club, and participated in three alternative service break
volunteer trips. Caroline graduated with her B.S. in 2011 and promptly took a year off.
During this time, she studied abroad in Chile and completed two internships, one at Cargill
and one at Smucker’s, exploring the subtleties of modified starches and coffee flavorings.
Though Caroline enjoyed a happy twenty-two years in Idaho, her family roots in the
Tarheel State (or the familiar draw of a parallel state potato industry) fated her to move to the
Northernmost Carolina. Following in her parents’ footsteps, Caroline began her Master’s
degree at North Carolina State University in Fall 2012. At NCSU, Caroline was an active
member of the NCSU Food Science Club, twice serving as co-chair for the club’s Dairy Bar
fundraiser at the NC State Fair. Caroline also minored in Biochemistry while completing her
Master’s. Upon completion of her Master’s degree, Caroline will pursue a PhD in Food
Science under the direction of Dr. Allen Foegeding studying the structure and breakdown
patterns of model foods and how these properties impact satiety.
ii
ACKNOWLEDGMENTS
I would to thank the following people for their invaluable contributions to my
Master’s research and experience at NCSU.
•
Dr. Foegeding and Dr. Harris for their combined intelligences, creativity, and neverfaltering support. Both lab groups have become my surrogate families in Raleigh.
•
Dr. Clark and Dr. Komarnytsky for agreeing to serve on my committee and for
expanding and challenging my appreciation of biochemistry and cell culture.
•
Paige Luck and Ruth Watkins for their endless patience and daily emotional and
psychological support. Our successes wouldn’t be possible without your watchful
eyes and attention to detail.
•
The Hershey Company and Davisco Foods International, Inc for their generous
donations of cocoa powder and whey protein isolate, compositional analysis, and sage
advice. In case of worldwide cocoa shortages, the Foegeding lab now possesses the
equivalent supply of a small African nation.
•
The Dairy Research Institute for their financial support of my clinical trial.
•
Katherine Speight for her reliability, creativity, patience, and optimism with cell
culture.
•
Avi Aggarwal and Eleanor Frederick for their instrumental help in the execution of
my clinical trial and for cheerfully coming to work at 6:30 am.
•
Kendra Stallings, Robert Price, Weston Bussler, Leisel Hannes, Lindsey Reardon,
Katherine Speight, Chris Biamonte, Elliott McDowell, and Andrew Kaufmann for
sacrificing their fingertips, sleep schedules, social lives, and sanity for the sake of
science. My clinical trial would be nonexistent without their dedication as panelists. I
enjoyed every minute spent getting to know you all, even if it was through forced
panelist-researcher torture.
•
Alton, Janet, and Christopher Campbell for their unwavering support from afar. And
for their seemingly genuine interest in the specifics of cellular babysitting and the
woes of designing a clinical trial.
•
Finally, I owe a debt of gratitude to Kendra Stallings, An Truong, Maggie Schneider,
Ty Wagoner, Katheryne Daughtry, and Allie Briner. Thank you for countless happy
hours, communal complaining, intellectual and emotional support, and for putting up
iii
with my occasional moodiness. Friends and colleagues like you make the trivial daily
struggles of grad school worth the journey. Thank you for making Raleigh my home.
iv
TABLE OF CONTENTS
LIST OF TABLES ................................................................................................................ vii
LIST OF FIGURES .............................................................................................................viii
LIST OF ABBREVIATIONS ................................................................................................x
CHAPTER 1: LITERATURE REVIEW ............................................................................. 1
1.1
INTRODUCTION ........................................................................................................... 2
1.2
SATIETY AND ITS EFFECTORS ................................................................................. 6
1.3
WHEY PROTEIN.......................................................................................................... 13
1.4
COCOA ......................................................................................................................... 18
1.5
FACTORS THAT IMPACT SATIETY ........................................................................ 24
1.5.1 PHYSICAL PROPERTIES OF FOOD ................................................................................ 24
1.5.2 MACROMOLECULAR COMPOSITION OF FOOD ......................................................... 27
1.5.3 MICROMOLECULAR COMPOSITION OF FOOD .......................................................... 31
1.6
3T3-L1 PRE-ADIPOCYTES AS A MODEL FOR SATIETY AND WEIGHT
MANAGEMENT........................................................................................................... 32
1.7 REFERENCES ................................................................................................................. 43
CHAPTER 2: EFFECTS OF COCOA POLYPHENOLS AND LEUCINE ON
DIFFERENTIATION, LIPID ACCUMULATION, AND LEPTIN PRODUCTION IN
3T3-L1 PRE-ADIPOCYTES ............................................................................................... 57
2.1 ABSTRACT...................................................................................................................... 58
2.2 INTRODUCTION ............................................................................................................ 58
2.3 MATERIALS AND METHODS...................................................................................... 61
2.3.1 MATERIALS AND REAGENTS ............................................................................................. 61
2.3.2 PREPARATION OF COCOA PHENOLIC EXTRACT (CPE) ............................................... 62
2.3.3 CELL CULTURE ................................................................................................................... 63
2.3.4 CELL VIABILITY .................................................................................................................. 64
2.3.5 CELLULAR LIPID ACCUMULATION ................................................................................. 64
2.3.6 LEPTIN SECRETION............................................................................................................ 65
2.3.7 STATISTICAL ANALYSIS...................................................................................................... 65
2.4 RESULTS AND DISCUSSION ....................................................................................... 65
2.4.1 EFFECTS OF COCOA EXTRACT AND LEUCINE ON 3T3-L1 CELL VIABILITY ............. 65
2.4.2 EFFECTS OF COCOA EXTRACT AND LEUCINE ON 3T3-L1 DIFFERENTIATION AND LIPID
ACCUMULATION .............................................................................................................................. 69
2.4.3 EFFECTS OF COCOA EXTRACT AND LEUCINE ON 3T3-L1 LEPTIN SECRETION ........................... 79
v
2.5 CONCLUSIONS .............................................................................................................. 87
2.6 REFERENCES ................................................................................................................. 90
CHAPTER 3: THE EFFECTS OF COCOA POLYPHENOLICS AND WHEY
PROTEIN ON BIOMARKERS OF SATIETY AND GLUCOSE METABOLISM IN A
HUMAN CLINICAL TRIAL .............................................................................................. 95
3.1 ABSTRACT...................................................................................................................... 96
3.2 INTRODUCTION ............................................................................................................ 97
3.3 MATERIALS AND METHODS.................................................................................... 101
3.3.1 SUBJECTS ............................................................................................................................. 101
3.3.2 ANTHROPOMETRY ................................................................................................................. 102
3.3.3 EXPERIMENTAL DESIGN ........................................................................................................ 102
3.3.4 QUESTIONNAIRE ................................................................................................................... 103
3.3.5 MATERIALS ........................................................................................................................... 104
3.3.6 BEVERAGE FORMULATION AND PREPARATION ....................................................................... 104
3.3.7 SERUM PEPTIDE ANALYSIS/BLOOD PARAMETERS ................................................................... 106
3.3.8 STATISTICAL ANALYSIS .......................................................................................................... 106
3.4 RESULTS AND DISCUSSION ..................................................................................... 107
3.4.1. EFFECTS OF COCOA POLYPHENOLS AND WHEY PROTEIN ON SUBJECTIVE RATINGS OF HUNGER
...................................................................................................................................................... 107
3.4.2. EFFECTS OF COCOA POLYPHENOLS AND WHEY PROTEIN ON BLOOD GLUCOSE LEVELS ......... 112
3.4.3. EFFECTS OF COCOA POLYPHENOLS AND WHEY PROTEIN ON SERUM LEPTIN LEVELS ............. 116
3.4.4. EFFECTS OF COCOA POLYPHENOLS AND WHEY PROTEIN ON SERUM ADIPONECTIN LEVELS ... 120
3.5 CONCLUSIONS ............................................................................................................ 125
3.6 REFERENCES ............................................................................................................... 128
APPENDICES ..................................................................................................................... 136
APPENDIX A: CELL CULTURE SUPPLEMENTARY MATERIAL .............................. 137
APPENDIX B: CLINICAL TRIAL SUPPLEMENTARY MATERIAL............................. 140
vi
LIST OF TABLES
CHAPTER 1: LITERATURE REVIEW
Table 1.1. Biomarkers of satiation and satiety. ........................................................................ 9 Table 1.2. Comparison of leucine and total branched chain amino acid (BCAA) content of
various dietary proteins ................................................................................................... 15 Table 1.3. Proanthocyanidin content of a standard natural cocoa powder. ............................ 20 CHAPTER 3: THE EFFECTS OF COCOA POLYPHENOLICS AND WHEY
PROTEIN ON BIOMARKERS OF SATIETY AND GLUCOSE METABOLISM IN A
HUMAN CLINICAL TRIAL
Table 3.1. Panelist measurements at beginning of trial........................................................ 102 Table 3.2. Formulation of the six test beverages.................................................................. 105 APPENDICES
Table A.1. Epicatechin polymer (1-10) content of cocoa polyphenolic extract used in 3T3-L1
cell culture treatments. .................................................................................................. 138 Table A.2. Methylxanthine content of cocoa polyphenolic extract used in 3T3-L1 cell culture
treatments. ..................................................................................................................... 138 Table A.3. Compositional, DMAC, and PAC 1-10 analysis results for regular high
polyphenolic and Dutched low polyphenolic cocoa. .................................................... 141 vii
LIST OF FIGURES
CHAPTER 1: LITERATURE REVIEW
Figure 1.1. A depiction of hunger level versus time over 24 hours. ........................................ 7 Figure 1.2. An idealized representation of serum leptin levels over 24-hours. ..................... 11 Figure 1.3. Stages of pre-adipocyte differentiation................................................................ 35 CHAPTER 2: EFFECTS OF COCOA POLYPHENOLS AND LEUCINE ON
DIFFERENTIATION, LIPID ACCUMULATION, AND LEPTIN PRODUCTION IN
3T3-L1 PRE-ADIPOCYTES
Figure 2.1. Effects of CPE treatment on pre-adipocyte cell viability during differentiation
(day 0-2). ......................................................................................................................... 66 Figure 2.2. Effects of leucine treatment on pre-adipocyte cell viability during differentiation
......................................................................................................................................... 67 Figure 2.3. Effects of CPE and 15 mM Leu treatment on pre-adipocyte cell viability. ........ 68 Figure 2.4. Effects of CPE treatment on adipocyte cell viability. ......................................... 69 Figure 2.5. Effects of CPE treatment on pre-adipocyte lipid accumulation during
differentiation.................................................................................................................. 71 Figure 2.6. Effects of CPE on lipid accumulation and extent of cell differentiation as viewed
by microscopy after ORO lipid staining ......................................................................... 71 Figure 2.7. The hypothetical mechanistic effects of cocoa polyphenolics, alone and in
combination with leucine, on pre-adipocytes and adipocytes. ....................................... 74 Figure 2.8. Effects of CPE treatment on adipocyte lipid accumulation ................................. 75 Figure 2.9. Effects of CPE + 15 mM Leu treatment on pre-adipocyte lipid accumulation
during differentiation ...................................................................................................... 77 Figure 2.10. Leptin secretion in adipocytes treated with CPE ............................................... 81 Figure 2.11. Leptin secretion in adipocytes treated with leucine........................................... 83 Figure 2.12. Leptin secretion in adipocytes treated with leucine and 0.5 µg/ml CPE ........... 84 CHAPTER 3: THE EFFECTS OF COCOA POLYPHENOLICS AND WHEY
PROTEIN ON BIOMARKERS OF SATIETY AND GLUCOSE METABOLISM IN A
HUMAN CLINICAL TRIAL
Figure 3.1. Changes in hunger ratings before and after beverage consumption .................. 109 Figure 3.2. Percent changes in blood glucose levels before and after beverage consumption
....................................................................................................................................... 113 Figure 3.3. Percent changes in serum leptin levels before and after beverage consumption.
....................................................................................................................................... 117 Figure 3.4. Percent changes in serum adiponectin levels before and after beverage
consumption. ................................................................................................................. 122 viii
APPENDICES
Figure A.1. Effects of leucine treatment on pre-adipocyte lipid accumulation during
differentiation................................................................................................................ 139 Figure A.2. Clinical trial panelist instructions for each session........................................... 142 Figure A.3. Panelist session record form. ............................................................................ 145 Figure A.4. Averaged hedonic liking results for overall beverage, flavor, and texture. ...... 147 ix
LIST OF ABBREVIATIONS
Akt ------------ protein kinase B
AMPK-α ------ AMP-activated protein kinase-α
BCAA --------- branched chain amino acids
BMI ----------- body mass index
CCK ----------- cholecystokinin
C/EBP --------- CCAAT/enhancer binding protein-α
CPE ----------- cocoa polyphenolic extract
DMAC -------- 4-dimethylaminocinnamaldehyde assay for total flavanols
DMEM -------- Dulbecco’s modified eagle medium
EGCG --------- epigallocatechin gallate
ELISA -------- enzyme linked immuno-absorbent assay
ERK ----------- extracellular signal-regulated kinase
FAS ----------- fatty acid synthase
FBS ------------ fetal bovine serum
GIP ------------ gastric inhibitory polypeptide
GLP-1 --------- glucagon-like peptide
GLUT --------- glucose transporter
GMP ---------- glycomacropeptide
HP ------------- high polyphenolic cocoa
Leu ------------ leucine
LP ------------- low polyphenolic cocoa
mTOR --------- mammalian target of rapamycin
MTT ----------- 3-(4,5-dimethylthiazol-2-yl)-2,5-diphenyltetrazolium bromide
OB ------------- obesity gene
ORO ----------- Oil-Red-O
OXM ---------- oxyntomodulin
PAC 1-10 ----- Proanthocyanidin 1-10 (assay and descriptor for polymers of 1-10 monomers)
PPAR --------- peroxisome proliferator-activated receptor
PYY ----------- peptide YY
SCD-1 --------- stearoyl-CoA desaturase-1
SGLT --------- sodium-dependent glucose transporter
SREBP -------- sterol regulatory element-binding protein-1c
VAS ----------- visual analogue scale
WPC ---------- whey protein concentrate
WPI ----------- whey protein isolate
x
CHAPTER 1: LITERATURE REVIEW
1
1.1 INTRODUCTION
Within the last two decades, scientists have observed a significant upsurge in both
childhood and adult U.S. obesity rates ("Nutritional Benefits of Dairy Ingredients" 2010).
Though obesity has myriad causes, the growing abundance, affordability, and convenience of
high calorie foods is widely accepted as a major contributing factor. While the appeal of
convenience and packaged foods is not likely to diminish, the nutritional profiles of these
foods can be enhanced to support healthier lifestyles. This presents a demand for products
that support weight management and control hunger at meals and snack times: products that
increase satiety and are enjoyable, affordable, and convenient.
Obesity is a complex issue, encompassing nutritional content, availability, and
affordability of foods as well as consumer consumption and exercise habits (Ruhm 2012).
While most adults are well aware of proper nutrition and its benefits, many either do not have
access to healthy foods or simply do not have the means to purchase these foods (Asp 1999).
Areas devoid of grocery stores or fresh foods, called food deserts, are widespread in large
metropolitan and economically depressed areas. People residing in these food deserts may
have to travel miles to the nearest grocery stores, limiting their access to fresh, nutritious
foods with short shelf-lives (fruits and vegetables). Fresh foods also demand a premium price
and often force consumers on limited budgets to choose cheap, high calorie processed foods
over foods with higher nutrient densities (Almiron-Roig, Flores, and Drewnowski 2004). An
increasingly sedentary, time-strapped population combined with a reliance upon fast,
convenient foods has also contributed to the increasing obesity rate. Many processed foods
2
and restaurant meals also provide too-large serving sizes and high levels of fat, starch, and
sugar, leading to overeating.
Excess body weight is correlated with higher morbidity rates in both children and
adults as well as increased risk of numerous diseases, including heart disease, stroke, some
cancers, Type II diabetes, and osteoarthritis (Finkelstein, Ruhm, and Kosa 2005). Body mass
index, or BMI, is a simplified, widely used indicator of obesity and takes into account both
weight and height. Obesity is also often accompanied by hyperinsulinemia (high plasma
insulin levels) and leptin resistance: an acquired dysfunction in which the body does not
register hormonal leptin production that signals fullness between meals (Lustig 2006).
Between 1999 and 2012, the percentage of obese adults in the U.S. rose from 30.3% to
35.9% and the percentage of obese children increased from 11% to 18% ("Health, United
States, 2011” 2012). In 2010, one in five children five years or older was obese and adults
with grade 1 (BMI 30.0-34.9), 2 (BMI 35.0-39.9), and 3 obesity (BMI 40 or greater)
increased from 14% to 20%, 5% to 9%, and 3% to 6%, respectively ("Health, United States,
2011” 2012).
Finkelstein et al. (2012) applied a nonlinear prediction model to obesity statistics and
estimated that by 2030, 42% of the U.S. population will be obese and 11% will be severely
obese. The costs of obesity to the economy are also significant: estimates indicate that 9% of
medical expenses can be attributed to obesity, totaling $147 billion each year, and will only
increase as the obesity rate rises ("Health, United States, 2011” 2012). In addition, it is
estimated that $549.5 billion in health care costs could be saved in the next 20 years if the
obesity level remained at its current level (Finkelstein et al. 2012).
3
Though obesity is influenced by diet, exercise, genetics, and environment, the
increased obesity rate over the last four decades appears to be most correlated with changes
in diet and exercise (Finkelstein, Ruhm, and Kosa 2005). In addition to growing portion sizes
and an increase in meals eaten outside of the home, the price disparity between whole foods
and processed, high caloric foods with low nutrient densities deeply impacts consumerpurchasing decisions (Asp 1999). Food scientists and the food industry have limited impact
upon consumer access to healthy foods and consumption and exercise habits, but they can
improve the nutritional quality of processed foods. Herein lies a niche for macro- and
micronutrient fortified foods that control hunger and promote weight management. To
formulate a product with these characteristics, food scientists can find methods to capture the
nutrients of whole foods and package them in a convenient, shelf-stable, affordable, and
widely available form. Meeting these specifications involves innovation and ingenuity at the
interface of product development, food engineering, and food processing.
Preventing obesity through food choices involves formulating foods that both
suppress long-term hunger and limit fat accumulation. Three major sectors of nutrientfortified products exist within the food industry: 1. athletic recovery products, 2. meal
replacement and filling low calorie snack products and, 3. products that provide
comprehensive nutrition to the elderly or those with no appetite. The segment most
concerned with and prone to obesity is the second category and includes a target market of
consumers of ages 18 to 60 (Food Product Design 2011). These consumers use meal
replacement products and snacks to limit their calorie consumption with an end goal of losing
weight or maintaining their current weight (Food Product Design 2011). In general, these
4
products contain 50-60% carbohydrates, 10-15% protein, and 25-40% fat and between 150 to
300 calories per serving (Food Product Design 2011). Meal-replacement sales were $2.3
billion in 2010 and have experienced an increase of 34% since 2008, indicating a growing
interest in and need for more filling and convenient food products (Food Product Design
2011).
Within the meal replacement and low-calorie snack market, product composition is
key. In order to effectively provide weight maintenance support to a broad segment of the
population, these products must meet a variety of requirements at each stage of formulation.
The first goal is to support health, which involves the incorporation of ingredients that induce
satiety and deliver basic nutrition (Benelam 2009). Secondly is the consideration of flavor
and taste: consumers will generally not continue to purchase foods that they do not enjoy
eating, even if they know the food is healthy. Thirdly, all product ingredients must be
affordable and widely available to consumers, regardless of regional location and grocery
environment (Asp 1999).
In the selection of ingredients that induce satiety and are affordable and enjoyable,
protein is an obvious choice. Protein has been shown to have a greater positive effect upon
after-meal fullness when compared to fats and carbohydrates (Veldhorst et al. 2008). For this
reason, high-protein diets are often recommended for weight loss. Of the many types of
available proteins, whey protein is a dairy by-product with a range of biological and
physiochemical health benefits (Pal, Ellis, and Dhaliwal 2010).
A smaller number of studies have also indicated that polyphenolic compounds exhibit
beneficial effects in weight loss and maintenance (Panickar 2013). Availability, affordability,
5
and shelf-life of polyphenolic-rich whole fruits and vegetables is limited but can be extended
through processing. Cocoa beans contain high levels of polyphenolic compounds, have a
familiar, enjoyable flavor, and are an affordable, fat-free ingredient when processed into
cocoa powder. The combination of whey proteins and cocoa has the potential to meet all of
the above requirements for a targeted weight maintenance food product.
1.2 SATIETY AND ITS EFFECTORS
Increasing both physiological and psychological satiety, or the feeling of fullness
after eating, is vital to limiting calorie consumption and weight gain. While often used
interchangeably, satiation and satiety refer to different mechanisms and are defined by
different time frames. Satiation refers to the feeling of fullness during food consumption that
leads to termination of eating; satiety is the long-term feeling of fullness between meals
before hunger returns (Benelam 2009). Therefore, satiation controls total calories consumed
in one meal and satiety affects the length of time between meals and impacts the number of
calories consumed in between meals and at the following meal. Figure 1.1 depicts idealized
hunger levels over 24 hours. Feelings of hunger and fullness are clearly subjective and vary
between subjects. In addition, indications of appetite do not always correlate with food
intake, as hunger is both a physical and psychological sensation. Though increased control of
appetite and food intake is possible by satiety-inducing foods, the reality remains that our
physical and psychological desires are not always the same: we often fail to eat when hungry
or continue to eat when full (De Graaf et al. 2004).
6
Figure 1.1. A depiction of hunger level versus time over 24 hours.
Triggers of psychological satiety vary, but physiological satiety is controlled by
peptide hormones, including ghrelin, leptin, insulin, peptide YY3-36 (PYY), glucagon-like
peptide (GLP-1), oxyntomodulin (OXM) and cholecystokinin (CCK) (Beglinger and Degen
2006, Lustig 2006). Each of these is secreted from different sites and at different time points
during and after digestion. Endocrine signaling then proceeds through the bloodstream and
targets the brain to regulate energy homeostasis. Of the above signaling molecules, ghrelin is
the only compound associated with appetite stimulation, while the remaining molecules act
to inhibit appetite.
Ghrelin is a peptide hormone that is secreted by X/A-like cells in the stomach and is
found at lower concentrations in the small intestine, pancreas, gallbladder, liver, spleen and
immune cells (Zwirska-Korczala et al. 2007). Ghrelin activates neuropeptide Y and agouti-
7
related peptide, neuropeptides that act on the hypothalamus to indicate hunger and increase
appetite, and is the only known hormone regulator of feeding and weight gain (Castañeda et
al. 2010).
PYY3-36, GLP-1, OXM, and CCK are gut peptides secreted from L-cells in the
gastrointestinal tract during digestion (Beglinger and Degen 2006). GLP-1 stimulates insulin
production and inhibits glucagon secretion, actions that lower blood sugar and prepare the
body to store glucose in the form of glycogen (liver and skeletal muscle) or triglycerides
(adipocytes). Administration of OXM has been shown to decrease food intake and to increase
weight loss in humans (Benelam 2009). GLP-1, OXM, and peptide YY3-36 delay gastric
emptying and decrease appetite (Beglinger and Degen 2006). CCK production is stimulated
by ingestion of lipids and protein and also delays gastric emptying, increases pancreatic
insulin secretion, and may act in coordination with leptin, a satiety hormone secreted by
adipose tissue (Benelam 2009). Though all are released from the small intestine, it is
suggested that CCK affects satiation while PYY and GLP-1 affect satiety (De Graaf et al.
2004). Table 1.1 gives an overview of peptide regulation of satiation and satiety.
8
Table 1.1. Biomarkers of satiation and satiety.
Biomarker Production site
Effect on appetite
Ghrelin
Stomach
Increases hunger
CCK
Small intestine
Increases satiation
GLP-1
Intestine
Increases satiation
and short-term
satiety
OXM
Intestine
Increases satiety
PYY
Small intestine
Increases satiety
PP
Leptin
Pancreas
Adipose tissue
Increases satiety
Increases long-term
satiety
Additional effects
Delays gastric emptying,
increases insulin secretion
Delays gastric emptying,
stimulates insulin production
and inhibits glucagon secretion,
moderates gastric acid secretion
Delays gastric emptying,
increases energy expenditure
Delays gastric emptying,
reduces gastric secretions,
increases intestinal transit time
Maintains homeostasis in
thyroid, moderates energy
intake and expenditure
CCK: cholecystokinin, GLP-1: glucagon-like peptide, OXM: oxyntomodulin, PYY: peptide YY3-36, PP: pancreatic
polypeptide
(De Graaf et al. 2004, Lustig 2006, P. G. Cammisotto and Bendayan 2007, Benelam 2009)
In contrast to the aforementioned appetite-regulating signals, leptin is produced and
secreted by white adipose tissue and at very low levels by gastrointestinal cells. Like the
biomarkers discussed above, leptin also decreases food intake and increases energy
expenditure. However, its signaling mechanism and time frame are different due to its
mechanism of secretion and signaling (Lustig 2006, Zwirska-Korczala et al. 2007). Leptin
production by the gastric mucosa regulates short-term nutrient absorption while adipose
tissue production influences long-term satiety and energy storage (Cammisotto and Bendayan
2007). The gene encoding for leptin was identified and named the obesity (OB) gene due to
its apparent connection with obesity in OB-deficient mice (Zhang et al. 2005). Due to their
lack of leptin expression, OB-deficient mice exhibit increased appetite, increased rates of
9
diabetes and infertility, and decreased basal metabolic rate and physical activity (Lustig
2006). Adipocytes are the only cell type that expresses leptin through the OB gene.
A 16-kDa, 167 amino acid hormonal signaling protein, leptin is an endocrine
hormone produced by white adipose tissue (Cammisotto and Bendayan 2007). Leptin
regulates appetite and metabolism within the endocrine system and maintains homeostasis in
the thyroid and immune system via cytokine action (Zhang et al. 2005). Plasma leptin
concentrations also affect the development of diabetes and cardiovascular and
gastrointestinal diseases. Production of leptin varies by species: subcutaneous adipose tissue
has been shown to secrete the highest levels of leptin in humans while epididymal tissue has
the highest production in rats (Cammisotto and Bendayan 2007).
Under non-stimulated conditions, leptin synthesis and secretion remains constant.
Stimulation by exogenous or endogenous agents increases leptin levels but it appears that
several hours of leptin production are required to reach the leptin levels necessary to induce
satiety (Cammisotto et al. 2006). Regardless, increased body fat decreases neuropeptide Y
levels (hunger) in vivo and increases leptin levels (satiety) due to the presence of more leptinsecreting fat cells (Gregoire, Smas, and Sul 1998). In addition, individual food components
and their metabolites may have different effects upon leptin secretion. Figure 1.2
demonstrates the changes in plasma leptin levels over a 24-hour period.
10
Figure 1.2. An idealized representation of serum leptin levels over 24-hours.
Based upon research by (Teff et al. 2004). Panelists were provided with high glucose beverages in addition to
each meal.
Leptin is produced in proportion to the amount of fat stores in the body, so obese
individuals usually exhibit increased serum levels of leptin (Fried et al. 2000). It has also
been shown that leptin mRNA is overexpressed in subcutaneous and visceral adipose tissue
of obese individuals (Cammisotto and Bendayan 2007). This is explained not only by an
increase in fat stores, but also by an increase in fat cell size in obese patients when compared
to lean patients; this 2-4 time increase in adipose cell size appears to increase leptin
production up to seven times that of lean patients (Fried et al. 2000). Increases in leptin
secretion during weight gain and decreases with weight loss have also been observed but it is
still unclear whether leptin is the major determining signal of energy expenditure (Maffei et
al. 1995, Rosenbaum et al. 1997).
11
Leptin resistance, a recently recognized condition, occurs when the body does not
recognize or respond to leptin production at normal or even elevated levels (Lustig 2006).
This is similar to, but less dangerous than, Type II diabetes in which the body does not
respond adequately to insulin production after food consumption. Individuals that display
leptin resistance require higher levels of circulating leptin to generate the same satiety
response as non-leptin resistant individuals. It is suggested that leptin resistance is a hallmark
of obesity: decreasing food intake further decreases leptin, coordinating a starvation response
that lowers resting energy expenditure, increases appetite, and slows weight loss (Lustig
2006). Leptin resistance may also be due to a reduction in leptin transport across the bloodbrain barrier, explaining why obese patients with high plasma leptin levels do not register
appropriate satiety signals (Myers, Cowley, and Münzberg 2008).
A few studies have shown that leptin administration can enhance weight loss
(Heymsfield et al. 1999, Rosenbaum et al. 1997). Because the insulin and leptin signaling
pathways overlap, it is also possible that insulin resistance may potentiate leptin resistance
(Lustig 2006). Increased insulin levels can thus interfere with cellular leptin signaling.
Insulin also plays a significant role in energy intake by signaling short-term changes in
available energy.
Though the physiology of satiation and satiety play a large role in energy intake, the
impact of hedonic reward during eating cannot be overlooked. During eating, these signals
dictate the pleasurable aspects of food and how much a specific food is liked or disliked.
Hedonic signals often overpower physiological signals of fullness (Lustig 2006). Leptin is
believed to play a role in hedonic reward regulation but the fact remains that the hedonic
12
contribution to food intake is psychological, individually specific, and difficult to control
through clinical means (Myers, Cowley, and Münzberg 2008).
Within the body, satiety is induced by physical and biochemical means. Physically,
food consumption increases body temperature as macronutrients are broken down and
oxidized in the intestinal tract (De Graaf et al. 2004). Increased body temperature, called
diet-induced thermogenesis, has been found to be casually associated with increased satiety.
A study by Westerterp-Plantenga et al. (1999) indicated that meals high in protein cause a
greater increase in thermogenesis than meals high in carbohydrate or fat. Body temperature,
however, has not been found to be a reliable method for quantifying satiety. In satiety
studies, three measurements predominate: patient hunger scaling, quantification of ad libitum
intake following consumption of a test food, and analysis of satiety biomarkers from plasma.
The first measure is subjective, based upon the individuals tested, but gives a representation
of satiety without biochemical analyses.
1.3 WHEY PROTEIN
Milk was the first, and may remain the only, food explicitly intended for human
consumption. Milk’s unique nutritional composition of protein, fat, lactose, and minerals was
biologically designed as the ideal food for infant growth. Casein and whey proteins make up
the protein fraction and serve different roles in structure and function. Caseins are defined as
those proteins precipitated during cheese-making, forming cheese curds. This class of
proteins, originally defined by macroscopic properties, is a group of gene products that are
found in milk associated into a supra-molecular micelle structure, which also contains
13
colloidal calcium and phosphate (Smithers 2008). The so-called whey proteins are those that
remain soluble in the milk serum that is expelled in the “whey” during cheese production.
Whey proteins account for about 20% of the total protein in bovine milk and as a cheese byproduct, can be purified and used as a nutritional supplements and/or functional ingredients
(Dunshea et al. 2007).
Liquid whey has a protein concentration of about 65% and is most often purified to
produce whey protein concentrate (WPC) and whey protein isolate (WPI), which contain 3480% and greater than 90% protein, respectively (Luhovyy, Akhavan, and Anderson 2007).
Once simply a waste-stream from cheese production, whey ingredient production has grown
1-2% annually (Smithers 2008). β-lactoglobulin and α-lactalbumin are the two major protein
constituents of whey, with serum albumin and immunoglobulins present at lower levels. In
addition, fresh whey often contains glycomacropeptide, or GMP, which is a bioactive peptide
formed by the cleavage of κ-casein by chymosin during cheese-making (Dunshea et al.
2007). GMP is believed to be a stimulator of CCK production, thereby increasing satiety
(Burton-Freeman 2008). A variety of other bioactive peptides are formed during whey
digestion and act via receptors in the intestinal lumen and after bloodstream circulation.
These peptides are believed to play beneficial roles in blood pressure, anti-inflammatory
pathways, hyperglycemia, and satiety (Luhovyy, Akhavan, and Anderson 2007).
Whey protein has found its functional niche in nutritional supplements, supporting
muscle growth, post-workout recovery, and satiety. This is due to the speed of protein
digestion: in comparison to casein, whey is metabolized and available for protein synthesis in
a much shorter time period (Luhovyy, Akhavan, and Anderson 2007). The biological value
14
of whey protein, which describes the body’s ability to utilize dietary protein, exceeds that of
other proteins: surpassing egg by 15% and meat and soy by 35% (Smithers 2008). The satiety
and muscle-building capacity of whey protein is due to short-term increases in blood amino
acid levels, which are higher than casein within two hours of consumption (Boirie et al.
1997). The increase in amino acid circulation signals satiety to the brain and also increases
amino acid availability for protein synthesis. Whey protein contains all of the essential amino
acids and has a high protein efficiency ratio, a description of protein quality. However, its
nutritional and bioactive benefits may be attributable to its unique amino acid composition.
In comparison to others, whey proteins are much higher in the branched chain amino acids
(BCAA) valine, leucine, and isoleucine. Of particular interest is L-leucine, which enters the
blood stream faster than other amino acids and activates the mammalian target of rapamycin
receptor (mTOR) signaling pathway. This receptor regulates protein synthesis and maintains
lean body mass during times of energy deficit (Layman and Walker 2006). A comparison of
BCAAs in dietary proteins is shown in Table 1.2.
Table 1.2. Comparison of leucine and total branched chain amino acid (BCAA) content of
various dietary proteins. Expressed in g amino acids/100 g total protein.
Amino acid content
(g amino acids/100 g protein)
Protein
Leucine
BCAA
Whey protein isolate
14%
26%
Milk protein isolate
10%
21%
Casein
9%
20%
Egg protein
8.5%
20%
Muscle protein
8%
18%
Soy protein isolate
8%
18%
(Hulmi, Lockwood, and Stout 2010, “Nutritional Benefits of Dairy Ingredients" 2010)
15
Katsanos et al. (2006) investigated the effects of leucine supplementation upon
muscle protein synthesis in both young and elderly populations. Rates of muscle synthesis
increased significantly in elderly patients after consumption of a 41% leucine amino acid
mixture and in young patients after both 26% and 41% leucine supplementation. Leucine has
also been found to regulate leptin secretion in vitro through the mTOR-signaling pathway
(Lynch et al. 2006). Oral gavage of rats with leucine or norleucine increased plasma leptin
concentrations, but not to the same extent as a meal feeding. A meal lacking leucine reduced
leptin synthesis by 40% in comparison to a control meal; no reductions in leptin were
observed in subsequent meals lacking branched-chain amino acids or all amino acids (Lynch
et al. 2006). Adipose tissue also plays a major role in BCAA metabolism, indicated by a
faster amino acid oxidation rate than in skeletal muscle (Herman et al. 2010). Obese and
insulin-resistant individuals show reduced BCAA adipose metabolism, attributed to
overexpression of the insulin-mediated glucose transporter-4 (GLUT-4). Leptin is only one
indicator of satiety, so it remains unclear whether or not individual amino acids play a
significant role in determining satiety.
In addition to its contribution to muscle anabolism and satiety, whey protein may also
decrease plasma lipid levels and improve body composition. Pal et al. (2010) found that
when compared to casein or glucose, whey protein supplementation lowered total cholesterol
and LDL cholesterol levels after 12 weeks of treatment. Whey protein consumption also
improved insulin resistance but did not significantly change body composition or glucose
levels in obese patients (Pal, Ellis, and Dhaliwal 2010). Whey protein has also been shown to
counteract the effects of high fat diets. Whey supplementation reduced fat mass and
16
prevented increases in leptin and insulin expression when compared to casein (McAllan et al.
2013). However, Noatsch et al. (2011) found no significant differences in body weight or
body composition in mice fed whey protein or leucine-supplemented diets but did observe
decreases in plasma triglycerides in the protein-supplemented diets.
Whey protein has also been shown to control or mitigate symptoms of metabolic
syndrome. Nilsson et al. (2007) showed that in addition to its impact upon satiety, the
specific amino acid composition of whey protein may be responsible for its insulinotropic
benefits. Drinks fortified with varying ratios of amino acids had different effects upon
insulin and glucose levels. Those drinks containing the BCAAs leucine, isoleucine, and
valine, as well as lysine and threonine, decreased plasma glucose by 44% and increased
insulin production by 31%. This amino acid mixture showed similarities to an identical drink
containing whey protein, which decreased glucose levels by 56% and increased insulin levels
by 60% (Nilsson, Holst, and Björck 2007). However, this study did not find that the BCAA
mixture stimulated satiety to the same extent as whey protein. This may be explained by the
faster absorption of BCAA into the blood stream or to the activity of bioactive peptides
found in whey proteins.
Because whey proteins isolates can be formulated with and without GMP, numerous
studies have investigated the effects of GMP on satiety. Royle et al. (2008) found that a
GMP-supplemented whey protein diet slightly decreased weight gain in rats when compared
with whey alone. GMP-whey intake also decreased insulin and triacylglyceride serum levels
(Royle, McIntosh, and Clifton 2007). The researchers postulated that 70% of the weight
control benefits could be attributed to whey protein while GMP was responsible for the
17
remaining 30%. Burton-Freeman (2008) and Lam et al. (2009) found that whey proteins
induced slightly more satiety than GMP-supplemented whey proteins. Ad libitum intakes
were decreased in the study by Burton-Freeman (2008) while Lam et al. (2009) demonstrated
no differences in total caloric intake. Research by Veldhorst et al. (2009b) contradicted these
findings, showing that whey proteins without GMP increased insulin levels and ad libitum
intake. While the effects of whey protein and GMP-supplementation are promising, study
inconsistencies suggest that more research is necessary to determine the exact impact and
mechanism of whey proteins upon satiety.
1.4 COCOA
For centuries, mankind has relied upon the natural health benefits of foods containing
polyphenols. Whether the presence of these compounds was known or simply associated
with improved health, entire civilizations have showed reliance upon foods such as green tea
in Asia, fruits and vegetables in the Mediterranean, and chocolate in South and Latin
America. Until very recently in our modern culture, chocolate would never have been
considered a “health food.” Chocolate is generally treated as a novelty or indulgence and is
not usually consumed for its disease-fighting properties. However, within the last decade,
cocoa has been correlated with a decrease in the susceptibility and development of certain
diseases, including cardiovascular disease, insulin resistance, and neurological diseases
(Katz, Doughty, and Ali 2011).
Cocoa and chocolate are derived from beans of the tree Theobroma cacao. After
harvesting, the beans are fermented (enzymatic process) in the field, roasted, crushed, and
18
milled into cocoa liquor, which is then separated into cocoa powder and cocoa butter (Perego
et al. 2004). Cocoa butter contains most of the cocoa lipids while cocoa powder contains
most of the fiber, polyphenols, vitamins, and minerals. Commercial chocolate is made by
combining cocoa liquor with cocoa butter and sugar to make a solid product while cocoa is
simply the ground and dried powder after removal of the cocoa butter (Katz, Doughty, and
Ali 2011). The final polyphenolic content of cocoa depends upon the source of the beans as
well as the processing conditions. Dutch-processed cocoa has been shown to substantially
decrease the flavonoid content of cocoa powder due to is high alkalinity and high
temperatures (Payne et al. 2010).
Though chocolate is considered to have little nutritional value, phenolic compounds
in chocolate have been shown to improve multiple health-related conditions (Katz, Doughty,
and Ali 2011). The major polyphenols in chocolate are flavanols, including (+)-catechin, (-)epicatechin, and the polymers of these compounds, procyanidins. These flavanols are present
in cocoa at higher concentrations than in apples, cranberries, red wine, or black tea (Lee et al.
2003, Steinberg, Bearden, and Keen 2003). Lee et al. (2003) showed that the flavonoid
content and antioxidant activity of cocoa are 4-5 times greater than black tea, 2-3 times
greater than green tea, and 2 times greater than red wine (Lee et al. 2003). The polyphenol
content of cocoa is about 52.4 mg/g while 88% dark chocolate contains 32 mg/g (Steinberg,
Bearden, and Keen 2003, Belščak et al. 2009). Cocoa-containing foods have also been shown
to retain their oxygen radical absorbance capacity (free radical quenching) much longer than
other food products. A sample polyphenolic analysis of a natural cocoa powder is given in
Table 1.3.
19
Table 1.3. Proanthocyanidin content of a standard natural cocoa powder.
Polyphenolic
content
Compound
(mg per g)
Catechin
1.1
Epicatechin
4.5
Total Flavanols (DMAC)
49.0
Proanthocyanidins 1-10 (PAC 1-10)
29.5
PACs 1 mers
5.3
PACs 2 mers
3.5
PACs 3 mers
3.2
PACs 4 mers
3.2
PACs 5 mers
2.6
PACs 6 mers
3.2
PACs 7 mers
3.3
PACs 8 mers
1.2
PACs 9 mers
2.8
PACs 10 mers
1.2
Total proanthocyanidins expressed via 4-dimethylaminocinnamaldehyde (DMAC) analysis or
proanthocyanidin 1-10 analysis. DMAC measures total flavanols (all polymer lengths) while PAC 110 describes only catechin or epicatechin polymers between 1 and 10 units in length.
Analysis courtesy of The Hershey Company
The health benefits of cocoa are most often associated with its polyphenolic
antioxidant activity. The structure of catechins and procyanidins chelate metals and bind free
radicals, preventing oxidative aging reactions in vivo (Jalil and Ismail 2008). Cocoa treatment
in clinical studies has mainly focused on cardiovascular diseases, including its effects upon
low-density lipoproteins, blood pressure, arterial dilation, and platelet aggregation. Multiple
studies, however, have indicated that cocoa consumption can help to diminish the symptoms
of metabolic syndrome, which encompasses diabetes, dyslipidemia, and hypertension (Gu
and Lambert 2013).
In vitro, 1-10 µM epicatechin and 1-10 µg/ml cocoa polyphenolic extract treatment
20
increased insulin receptor activity, insulin signaling, and glucose transport while decreasing
glucose production in HepG2 cells (Cordero-Herrera et al. 2013). In vivo, 0.5% epicatechin
consumption in drinking water (equivalent to 250 g of dark chocolate consumption per day)
decreased the incidence of diabetes by 50% and increased insulin levels in mice (Fu,
Yuskavage, and Liu 2013).
Cocoa extract treatments of 10-30 mg per 100 g body weight and 1-3% of total diet
was shown to lower the plasma glucose, total cholesterol, LDL cholesterol, and triglyceride
levels and to increase HDL cholesterol profiles in diabetic obese mice (Ruzaidi et al. 2008).
Effects were dose-dependent between 1-3% cocoa extract treatments. A four-week cocoa
extract treatment (containing 4 mg total cocoa polyphenols) of obese-diabetic rats lowered
plasma levels of total cholesterol, triglyceride, low-density lipoprotein cholesterol, and
glucose levels (Jalil et al. 2009). No significant changes in insulin levels or insulin sensitivity
were observed.
From the perspective of energy regulation, cocoa consumption has been shown to
regulate body weight and to increase insulin production and sensitivity. In mouse and human
clinical studies, flavonol-rich cocoa or chocolate consumption decreased visceral adipose
accumulation and fatty acid synthesis, increased insulin sensitivity, and lowered short-term
blood glucose and free fatty acid levels (Matsui et al. 2005, Grassi et al. 2008, A. M. Jalil et
al. 2009). 8% cocoa supplementation of a high fat diet was also found to prevent weight gain
and inflammation biomarkers in obese mice (Gu and Lambert 2013). Even in the absence of
substantial cocoa polyphenols, a variety of chocolate flavored desserts increased plasma
21
insulin levels more than the same vanilla or strawberry-flavored foods (Brand-Miller et al.
2003).
Flavan-3-ols vary in their stability and bioavailability throughout digestion.
Monomeric flavan-3-ols and procyanidins are stable through the oral and gastric tracts, with
recovery rates of 85-102% and 97-125%, respectively (Neilson and Ferruzzi 2011).
Procyanidins are often broken into catechin monomers during digestion, accounting for the
increase in recovery. This hydrolysis to monomers also increases their bioavailability in the
intestine (Spencer et al. 2000). However, flavan-3-ols are less resistant to intestinal
breakdown, with green tea flavanol recovery ranging from 1-71% (Record and Lane 2001).
Intestinal absorption of these compounds is also low, with bioavailability estimates ranging
from 0.1-10% (Neilson and Ferruzzi 2011).
Food matrix composition has a significant effect upon the bioavailability and
bioactivity of cocoa. Neilsen et al. (2010) and Rodriguez-Mateos (2012) found that the
incorporation of sucrose in chocolate products increases flavanol bioavailability in vivo,
perhaps by increasing their solubility within the intestine. Chocolate confections with high
milk protein contents were shown to decrease epicatechin bioavailability (Serafini et al.,
2003). Chocolate beverage studies, however, have shown no significant differences in
bioavailability between aqueous and milk-based matrices, though the presence of milk
protein does appear to change flavanol excretion profiles over time (Keogh, McInerney, and
Clifton 2007, Roura et al. 2007, Roura et al. 2008). The presence of lipids also appears to
protect catechins during digestion, decreasing flavanol absorption (Neilson et al. 2009).
22
In regards to food form, research suggests that chocolate beverages may offer
increased flavanol bioavailability over solid chocolate. Neilson et al. (2009) found that
beverages containing sucrose and milk protein or a non-nutritive sweetener and milk protein
significantly increased plasma epicatechin levels when compared to solid chocolate with high
milk protein. This observation could be due to the speed at which beverages travel through
the intestine and gastric emptying time. In addition to formulation, high temperature
processing of cocoa-containing products can decrease bioactive content through
isomerization and auto-oxidation of flavan-3-ols (Neilson and Ferruzzi 2011). Gossai and
Lau-Cam (2009) found an inverse relationship between milk fat content and catechin
absorption when consumed in combination in vivo. Plasma concentrations of catechins postconsumption were greater when consumed with no or low fat dairy (water or skim milk) as
compared with whole milk and heavy cream (Gossai and Lau-Cam 2009).
In addition to matrix, the binding affinity between proteins and polyphenols can also
impact nutrient bioavailability and product appearance and texture. Binding can initiate
precipitation of these compounds in liquids and gels, with phenolic acids exhibiting the
strongest affinity for proteins. Non-covalent bonds formed with β-lactoglobulin have been
shown to remain stable at pH values found in the gastrointestinal tract (Stojadinovic et al.
2013). This binding can also slow protein digestion by pepsin and pancreatin, with
polyphenols protecting protein degradation down to pH 1.2. The anti-oxidant activity of the
polyphenols also decreased when associated with proteins (Stojadinovic et al. 2013). Prolinerich proteins, such as those found in saliva, tend to bind polyphenols strongest due to their
loose tertiary protein structure (Ferruzzi, Bordenave, and Hamaker 2012). These interactions
23
have the capacity to delay increases in plasma amino acids and to further limit the antioxidant activity of bioactive foods.
1.5 FACTORS THAT IMPACT SATIETY
1.5.1 PHYSICAL PROPERTIES OF FOOD
Physical properties of foods, including composition, form, and texture are
determinants have been shown to have a significant impact upon satiety. The time necessary
to chew and swallow food during oral processing is determined by variations in texture. This
combination of chewing intensity and time sends satiety signals sent to the brain, though it is
estimated that after eating, it takes 20 minutes before the stomach and brain register feelings
of fullness (Stewart 2011). Foods that require longer chewing slow the consumption of food
and may help to limit the number of calories consumed before a feeling of fullness is
recognized. A study of oral and gastric stimulation found that both chewing without ingestion
of food and intestinal infusion with liquid decreased ad libitum food intake (Wijlens et al.
2012). Studies comparing the satiation and satiety-inducing effects of specific foods have
found conflicting results. Though it is generally accepted that solid foods provide higher
satiety than liquid foods when total calories and macronutrients are equal, many studies also
indicate that the stomach-filling sensation induced by liquid foods may compensate for the
lack of mastication time (Stull et al. 2008).
The effects of liquid and solid foods upon satiety have been extensively researched. A
comparison of liquid (shake) and solid (bar) meal replacement products found increased
24
hunger, desire to eat, and a 13.4% increase in ad libitum intake after 120 minutes in subjects
who consumed the liquid form (Stull et al. 2008). A second study also found increased
hunger and desire to eat, lower fullness, and increased levels of the hunger hormone ghrelin
after liquid consumption in comparison to its solid counterpart (Leidy, Bales-Voelker, and
Harris 2011). However, food form was not found to impact satiety hormone levels including
glucagon-like peptide (GLP-1), CCK, or leptin (Tieken et al. 2007).
A high-protein solid breakfast was also found to lower appetite and to decrease ad
libitum intake over a high-protein liquid breakfast (Leidy, Bales-Voelker, and Harris 2011).
The consumption of orange or grape juice decreased satiety and increased insulin production
when compared to whole oranges or grapes (Bolton et al. 1981). Research by Mattes et al
(2009) also found that whole apples induced satiety better than applesauce, which in turn was
better than apple juice. Mourau et al. (2007) investigated the changes in appetite and calorie
consumption after solid and liquid foods high in carbohydrates (watermelon and watermelon
juice), protein (cheese and milk), and fat (coconut meat and coconut milk). In all categories,
the solid food form increased satiety more than the liquid form. Consumption of the liquid
form increased total daily caloric intake increased by 12.4, 15, 19% for the carbohydrate,
protein, and fat categories, respectively.
A number of studies of food-induced satiety and hormone production have
contradicted the above studies. Consumption of matched-calorie samples of regular cola and
fat-free cookies found no differences in satiety or ad libitum food intake (Almiron-Roig,
Flores, and Drewnowski 2004). However, cola consumption significantly reduced thirst at an
ad libitum meal. Ingestion of a solid or homogenized form of the same salad components
25
(vegetables, cheese, croutons, olive oil) showed that the homogenized form increased
fullness and satiety, decreased desire to eat, and slowed gastric emptying time and peak
production of cholecystokinin, a gastric satiety peptide (Santangelo et al. 1998). A
subsequent study of the same samples observed that the homogenized form increased insulin
production, glucose-dependent insulinotropic peptide (an endocrine hormone), and body
temperature after consumption over the solid food form (Peracchi et al. 2000). Orange juice
or sweetened fruit drink consumption was also found to have stronger effects upon satiety
suppression compared to rice or spaghetti (Ranawana and Henry 2011). In regard to beverage
composition, Maersk and others (2012) showed that a skim milk-based beverage induced
greater satiety and increased plasma GLP-1 and GIP by 31% and 45%, respectively,
compared to a sugar-sweetened soft drink.
The conflicting results of liquid versus solid satiety studies indicate that the volume
of food consumed as well as its macronutrient composition may influence satiety more than
food form. Bolton et al. (1981) attributed differences in insulin and glucose production to
differences in fiber content between whole fruit and fruit juice. It is also possible that the
effects of food form upon satiety may vary between different nutrients. Solid gelatin and
sweet whey samples induced greater satiety than their liquid counterparts while no
differences were observed in sugar or acid whey samples (Akhavan, Luhovyy, and Anderson
2010).
26
1.5.2 MACROMOLECULAR COMPOSITION OF FOOD
Regarding food composition, specific macronutrients have been shown to have a
more significant impact in increasing satiety and decreasing overall calorie intake. Protein
and fiber in particular seems to be determining factors of post-meal satiety (Veldhorst et al.
2008, Benelam 2009). The USDA recommends that healthy diets provide 0.66 g/kg/day for
adults, or approximately 46 g/day for women and 56 g/day for men (Food and Nutrition
Board 2013). These encompass about 10-35% of total daily caloric intake. However,
extensive research indicates that protein consumption at levels higher than these
recommendations can induce greater satiety and limit overall daily calorie intake.
When meals are varied in protein, carbohydrate, and fat percentage, most studies
show that meals higher in protein induce greater satiety and reduce ad libitum intake. A 12week comparison of 15 and 30% protein diets (keeping carbohydrate constant and varying
lipid content) showed higher satiety ratings, decreased ad libitum intake, and average weight
loss of 4.9 kg for subjects on the high protein diet (Weigle et al. 2005). A 10 and 30% protein
comparison showed increased satiety and decreased hunger, though the total calories
consumed were identical (Lejeune et al. 2006). Veldhorst et al. (2009a) also found that
breakfasts containing 25% calories from protein from casein, whey, or soy induced greater
satiety than their 10% protein counterparts. In general, it has been shown that diets consisting
of greater than 30% calories from protein induce satiety and decrease food intake better than
lower protein diets (M. Veldhorst et al. 2008). Pasiakos et al. (2013) showed that variations
in protein consumption did not affect weight loss but that higher protein consumption (2-3
27
times the recommended dietary allowance) increased overall fat loss and improved body
composition.
Protein metabolism has been shown to increase satiety by diet-induced
thermogenesis, to improve body composition, and to decrease energy efficiency (WesterterpPlantenga et al. 2006). The satiety induction provided by protein requires fewer grams and
calories than that obtained from carbohydrates or lipids, thereby reducing total calorie intake
and speeding weight loss and maintenance. This satiety may be attributed to an increase in
plasma levels of the satiation hormone GLP-1 (Westerterp-Plantenga et al. 1999, Lejeune et
al. 2006). Protein consumption also appears to increase fat-free mass during weight gain or
maintenance (Westerterp-Plantenga et al. 2006). While it is apparent that protein induces
greater satiety than lipids or carbohydrates, there is no uniform agreement on the percent of
daily protein calories necessary for significant protein-induced satiety (Benelam 2009).
Comparisons between protein sources are also generally inconclusive. Various
metabolic evaluations of animal and plant proteins have shown both large differences and no
difference in satiety-inducing capacity. Clinical trials by Lang et al. (1998) found no
differences between egg albumin, casein, gelatin, soy protein, pea protein, and wheat gluten
on satiety. Aldrich et al. (2011) also found no significant differences in weight loss, fat loss,
or satiety ratings between subjects fed low protein, whey protein, or mixed protein diets.
However, the whey protein diet induced greater regional fat loss and lowered blood pressure
(Aldrich et al. 2011).
Of those studies that indicate differences between specific proteins, whey, pea, and
soy may be the most promising in increasing satiety. Anderson et al. (2004) found that whey
28
and soy proteins increased satiety and decreased food intake over egg albumen and sucrose.
In a clinical study of protein-fortified shakes, whey or pea protein hydrolysate increased
satiety and fullness more than milk or a combination of whey and pea proteins (Diepvens,
Häberer, and Westerterp-Plantenga 2007). Milk protein treatment had the greatest effect
upon satiety hormones GLP-1 and CCK production while the whey/pea combination
increased PYY to the greatest extent. Overall, pea protein showed the greatest satiety,
decreasing both hunger scores and ghrelin production (Diepvens, Häberer, and WesterterpPlantenga 2007).
However, pea and casein beverage preloads decreased food intake more than whey or
egg proteins when consumed 30 minutes before a meal but no differences in caloric intake
were observed when the same preloads were eaten as an appetizer before a meal (AbouSamra et al. 2011). Pal and Ellis (2010) found that a whey protein meal increased satiety and
plasma insulin response and decreased ad libitum intake at a subsequent meal when
compared to tuna, turkey, and egg albumin. Though whey, pea, and soy proteins may have
greater effects upon overall satiety, it is clear that all proteins influence satiety ratings, total
caloric intake, plasma amino acid levels, and hunger hormones to different degrees.
Direct comparisons of milk-specific proteins have found that whey protein decreases
ad libitum food intake by 19% and increases satiety ratings when compared to casein (Hall et
al. 2007). Whey also increased postprandial plasma amino acid, CCK, and GLP-1 levels by
28%, 60%, and 65%, respectively, above that of casein (Hall et al. 2007). 10% whey-based
breakfast custards were more satiating than those prepared with casein or soy, but no
differences in satiety or energy intake were observed at a 25% protein level (Veldhorst et al.
29
2009). The 25% whey protein custard showed the largest increase in GLP-1 and insulin
levels. Pichon et al. (2007) showed that whey proteins were more effective than whole milk
protein in limiting weight gain and increasing insulin and leptin levels in rats fed high-protein
diets. β-lactoglobulin in particular decreased adiposity more than when part of a mixture of
whey protein or casein (Pichon et al. 2007).
Mellinkoff et al. (1997) postulated that increases in plasma amino acid levels are
associated with higher satiety and reduction in appetite. If true, this provides a distinction
between macronutrients in regards to weight loss: fewer protein calories could initiate the
same level of satiety as greater quantities of carbohydrates or lipids calories. In mice,
increases in plasma amino acids that were not destined for protein synthesis increased satiety,
while an increase in appetite was accompanied by decreases in plasma amino acids. Morrison
et al. (2007) found that intracerebroventricular injections of a mixture of amino acids or
leucine alone reduced caloric intake in mice over 24 hours. This effect was attributed to
amino acid stimulation of the mammalian target of rapamycin signaling (mTOR) pathway,
which regulates insulin signaling and muscle synthesis (Morrison et al. 2007).
Accordingly, researchers have suggested that specific protein sources and their
distinctive amino acid ratios may play different roles in satiety. Ingestion of whey protein
increased plasma leucine, lysine, tryptophan, isoleucine, and threonine more than casein or
soy (Veldhorst et al. 2009). A clinical comparison of whey protein consumption found no
differences in plasma amino acid levels after WPI or β-lactoglobulin-enriched WPI, but
found that both these WPI forms increased plasma leucine and branched chain amino acid
levels above that of hydrolyzed WPI (Farnfield et al. 2009). Another study showed that
30
inclusion of GMP in a WPI-based breakfast increased plasma serine, threonine, alanine,
alpha-aminobutyric acid and isoleucine, indicating that GMP could play a role in amino acid
metabolism and satiety (Veldhorst et al. 2009).
1.5.3 MICROMOLECULAR COMPOSITION OF FOOD
A limited amount of research has indicated that micronutrients such as polyphenolic
compounds can also contribute to satiety and fat metabolism. Polyphenols bind strongly to
proteins and have been shown to bind digestive enzymes in vitro, demonstrating their
potential to slow digestion and nutrient metabolism. Tannins in cocoa, pomegranate,
cranberry, and grape extracts inhibited both α-amylase and glucoamylase while cocoa
extracts and cocoa procyanidins inhibited α-amylase, pancreatic lipase, and secreted
phospholipase A2 activity (Gu et al. 2011, Barrett et al., 2013). In vivo, green tea catechins
were also shown to increase satiety and fullness and to limit lipid nutrient absorption by
inhibiting pancreatic phospholipase A2 (Wang, Noh, and Koo 2006, Josic et al. 2010).
Extensively polymerized polyphenols such as cranberry and pomegranate appear to more
effectively bind these digestive enzymes and decrease their activity (Barrett et al. 2013).
Chocolate-specific human clinical studies show that in a comparison of dark and milk
chocolate, consumption of polyphenol-rich dark chocolate decreased hunger ratings and ad
libitum intake by 17% and increased satiety more than milk chocolate (Sørensen and Astrup
2011). Eating or simply smelling chocolate also increased satiety, though smelling had no
effect upon biomarkers of hunger and satiety (Massolt et al. 2010). The comparison of
chocolate and yogurt snacks before a meal found increased fullness ratings after eating
31
yogurt, which is higher in protein (Chapelot and Payen 2009). However, the duration of
satiety was similar between both foods and there was no difference in ad libitum intake at the
next meal. In obese-diabetic rats, treatment with cocoa extract was found to significantly
reduce plasma glucose, free fatty acid, and oxidative stress biomarker levels as well as to
increase the activity of the antioxidant enzyme superoxide dismutase in the hours following
treatment (Jalil et al. 2008). No differences in fasting glucose or insulin levels were observed
after four-months of treatment.
1.6 3T3-L1 PRE-ADIPOCYTES AS A MODEL FOR SATIETY AND WEIGHT
MANAGEMENT
Preventing obesity involves both a reduction in food consumption (impacted by
satiety) and an increase in energy expenditure, both of which serve to decrease overall body
fat mass. White adipose tissue is the major energy reserve within the human body, in which
energy is stored as triacylglycerol. These tissues grow and shrink with changing caloric
intake and influence the lipid metabolism of surrounding cells as well as the endocrine satiety
and hunger signals sent to the central nervous system (Hwang et al. 1997). An over
abundance of energy signals adipocytes to increase their storage of triacylglycerol and when
a storage limit is reached, these mature fat cells signal the conversion of pre-adipocytes into
mature adipocytes (Harmon and Harp 2001). 50% of mature fat cells are replaced every eight
years (Moreno-Navarrete and Fernández-Real 2012).
This communication between undeveloped and mature adipocytes accommodates the
demand for excess energy storage. New adipocytes form and change size throughout our
32
lifetimes and adipocytes have been found to be larger and more prevalent in obese
individuals (Harmon and Harp 2001). Mature adipocytes account for only one-third of body
fat mass. The remaining two-thirds are small mesenchymal stem cells, T regulatory cells,
endothelial precursor cells, macrophages, and preadipocytes (Moreno-Navarrete and
Fernández-Real 2012).
In vitro, the effects of dietary molecules upon fat accumulation, lipid metabolism, and
biomarkers of satiety are studied using pre-adipocyte cell lines including 3T3-L1, 3T3F442A, and Ob17. A common model is the 3T3-L1 pre-adipocyte, derived from a subclone
of Swiss 3T3a mice (ATCC 2013). These cells are considered pre-adipocytes because they
have undergone commitment to the adipocyte cell type but do not express adipocyte genes.
In the pre-adipocyte state, they are adherent to growth flasks and plates and exhibit a
fibroblast morphology (ATCC 2013). The transformation from pre-adipocyte to adipocyte,
called differentiation or adipogenesis, can be spontaneous or induced and significantly affects
cell morphology and gene expression. After differentiation, cells become circular and
monovacuolar, acquire a large, central lipid droplet, and begin to express adipocyte-specific
genes. Because only adipocytes produce leptin, these cell lines are also powerful models for
understanding satiety and energy balance. However, in vitro, these cells lack the paracrine
and endocrine signaling abilities that exist in vivo. Due to this, it is believed that adipocytes
in vitro express only 1% of the total leptin expressed in vivo, somewhat limiting their use as a
model of fat mass in vivo (MacDougald et al. 1995). However, conclusions can be
extrapolated from in vitro observations and these cell lines serve as an adequate initial
indication of adipocyte response to specific environmental conditions.
33
Induced differentiation of 3T3-L1 cells in vitro is accomplished by treatment of preadipocytes with specific compounds added to their growth media. After growing past
confluence for two days, cells are treated with 3-isobutyl-1-methylxanthine, dexamethasone,
and insulin for 48 hours followed by treatment with insulin for 48 hours. As previously
mentioned, the insulin and leptin pathways are parallel, so cellular treatment with insulin
effectively upregulates leptin gene expression, further encouraging differentiation. This is
followed by growth in regular growth medium (Dulbecco’s modified eagle medium, 10%
fetal bovine serum, 1% penicillin/streptomycin) for 48 hours until 70-80% of cells exhibit
mature adipocyte morphologies. The differentiation cocktail inhibits production of
preadipocyte factor 1, a transmembrane protein that inhibits adipogenesis and that is only
produced by pre-adipocytes (Moreno-Navarrete and Fernández-Real 2012). The
differentiation process also increases intracellular cAMP levels, activating adipocyte gene
expression and converting pre-adipocytes to mature adipocytes with increased paracrine (cell
to cell) and endocrine (long distance cell to environment) communication in vivo (Gregoire,
Smas, and Sul 1998, Moreno-Navarrete and Fernández-Real 2012).
Differentiation occurs in three steps: 1. growth arrest, 2. clonal expansion, and 3.
expression of adipocyte genes and terminal differentiation (Hwang et al. 1997, Gregoire,
Smas, and Sul 1998). Growth arrest occurs as cells grow to confluence, or until an even layer
of cells and cell-to-cell contact is achieved. 3T3-L1 cells then undergo one to two rounds of
division. It is suggested that the unwinding of DNA during division allows transcription
factors to both silence and activate more than 2,000 genes that regulate pre-adipocyte and
adipocyte functions (Moreno-Navarrete and Fernández-Real 2012). Changes in morphology
34
and adipocyte-specific gene expression are activated by the transcription factors peroxisome
proliferator-activated receptor-γ (PPAR- γ), CCAAT/enhancer binding protein-α (C/EBP- α),
and sterol regulatory element-binding protein-1c (SREBP-1c) (Gregoire, Smas, and Sul
1998).
During terminal differentiation, enzymatic activity involved in fatty acid synthesis
and degradation increases by 10-100 times (Gregoire, Smas, and Sul 1998). Adipocytes also
become increasingly more sensitive to insulin and begin to secrete peptides including leptin,
adipsin, adiponectin, and resistin, all of which have effects upon energy metabolism and
storage (Moreno-Navarrete and Fernández-Real 2012). This increase in enzymatic activity,
protein synthesis and peptide secretion converts adipocytes into an endocrine organ with
increased sensitivity and control of energy storage and metabolism. Figure 1.2 depicts the
stages of pre-adipocyte differentiation and the changes occurring at each step.
Figure 1.3. Stages of pre-adipocyte differentiation.
(Hwang et al. 1997, Gregoire, Smas, and Sul 1998, Moreno-Navarrete and Fernández-Real 2012)
35
Inhibiting the process of adipogenesis with bioactive compounds found in food could
have profound effects upon overall body fat mass, health, and quality of life. Various
polyphenolic compounds, including catechins, anthocyanins, and isoflavones, have been
shown to inhibit fat cell growth and to increase hunger hormone secretion in vitro and in
vivo. Treatment of 3T3-L1 pre-adipocytes with curcumin, a polyphenol found in turmeric,
inhibited lipid accumulation by 50-80% at concentrations from 10-16.1 µM and 100% at 2530 µM (Ahn et al. 2010, Kim et al. 2011). Expression of C/EBP-β, PPAR-γ, C/EBP-α, leptin,
adiponectin, and resistin were also lower in cells treated with curcumin throughout the
differentiation. Fatty acid metabolism in curcumin-treated cells also increased in a dose
dependent manner between 5-20 µM. In vivo, mice fed high fat diets supplemented with
curcumin for 12 weeks acquired less body weight and fat and exhibited lowered free fatty
acid, cholesterol, and triglyceride plasma levels (Ejaz et al. 2009).
Polyphenolic compounds found in tea and fruits, mainly catechins, anthocyanins, and
their derivatives, have recently gained attention due to their anti-oxidant, anti-inflammatory,
and cancer-fighting properties. Green tea in particular contains high levels of
epigallocatechin and has been linked with these benefits. (-)-Epigallocatechin-3-gallate
(EGCG) treatment of 3T3-L1 cells decreased cell growth by 40.5% at 10 µM and inhibited
lipid accumulation by 43.3%, 57%, and 55% when cells were treated during the initial
growth phase, during differentiation, and post-differentiation, respectively (Chan et al. 2011).
C/EBP-α, PPAR-γ, and forkhead transcription factor class O1 (FoxO1) expression are also
suppressed by EGCG concentrations between 1-100 µM (Chan et al. 2011, Kim and
36
Sakamoto 2012). Kim et al. (2010) also found that EGCG treatment reduced glycerol-3phosphate dehydrogenase activity, an enzyme involved in lipid synthesis, and SREBP-1c.
Beyond treatment with pure polyphenolic compounds, Söhle et al. (2009) found that
treating human pre-adipocytes in vitro with 0.1%, 0.25%, 0.5% or 0.75% white tea extract
decreased lipid accumulation by up to 70%. Tea treatment also decreased mRNA levels of
C/EBP-α, C/EBP-δ, and PPAR-γ as well as mRNA and protein levels of ADD1/SREBP-1c
(Söhle et al. 2009). In vivo, EGCG supplementation of a high fat diet in mice limited body fat
gain and decreased leptin, SREBP-1c, fatty acid synthase (FAS), and stearoyl-CoA
desaturase-1 (SCD-1) gene expression in white fat (Klaus et al. 2005, Park et al. 2011). This
is indicative of a lower fat mass (lower leptin expression) and decreased fatty acid synthesis
by FAS and SCD-1.
3T3-L1 treatment with 250-400 µg/ml grape skin extract produced 50% and 77%
decreases in pre-adipocyte and adipocyte lipid accumulation (Jeong et al. 2012, Zhang et al.
2012). Grape skin extract also reduced glycerol-3-phosphate dehydrogenase activity, levels
of transcription factors C/EBP-α, PPAR-γ, and SREBP1, adiponectin secretion, and lipolysis
enzymes. Cell treatment with 10 µM resveratrol, the major polyphenol in grapes, and its
metabolites inhibited lipid accumulation by 32-60% and lowered C/EBP-α, C/EBP- β,
PPAR-γ, lipoprotein lipase (LPL), and GLUT-4 expression (Mercader, Palou, and Bonet
2011, Lasa et al. 2012). Resveratrol metabolites showed similar effects in pre-adipocytes.
Blueberry polyphenolic extract also inhibited lipid accumulation in 3T3-F442A preadipocytes by 27%, 63%, and 74% at 150, 200, and 250 µg/ml, respectively (Moghe et al.
2012). In vivo, grape seed extract decreased abdominal fat accumulation by 29% in hamsters
37
fed a high fat diet as compared to high fat diet controls (Décordé et al. 2009). The grape seed
extract also slightly mitigated increases in plasma glucose levels and insulin resistance
observed in the controls.
While the general effect of polyphenolic compounds upon adipogenesis in vitro and
in vivo is clear, little specific research exists on cocoa polyphenols. High in catechin,
epicatechin, and procyanidins, these compounds have similar anti-oxidant activity of those
previously tested. The only existing study found that cocoa polyphenol extract treatment of
3T3-L1 cells at 100 or 200 µg/ml inhibited adipogenesis by 30% and 72%, respectively (Min
et al. 2012). This correlated with reduced expression of C/EBP-α, PPAR-γ, and FAS and
inhibition of the insulin receptor by polyphenolic binding. Reduced clonal expansion was
shown by a reduction in extracellular signal-regulated kinase (ERK) and protein kinase B
(Akt), critical in signaling cascades for proliferation (Min et al. 2012). In mice, the same
authors found that cocoa polyphenol extract supplementation of a high fat diet reduces fat
accumulation by 5.8% and 12.6% at 40 and 200 mg/kg, respectively, when compared to a
high fat diet control. Treatment of HepG2 and Caco2 cells with cocoa polyphenols increased
apolipoprotein (a major constituent of high density lipoprotein), SREBP levels, and mRNA
expression (Yasuda et al. 2011). This indicates that cocoa polyphenols may help to
upregulate HDL, or good cholesterol, levels within the body.
Leptin production is dependent upon many paracrine and endocrine factors in vivo but
is believed to be under partial control of the mammalian target of rapamycin receptor
(mTOR) (Szkudelski 2007). This receptor is found in a variety of cell types and is believed to
play a role in obesity, diabetes, and cancer (Dann, Selvaraj, and Thomas 2007). mTOR is a
38
major regulator of cellular growth and homeostasis, including anabolic pathways and leptin
secretion. mTOR consists of two complexes, only one of which is activated by nutrients and
dietary components. This nutritionally-relevant complex is inhibited by rapamycin and
activated by insulin through the secondary messenger phosphatidylinositol 3-kinase. This
partially explains the induction of adipogenesis and lipogenesis in adipocytes by insulin
(Cammisotto et al. 2006, Szkudelski 2007, Zeigerer et al. 2008). Increases in ATP and
malonyl-CoA are known to increase leptin secretion while increases in intracellular cAMP
and fatty acid concentrations may inhibit secretion (Szkudelski, Nowicka, and Szkudelska
2005, Szkudelski 2007).
Roh et al. (2003) suggests that adipocytes pre-synthesize and store leptin and that
secretion is then controlled by a variety of dietary and signaling factors that act to maintain
energy homeostasis. However, insulin treatment of adipocytes in vitro does not change leptin
mRNA levels, suggesting that insulin is not the sole regulator of leptin production or
secretion (Bradley and Cheatham 1999, Roh et al. 2003). In addition to insulin, the mTOR
pathway is sensitive to certain nutrients, but nutrient stimulation varies between cell types
(Lynch 2001, Roh et al. 2003, Lynch et al. 2006).
Free L-leucine appears to play an important role in adipocyte mTOR activation and
its regulation of protein synthesis (Avruch et al. 2008). These effects are independent of
insulin and act through a different mTOR mechanism but both compounds are believed to act
synergistically: insulin promotes leucine binding and leucine increases insulin secretion
(Avruch et al. 2008). At much higher concentrations, amino acids with structural similarities
to leucine also activate mTOR. Norleucine has shown the highest effectiveness, followed by
39
isoleucine, threo-L-β-hydroxyleucine, methionine and valine (Lynch 2001). Though leptin
secretion and the mTOR pathway have many effectors, this mechanism may provide an
explanation for the influence of dietary compounds and plasma leptin levels on satiety (Roh
et al. 2003).
Roh et al. (2003) found that treatment of adipocytes with 5 mM leucine increased
leptin secretion 4-5 fold within four hours of treatment. Cammisotto et al. (2006) showed that
leucine and glutamate increases leptin secretion by almost 2-fold and slightly increased
intracellular leptin content. Leucine treatment also increased fatty acid oxidation in muscle
cells and lowered fatty acid synthesis (Sun and Zemel 2007). In obese rats, serum
adiponectin, which regulates fatty acid breakdown, was increased while total cholesterol was
reduced after leucine supplementation (Torres-Leal et al. 2011). Leucine treatments of rats in
meal form found increases in plasma leptin that peaked three hours post-meal. Leptin
secretion decreased by 40% in rats fed leucine-deficient meals (Lynch et al. 2006). Oral
gavage of leucine and norleucine also increased plasma leptin concentrations, but not to the
same extent as when incorporated into a meal.
The presence of other macromolecular nutrients also influences leptin production.
Cammisotto et al. (2005) showed that in adipocytes in vitro, the presence of glucose was
correlated with the maintenance of basal leptin and slight increases in leptin secretion.
However, high glucose levels did not increase leptin production beyond that of low glucose
treatment (Cammisotto et al. 2005). Treatment with insulin or amino acids strongly increased
leptin synthesis: insulin doubled leptin production in the presence of glucose while the
effects of individual amino acids varied (Cammisotto et al., 2005, Cammisotto and Bendayan
40
2007). L-glycine and L-alanine maintained basal leptin production but did not contribute to
increased leptin secretion in the presence of insulin. L-aspartate, L-valine, L-methionine, Lphenylalanine, and L-leucine increased leptin production in the presence of both insulin and
glucose and all but L-leucine increased leptin levels in the presence of only insulin
(Cammisotto et al. 2005). L-glutamate increased leptin production without insulin or glucose.
In addition, it was found that these dietary substrates must be broken down in order to induce
leptin secretion.
The same group also demonstrated that the presence of free fatty acids in the blood
has no effect on leptin secretion. They did find, however, that the intracellular lipolysis of fat
stores due to stress or lack of food intake inhibits leptin secretion (Cammisotto and Bendayan
2007). It follows that this lack of leptin production in times of low food intake correlates with
low satiety and an increase in feelings of hunger.
Research indicates that a variety of polyphenolic compounds have significant effects
upon adipogenesis and adipocyte gene expression. Specifically, Min et al. (2012) has shown
that cocoa polyphenols inhibit in vitro cellular lipid accumulation by reducing expression of
the transcription factors PPAR-γ and CEBP-α and by directly binding to the insulin receptor.
Insulin appears to play a key role in the regulation of leptin secretion. Thus, it is possible that
cocoa polyphenols could act as a ligand to influence the mTOR signaling pathway:
upregulating leptin secretion and increasing satiety.
In addition, leucine appears to play a role in mTOR regulation of leptin secretion and
contributing to overall satiety (Lynch et al. 2006, Torres-Leal et al. 2011). However, in vitro
studies investigating the effects of BCAAs upon leptin secretion have only been conducted in
41
the absence of other major nutrients. This does not adequately examine the effects of
BCAAs, as cells may react differently if deprived of an essential nutrient such as glucose or
specific amino acids. In in vivo and clinical studies, protein and amino acids make up only a
portion of the experimental diet. Thus, the effects of increases in dietary protein are tested as
a supplement to overall food intake.
Accordingly, research is lacking in two major areas surrounding the effects of cocoa
and BCAAs upon satiety. Currently, no research exists on the effects of cocoa polyphenolics
upon leptin production in vitro or in vivo. Also, no in vitro studies have investigated the
effects of BCAA supplementation of standard growth media upon leptin secretion. The
combinatorial effects of whey protein and cocoa upon lipid accumulation and leptin secretion
are also unknown. This project aims to provide insight into the following areas while
simulating real-world conditions as accurately as possible. This will be done by determining:
1. The in vitro effects of cocoa polyphenolics on lipid accumulation and leptin
secretion of pre-adipocytes and adipocytes
2. The in vitro effects of branched chain amino acid supplementation on leptin
secretion of adipocytes
3. The effects of a chocolate whey protein-based beverage on satiety ratings, blood
glucose levels, and plasma leptin and adiponectin levels in a human clinical trial
42
1.7 REFERENCES
Abou-Samra, Rania, Lian Keersmaekers, Dino Brienza, Rajat Mukherjee, and Katherine
Macé. 2011. “Effect of Different Protein Sources on Satiation and Short-Term Satiety
When Consumed as a Starter.” Journal of Nutrition 10: 139.
Ahn, J., H. Lee, S. Kim, and T. Ha. 2010. “Curcumin-Induced Suppression of Adipogenic
Differentiation Is Accompanied by Activation of Wnt/ -Catenin Signaling.” Cell
Physiology 298 (6): C1510–C1516.
Akhavan, T., B. L. Luhovyy, and G. H. Anderson. 2010. “Effect of Drinking Compared with
Eating Sugars or Whey Protein on Short-Term Appetite and Food Intake.”
International Journal of Obesity 35 (4): 562–69.
Aldrich, Noel D., Marla M. Reicks, Shalamar D. Sibley, J. Bruce Redmon, William Thomas,
and Susan K. Raatz. 2011. “Varying Protein Source and Quantity Do Not
Significantly Improve Weight Loss, Fat Loss, or Satiety in Reduced Energy Diets
among Midlife Adults.” Nutrition Research 31 (2): 104–12.
Almiron-Roig, Eva, Sonia Y. Flores, and Adam Drewnowski. 2004. “No Difference in
Satiety or in Subsequent Energy Intakes between a Beverage and a Solid Food.”
Physiology & Behavior 82 (4): 671–77.
Asp, Elaine H. 1999. “Factors Affecting Food Decisions Made by Individual Consumers.”
Food Policy 24 (2): 287–94.
Avruch, J., X. Long, S. Ortiz-Vega, J. Rapley, A. Papageorgiou, and N. Dai. 2008. “Amino
Acid Regulation of TOR Complex 1.” AJP: Endocrinology and Metabolism 296 (4):
E592–E602.
Barrett, Ann, Tshinanne Ndou, Christine A. Hughey, Christine Straut, Amy Howell, Zifei
Dai, and Gonul Kaletunc. 2013. “Inhibition of Α-Amylase and Glucoamylase by
Tannins Extracted from Cocoa, Pomegranates, Cranberries, and Grapes.” Journal of
Agricultural and Food Chemistry 61 (7): 1477–86.
Beglinger, Christoph, and Lukas Degen. 2006. “Gastrointestinal Satiety Signals in Humans
— Physiologic Roles for GLP-1 and PYY ?” Physiology & Behavior 89 (4): 460–64.
Belščak, Ana, Draženka Komes, Dunja Horžić, Karin Kovačević Ganić, and Damir Karlović.
2009. “Comparative Study of Commercially Available Cocoa Products in Terms of
Their Bioactive Composition.” Food Research International 42 (5-6): 707–16.
43
Benelam, B. 2009. “Satiation, Satiety and Their Effects on Eating Behaviour.” Nutrition
Bulletin 34 (2): 126–73.
Boirie, Yves, Martial Dangin, Pierre Gachon, Marie-Paule Vasson, Jean-Louis Maubois, and
Bernard Beaufrère. 1997. “Slow and Fast Dietary Proteins Differently Modulate
Postprandial Protein Accretion.” Proceedings of the National Academy of Sciences 94
(26): 14930–35.
Bradley, Richard L., and Bentley Cheatham. 1999. “Regulation of Ob Gene Expression and
Leptin Secretion by Insulin and Dexamethasone in Rat Adipocytes.” Diabetes 48 (2):
272–78.
Brand-Miller, Jennie, Susanna H.A. Holt, Vanessa de Jong, and Peter Petocz. 2003. “Cocoa
Powder Increases Postprandial Insulinemia in Lean Young Adults.” The Journal of
Nutrition 133 (10): 3149–52.
Burton-Freeman, Britt M. 2008. “Glycomacropeptide (GMP) Is Not Critical to WheyInduced Satiety, but May Have a Unique Role in Energy Intake Regulation through
Cholecystokinin (CCK).” Physiology & Behavior 93 (1-2): 379–87.
Cammisotto, P.G., and Moise Bendayan. 2007. “Leptin Secretion by White Adipose Tissue
and Gastric Mucosa.” Histology and Histopathology 22: 199-210.
Cammisotto, P.G., Yves Gelinas, Yves Deshaies, and Ludwik J. Bukowiecki. 2005.
“Regulation of Leptin Secretion from White Adipocytes by Insulin, Glycolytic
Substrates, and Amino Acids.” AJP: Endocrinology and Metabolism 289 (1): E166–
E171.
Cammisotto, Philippe G., Ludwik J. Bukowiecki, Yves Deshaies, and Moise Bendayan.
2006. “Leptin Biosynthetic Pathway in White Adipocytes.” Biochemistry and Cell
Biology 84 (2): 207–14.
Castañeda, T.R., J. Tong, R. Datta, M. Culler, and M.H. Tschöp. 2010. “Ghrelin in the
Regulation of Body Weight and Metabolism.” Frontiers in Neuroendocrinology 31
(1): 44–60.
Chan, Cheuk Ying, Lai Wei, Federico Castro-Muñozledo, and Wing Leung Koo. 2011. “(−)Epigallocatechin-3-Gallate Blocks 3T3-L1 Adipose Conversion by Inhibition of Cell
Proliferation and Suppression of Adipose Phenotype Expression.” Life Sciences 89
(21-22): 779–85.
44
Chapelot, Didier, and Flore Payen. 2009. “Comparison of the Effects of a Liquid Yogurt and
Chocolate Bars on Satiety: A Multidimensional Approach.” British Journal of
Nutrition 103 (05): 760.
Cordero-Herrera, Isabel, María Angeles Martín, Laura Bravo, Luis Goya, and Sonia Ramos.
2013. “Cocoa Flavonoids Improve Insulin Signalling and Modulate Glucose
Production via AKT and AMPK in HepG2 Cells.” Molecular Nutrition & Food
Research 57 (6): 974–85.
Dann, Stephen G., Anand Selvaraj, and George Thomas. 2007. “mTOR Complex1–S6K1
Signaling: At the Crossroads of Obesity, Diabetes and Cancer.” Trends in Molecular
Medicine 13 (6): 252–59.
De Graaf, Cees, Wendy A.M. Blom, Paul A.M. Smeets, Annette Stafleu, and Henk F.J.
Hendriks. 2004. “Biomarkers of Satiation and Satiety.” The American Journal of
Clinical Nutrition 79 (6): 946–61.
Décordé, Kelly, Pierre-Louis Teissèdre, Thibault Sutra, Emilie Ventura, Jean-Paul Cristol,
and Jean-Max Rouanet. 2009. “Chardonnay Grape Seed Procyanidin Extract
Supplementation Prevents High-Fat Diet-Induced Obesity in Hamsters by Improving
Adipokine Imbalance and Oxidative Stress Markers.” Molecular Nutrition & Food
Research 53 (5): 659–66.
Diepvens, K., D. Häberer, and M. Westerterp-Plantenga. 2007. “Different Proteins and
Biopeptides Differently Affect Satiety and Anorexigenic/orexigenic Hormones in
Healthy Humans.” International Journal of Obesity 32 (3): 510–18.
Dunshea, Frank R., Ewa Ostrowska, Josie M. Ferrari, and Harsharn S. Gill. 2007. “Dairy
Proteins and the Regulation of Satiety and Obesity.” Australian Journal of
Experimental Agriculture 47 (9): 1051.
Ejaz, A., D. Wu, P. Kwan, and M. Meydani. 2009. “Curcumin Inhibits Adipogenesis in 3T3L1 Adipocytes and Angiogenesis and Obesity in C57/BL Mice.” Journal of Nutrition
139 (5): 919–25.
Farnfield, Michelle M., Craige Trenerry, Kate A. Carey, and David Cameron-Smith. 2009.
“Plasma Amino Acid Response after Ingestion of Different Whey Protein Fractions.”
International Journal of Food Sciences and Nutrition 60 (6): 476–86.
Ferruzzi, Mario G., Nicolas Bordenave, and Bruce R. Hamaker. 2012. “Does Flavor Impact
Function? Potential Consequences of Polyphenol–protein Interactions in Delivery and
Bioactivity of Flavan-3-Ols from Foods.” Physiology & Behavior 107 (4): 591–97.
45
Finkelstein, Eric A., Olga A. Khavjou, Hope Thompson, Justin G. Trogdon, Liping Pan,
Bettylou Sherry, and William Dietz. 2012. “Obesity and Severe Obesity Forecasts
Through 2030.” American Journal of Preventive Medicine 42 (6): 563–70.
Finkelstein, Eric A., Christopher J. Ruhm, and Katherine M. Kosa. 2005. “ECONOMIC
CAUSES AND CONSEQUENCES OF OBESITY.” Annual Review of Public Health
26 (1): 239–57.
Food and Nutrition Board. 2013. "Dietary Reference Intakes (DRIs): Estimated Average
Requirements." Institute of Medicine, National Academies. Washington, D.C.
Fried, Susan K., Matthew R. Ricci, Colleen D. Russell, and Blandine Laferrère. 2000.
“Regulation of Leptin Production in Humans.” The Journal of Nutrition 130 (12):
3127S–3131S.
Fu, Zhuo, Julia Yuskavage, and Dongmin Liu. 2013. “Dietary Flavonol Epicatechin Prevents
the Onset of Type 1 Diabetes in Nonobese Diabetic Mice.” Journal of Agricultural
and Food Chemistry 61 (18): 4303–9.
Gossai, D., and C.A. Lau-Cam. 2009. “Assessment of the Effect of Type of Dairy Product
and of Chocolate Matrix on the Oral Absorption of Monomeric Chocolate Flavanols
in a Small Animal Model.” Pharmazie 64 (3): 202–9.
Grassi, Davide, Giovambattista Desideri, Stefano Necozione, Cristina Lippi, Raffaele Casale,
Giuliana Properzi, Jeffrey B. Blumberg, and Claudio Ferri. 2008. “Blood Pressure Is
Reduced and Insulin Sensitivity Increased in Glucose-Intolerant, Hypertensive
Subjects after 15 Days of Consuming High-Polyphenol Dark Chocolate.” The Journal
of Nutrition 138 (9): 1671–76.
Gregoire, Francine M., Cynthia M. Smas, and Hei Sook Sul. 1998. “Understanding
Adipocyte Differentiation.” Physiological Reviews 78 (3): 783–809.
Gu, Yeyi, William J. Hurst, David A. Stuart, and Joshua D. Lambert. 2011. “Inhibition of
Key Digestive Enzymes by Cocoa Extracts and Procyanidins.” Journal of
Agricultural and Food Chemistry 59 (10): 5305–11.
Gu, Yeyi, and Joshua D. Lambert. 2013. “Modulation of Metabolic Syndrome-Related
Inflammation by Cocoa.” Molecular Nutrition & Food Research 57 (6): 948–61.
Hall, W.L., D.J. Millward, S.J. Long, and L.M. Morgan. 2007. “Casein and Whey Exert
Different Effects on Plasma Amino Acid Profiles, Gastrointestinal Hormone
Secretion and Appetite.” British Journal of Nutrition 89 (02): 239.
46
Harmon, Anne W. and Joyce B. Harp. 2001. “Differential Effects of Flavonoids on 3T3-L1
Adipogenesis and Lipolysis.” American Journal of Physiology-Cell Physiology 280
(4): C807–C813.
"Health, United States, 2011: With Special Feature on Socioeconomic Status and
Health."National Center for Health Statistics. Hyattsville, MD. 2011.
Herman, M.A., P. She, O.D. Peroni, C.J. Lynch, and B.B. Kahn. 2010. “Adipose Tissue
Branched Chain Amino Acid (BCAA) Metabolism Modulates Circulating BCAA
Levels.” Journal of Biological Chemistry 285 (15): 11348–56.
Hulmi, Juha J., Christopher M. Lockwood, and Jeffrey R. Stout. 2010. “Effect of
Protein/essential Amino Acids and Resistance Training on Skeletal Muscle
Hypertrophy: A Case for Whey Protein.” Nutrition & Metabolism 7: 51.
Hwang, Cheng-Shine, Thomas M. Loftus, Susanne Mandrup, and M. Daniel Lane. 1997.
“Adipocyte Differentiation and Leptin Expression.” Annual Review of Cell and
Developmental Biology 13: 231–59.
Jalil, Abbe Maleyki, Amin Ismail, Pei Pei Chong, Muhajir Hamid, and Syed Hasbullah Syed
Kamaruddin. 2009. “Effects of Cocoa Extract Containing Polyphenols and
Methylxanthines on Biochemical Parameters of Obese-Diabetic Rats.” Journal of the
Science of Food and Agriculture 89 (1): 130–37.
Jalil, Abbe Maleyki and Amin Ismail. 2008. “Polyphenols in Cocoa and Cocoa Products: Is
There a Link between Antioxidant Properties and Health?” Molecules 13 (9): 2190–
2219.
Jalil, Abbe Maleyki, Amin Ismail, Chong Pei Pei, Muhajir Hamid, and Syed Hasbullah Syed
Kamaruddin. 2008. “Effects of Cocoa Extract on Glucometabolism, Oxidative Stress,
and Antioxidant Enzymes in Obese-Diabetic (Ob-Db) Rats.” Journal of Agricultural
and Food Chemistry 56 (17): 7877–84.
Jeong, Yoo Seok, Joo Heon Hong, Kyung Hyun Cho, and Hee Kyoung Jung. 2012. “Grape
Skin Extract Reduces Adipogenesis- and Lipogenesis-Related Gene Expression in
3T3-L1 Adipocytes through the Peroxisome Proliferator-Activated Receptor-Γ
Signaling Pathway.” Nutrition Research 32 (7): 514–21.
Josic, Julija, Anna Tholén Olsson, Jennie Wickeberg, Sandra Lindstedt, and Joanna
Hlebowicz. 2010. “Does Green Tea Affect Postprandial Glucose, Insulin and Satiety
in Healthy Subjects: A Randomized Controlled Trial.” Nutrition Journal 9 (1): 63.
47
Katz, David L., Kim Doughty, and Ather Ali. 2011. “Cocoa and Chocolate in Human Health
and Disease.” Antioxidants & Redox Signaling 15 (10): 2779–2811.
Keogh, J.B., J. McInerney, and P.M. Clifton. 2007. “The Effect of Milk Protein on the
Bioavailability of Cocoa Polyphenols.” Journal of Food Science 72 (3): S230–S233.
Kim, Choon Young, Thuc T. Le, Chihyu Chen, Ji-Xin Cheng, and Kee-Hong Kim. 2011.
“Curcumin Inhibits Adipocyte Differentiation through Modulation of Mitotic Clonal
Expansion.” The Journal of Nutritional Biochemistry 22 (10): 910–20.
Kim, Hyojung, and Kazuichi Sakamoto. 2012. “(−)-Epigallocatechin Gallate Suppresses
Adipocyte Differentiation through the MEK/ERK and PI3K/Akt Pathways.” Cell
Biology International 36 (2): 147–53.
Klaus, S., S. Pültz, C. Thöne-Reineke, and S. Wolfram. 2005. “Epigallocatechin Gallate
Attenuates Diet-Induced Obesity in Mice by Decreasing Energy Absorption and
Increasing Fat Oxidation.” International Journal of Obesity 29 (6): 615–23.
Lam, Sylvia Chung Chun, Paul J. Moughan, Ajay Awati, and Hugh R. Morton. 2009. "The
influence of whey protein and glycomacropeptide on satiety in adult humans."
Physiology & Behavior 96 (1): 162-168.
Lasa, Arrate, Itziar Churruca, Itziar Eseberri, Cristina Andrés-Lacueva, and María P. Portillo.
2012. “Delipidating Effect of Resveratrol Metabolites in 3T3-L1 Adipocytes.”
Molecular Nutrition & Food Research 56 (10): 1559–68.
Layman, Donald K., and Denise A. Walker. 2006. “Potential Importance of Leucine in
Treatment of Obesity and the Metabolic Syndrome.” The Journal of Nutrition 136
(1): 319S–323S.
Lee, Ki Won, Young Jun Kim, Hyong Joo Lee, and Chang Yong Lee. 2003. “Cocoa Has
More Phenolic Phytochemicals and a Higher Antioxidant Capacity than Teas and Red
Wine.” Journal of Agricultural and Food Chemistry 51 (25): 7292–95.
Leidy, Heather J., Louise I. Bales-Voelker, and Corey T. Harris. 2011. “A Protein-Rich
Beverage Consumed as a Breakfast Meal Leads to Weaker Appetitive and Dietary
Responses v. a Protein-Rich Solid Breakfast Meal in Adolescents.” British Journal of
Nutrition 106 (01): 37–41.
Lejeune, Manuela P.G.M., Klaas R. Westerterp, Tanja C.M. Adam, Natalie D. LuscombeMarsh, and Margriet S. Westerterp-Plantenga. 2006. “Ghrelin and Glucagon-like
Peptide 1 Concentrations, 24-H Satiety, and Energy and Substrate Metabolism during
48
a High-Protein Diet and Measured in a Respiration Chamber.” The American Journal
of Clinical Nutrition 83 (1): 89–94.
Luhovyy, Bohdan L., Tina Akhavan, and G. Harvey Anderson. 2007. “Whey Proteins in the
Regulation of Food Intake and Satiety.” Journal of the American College of Nutrition
26 (6): 704S–712S.
Lustig, Robert H. 2006. “Childhood Obesity: Behavioral Aberration or Biochemical Drive?
Reinterpreting the First Law of Thermodynamics.” Nature Clinical Practice
Endocrinology & Metabolism 2 (8): 447–58.
Lynch, C. J., Beth Gern, Carlyn Lloyd, Susam M. Hutson, Rachel Eicher, and Thomas C.
Vary. 2006. “Leucine in Food Mediates Some of the Postprandial Rise in Plasma
Leptin Concentrations.” AJP: Endocrinology and Metabolism 291 (3): E621–E630.
Lynch, Christopher J. 2001. “Role of Leucine in the Regulation of mTOR by Amino Acids:
Revelations from Structure–activity Studies.” The Journal of Nutrition 131 (3):
861S–865S.
MacDougald, Ormond A., Cheng-Shine Hwang, Haiying Fan, and M. Daniel Lane. 1995.
“Regulated Expression of the Obese Gene Product (leptin) in White Adipose Tissue
and 3T3-L1 Adipocytes.” Proceedings of the National Academy of Sciences 92 (20):
9034–37.
Massolt, Elske T., Paul M. van Haard, Jens F. Rehfeld, Eduardus F. Posthuma, Eveline van
der Veer, and Dave H. Schweitzer. 2010. “Appetite Suppression through Smelling of
Dark Chocolate Correlates with Changes in Ghrelin in Young Women.” Regulatory
Peptides 161 (1-3): 81–86.
Matsui, Naoko, Ryoichi Ito, Eisaku Nishimura, Mariko Yoshikawa, Masatoshi Kato,
Masanori Kamei, Haruki Shibata, Ichiro Matsumoto, Keiko Abe, and Shuichi
Hashizume. 2005. “Ingested Cocoa Can Prevent High-Fat Diet-Induced Obesity by
Regulating the Expression of Genes for Fatty Acid Metabolism.” Nutrition 21 (5):
594–601.
McAllan, Liam, Deirdre Keane, Harriët Schellekens, Helen M. Roche, Riitta Korpela, John
F. Cryan, and Kanishka N. Nilaweera. 2013. “Whey Protein Isolate Counteracts the
Effects of a High-Fat Diet on Energy Intake and Hypothalamic and Adipose Tissue
Expression of Energy Balance-Related Genes.” British Journal of Nutrition, June, 1–
13.
49
Mellinkoff, Sherman M., Marjorie Frankland, David Boyle, and Margaret Greipe. 1997.
"Relationship between serum amino acid concentration and fluctuations in appetite."
Obesity Research, 5 (4): 381–384.
Mercader, Josep, Andreu Palou, and M. Luisa Bonet. 2011. “Resveratrol Enhances Fatty
Acid Oxidation Capacity and Reduces Resistin and Retinol-Binding Protein 4
Expression in White Adipocytes.” The Journal of Nutritional Biochemistry 22 (9):
828–34.
Min, S.Y., H. Yang, S.G. Seo, S.H. Shin, M-Y Chung, J. Kim, S.J. Lee, H.J. Lee, and K.W.
Lee. 2012. “Cocoa Polyphenols Suppress Adipogenesis in Vitro and Obesity in Vivo
by Targeting Insulin Receptor.” International Journal of Obesity 37 (4): 584–92.
Moghe, Shiwani S., Shanil Juma, Victorine Imrhan, and Parakat Vijayagopal. 2012. “Effect
of Blueberry Polyphenols on 3T3-F442A Preadipocyte Differentiation.” Journal of
Medicinal Food 15 (5): 448–52.
Moreno-Navarrete, José María, and José Manuel Fernández-Real. 2012. “Adipocyte
Differentiation.” In Adipose Tissue Biology, edited by Michael E. Symonds, 17–38.
New York, NY: Springer New York.
Morrison, C.D., X. Xi, C.L. White, J. Ye, and R.J. Martin. 2007. “Amino Acids Inhibit Agrp
Gene Expression via an mTOR-Dependent Mechanism.” AJP: Endocrinology and
Metabolism 293 (1): E165–E171.
Myers, Martin G., Michael A. Cowley, and Heike Münzberg. 2008. “Mechanisms of Leptin
Action and Leptin Resistance.” Annual Review of Physiology 70 (1): 537–56.
Neilson, Andrew P., and Mario G. Ferruzzi. 2011. “Influence of Formulation and Processing
on Absorption and Metabolism of Flavan-3-Ols from Tea and Cocoa.” Annual Review
of Food Science and Technology 2 (1): 125–51.
Neilson, Andrew P., Judy C. George, Elsa M. Janle, Richard D. Mattes, Ralf Rudolph,
Nathan V. Matusheski, and Mario G. Ferruzzi. 2009. “Influence of Chocolate Matrix
Composition on Cocoa Flavan-3-Ol Bioaccessibility In Vitro and Bioavailability in
Humans.” Journal of Agricultural and Food Chemistry 57 (20): 9418–26.
Nilsson, Mikael, Jens J. Holst, and Inger ME Björck. 2007. “Metabolic Effects of Amino
Acid Mixtures and Whey Protein in Healthy Subjects: Studies Using GlucoseEquivalent Drinks.” The American Journal of Clinical Nutrition 85 (4): 996–1004.
50
“Nutritional Benefits of Dairy Ingredients." U.S. Dairy Export Council, accessed July 10,
2013, http://www.dairyglobalnutrition.org/NutrInfo/index.cfm?nav
ItemNumber=88320.
Pal, Sebely, Vanessa Ellis, and Satvinder Dhaliwal. 2010. “Effects of Whey Protein Isolate
on Body Composition, Lipids, Insulin and Glucose in Overweight and Obese
Individuals.” British Journal of Nutrition 104 (05): 716–23.
Panickar, Kiran S. 2013. “Effects of Dietary Polyphenols on Neuroregulatory Factors and
Pathways That Mediate Food Intake and Energy Regulation in Obesity.” Molecular
Nutrition & Food Research 57 (1): 34–47.
Park, Hea Jin, Dana A. DiNatale, Min-Yu Chung, Young-Ki Park, Ji-Young Lee, Sung I.
Koo, Meeghan O’Connor, Jose E. Manautou, and Richard S. Bruno. 2011. “Green
Tea Extract Attenuates Hepatic Steatosis by Decreasing Adipose Lipogenesis and
Enhancing Hepatic Antioxidant Defenses in Ob/ob Mice.” The Journal of Nutritional
Biochemistry 22 (4): 393–400.
Pasiakos, S.M., J.J. Cao, L.M. Margolis, E.R. Sauter, L.D. Whigham, J.P. McClung, J.C.
Rood, J.W. Carbone, G.F. Combs, and A.J. Young. 2013. “Effects of High-Protein
Diets on Fat-Free Mass and Muscle Protein Synthesis Following Weight Loss: A
Randomized Controlled Trial.” The FASEB Journal 27 (9): 3837–47.
Payne, Mark J., W. Jeffrey Hurst, Kenneth B. Miller, Craig Rank, and David A. Stuart. 2010.
“Impact of Fermentation, Drying, Roasting, and Dutch Processing on Epicatechin and
Catechin Content of Cacao Beans and Cocoa Ingredients.” Journal of Agricultural
and Food Chemistry 58 (19): 10518–27.
Peracchi, Maddalena, Alessandra Santangelo, Dario Conte, Mirella Fraquelli, Rosalia
Tagliabue, Carlotta Gebbia, and Marisa Porrini. 2000. “The Physical State of a Meal
Affects Hormone Release and Postprandial Thermogenesis.” British Journal of
Nutrition 83 (6): 623–28.
Perego, P., B. Fabiano, M. Cavicchioli, and M. Del Borghi. 2004. “Cocoa Quality and
Processing: A Study by Solid-Phase Microextraction and Gas Chromatography
Analysis of Methylpyrazines.” Food and Bioproducts Processing 82 (4): 291–97.
Pichon, Lisa, Mylene Potier, Daniel Tome, Takashi Mikogami, Benoit Laplaize, Christine
Martin-Rouas, and Gilles Fromentin. 2007. “High-Protein Diets Containing Different
Milk Protein Fractions Differently Influence Energy Intake and Adiposity in the Rat.”
British Journal of Nutrition 99 (04).
51
Ranawana, Viren, and C. Jeya K. Henry. 2011. “Liquid and Solid Carbohydrate Foods:
Comparative Effects on Glycemic and Insulin Responses, and Satiety.” International
Journal of Food Sciences and Nutrition 62 (1): 71–81.
Record, Ian R., and Joanne M. Lane. 2001. “Simulated Intestinal Digestion of Green and
Black Teas.” Food Chemistry 73 (4): 481–86.
Roh, Cecilia, Jianrong Han, Alexandros Tzatsos, and Konstantin V. Kandror. 2003.
“Nutrient-Sensing mTOR-Mediated Pathway Regulates Leptin Production in Isolated
Rat Adipocytes.” American Journal of Physiology-Endocrinology And Metabolism
284 (2): E322–E330.
Rosenbaum, Michael, Margery Nicolson, Jules Hirsch, Ellen Murphy, Florence Chu, and
Rudolph L. Leibel. 1997. “Effects of Weight Change on Plasma Leptin
Concentrations and Energy Expenditure.” Journal of Clinical Endocrinology &
Metabolism 82 (11): 3647–54.
Roura, Elena, Cristina Andrés-Lacueva, Ramon Estruch, M. Lourdes Mata-Bilbao, Maria
Izquierdo-Pulido, Andrew L. Waterhouse, and Rosa M. Lamuela-Raventós.
2007. “Milk Does Not Affect the Bioavailability of Cocoa Powder Flavonoid in
Healthy Human.” Annals of Nutrition and Metabolism 51 (6): 493–98.
Roura, Elena, Cristina Andrés-Lacueva, Ramon Estruch, M. Lourdes Mata Bilbao, Maria
Izquierdo-Pulido, and Rosa M. Lamuela-Raventós. 2008. “The Effects of Milk as a
Food Matrix for Polyphenols on the Excretion Profile of Cocoa ( − )-Epicatechin
Metabolites in Healthy Human Subjects.” British Journal of Nutrition 100 (04).
Royle, Peter J., Graeme H. McIntosh, and Peter M. Clifton. 2007. “Whey Protein Isolate and
Glycomacropeptide Decrease Weight Gain and Alter Body Composition in Male
Wistar Rats.” British Journal of Nutrition 100 (01).
Ruhm, Christopher J. 2012. “Understanding Overeating and Obesity.” Journal of Health
Economics 31 (6): 781–96.
Ruzaidi, Azli Mohd Mokhtar, Maleyki Mhd Jalil Abbe, Ismail Amin, Abdul Ghani
Nawalyah, and Hamid Muhajir. 2008. “Protective Effect of Polyphenol-Rich Extract
Prepared from Malaysian Cocoa (Theobroma Cacao) on Glucose Levels and Lipid
Profiles in Streptozotocin-Induced Diabetic Rats.” Journal of the Science of Food and
Agriculture 88 (8): 1442–47.
Santangelo, A., M. Peracchi, D. Conte, M. Fraquelli, and M. Porrini. 1998. “Physical State of
Meal Affects Gastric Emptying, Cholecystokinin Release and Satiety.” British
Journal of Nutrition 80: 521–27.
52
Smithers, Geoffrey W. 2008. “Whey and Whey proteins—From ‘gutter-to-Gold.’”
International Dairy Journal 18 (7): 695–704.
Söhle, Jörn, Anja Knott, Ursula Holtzmann, Ralf Siegner, Elke Grönniger, Andreas Schepky,
Stefan Gallinat, Horst Wenck, Franz Stäb, and Marc Winnefeld. 2009. “White Tea
Extract Induces Lipolytic Activity and Inhibits Adipogenesis in Human Subcutaneous
(pre)-Adipocytes.” Nutrition & Metabolism 6 (1): 20.
Sørensen, L.B., and A. Astrup. 2011. “Eating Dark and Milk Chocolate: A Randomized
Crossover Study of Effects on Appetite and Energy Intake.” Nutrition and Diabetes 1
(12): e21.
Spencer, Jeremy P.E., Fozia Chaudry, Ananth Sekher Pannala, S. Kaila Srai, Edward
Debnam, and Catherine Rice-Evans. 2000. “Decomposition of Cocoa Procyanidins in
the Gastric Milieu.” Biochemical and Biophysical Research Communications 272 (1):
236–41.
Steinberg, Francene M., Monica M. Bearden, and Carl L. Keen. 2003. “Cocoa and Chocolate
Flavonoids: Implications for Cardiovascular Health.” Journal of the American
Dietetic Association 103 (2): 215–23.
Stewart, Cara. 2011. "Eat Meals Slowly, It's Worth the Time!" Penn Metabolic & Bariatric
Surgery Update, Penn Medicine. http://penn-bariatric-weight-losssurgery.blogspot.com/2011/04/eat-meals-slowly-its-worth-time.html.
Stojadinovic, Marija, Jelena Radosavljevic, Jana Ognjenovic, Jelena Vesic, Ivana Prodic,
Dragana Stanic-Vucinic, and Tanja Cirkovic Velickovic. 2013. “Binding Affinity
between Dietary Polyphenols and Β-Lactoglobulin Negatively Correlates with the
Protein Susceptibility to Digestion and Total Antioxidant Activity of Complexes
Formed.” Food Chemistry 136 (3-4): 1263–71.
Stull, April J., John W. Apolzan, Anna E. Thalacker-Mercer, Heidi B. Iglay, and Wayne W.
Campbell. 2008. “Liquid and Solid Meal Replacement Products Differentially Affect
Postprandial Appetite and Food Intake in Older Adults.” Journal of the American
Dietetic Association 108 (7): 1226–30.
Sun, Xiaocun, and Michael B Zemel. 2007. “Leucine and Calcium Regulate Fat Metabolism
and Energy Partitioning in Murine Adipocytes and Muscle Cells.” Lipids 42 (4): 297–
305.
Szkudelski, T., E. Nowicka, and K. Szkudelska. 2005. “Leptin Secretion and Protein Kinase
A Activity.” Physiol Res 54 (1): 79–85.
53
Szkudelski, Tomasz. 2007. “Intracellular Mediators in Regulation of Leptin Secretion from
Adipocytes.” Physiological Research 56 (5): 503.
Teff, Karen L., Sharon S. Elliott, Matthias Tschöp, Timothy J. Kieffer, Daniel Rader, Mark
Heiman, Raymond R. Townsend, Nancy L. Keim, David D’Alessio, and Peter J.
Havel. 2004. “Dietary Fructose Reduces Circulating Insulin and Leptin, Attenuates
Postprandial Suppression of Ghrelin, and Increases Triglycerides in Women.” The
Journal of Clinical Endocrinology & Metabolism 89 (6): 2963–72.
Tieken, S., H. Leidy, A. Stull, R. Mattes, R. Schuster, and W. Campbell. 2007. “Effects of
Solid versus Liquid Meal-Replacement Products of Similar Energy Content on
Hunger, Satiety, and Appetite-Regulating Hormones in Older Adults.” Hormone and
Metabolic Research 39 (5): 389–94.
Torres-Leal, Francisco L., Miriam H. Fonseca-Alaniz, Gabriela FR Teodoro, Mariana D. de
Capitani, Daiana Vianna, Lucas C. Pantaleão, Emidio M. Matos-Neto, Marcelo M.
Rogero, Jose Donato Jr, and Julio Tirapegui. 2011. “Leucine Supplementation
Improves Adiponectin and Total Cholesterol Concentrations despite the Lack of
Changes in Adiposity or Glucose Homeostasis in Rats Previously Exposed to a HighFat Diet.” Cellulose 50 (50.0): 50–0.
Veldhorst, M., A. Smeets, S. Soenen, A. Hochstenbach-Waelen, R. Hursel, K. Diepvens, M.
Lejeune, N. Luscombe-Marsh, and M. Westerterp-Plantenga. 2008. “Protein-Induced
Satiety: Effects and Mechanisms of Different Proteins.” Physiology & Behavior 94
(2): 300–307.
Veldhorst, Margriet A.B., Arie G. Nieuwenhuizen, Ananda Hochstenbach-Waelen, Anneke
J.A.H. van Vught, Klaas R. Westerterp, Marielle P.K.J. Engelen, Robert-Jan M.
Brummer, Nicolaas E.P. Deutz, and Margriet S. Westerterp-Plantenga. 2009. “DoseDependent Satiating Effect of Whey Relative to Casein or Soy.” Physiology &
Behavior 96 (4-5): 675–82.
Veldhorst, Margriet A.B., Arie G. Nieuwenhuizen, Ananda Hochstenbach-Waelen, Klaas R.
Westerterp, Marielle P. K. J. Engelen, Robert-Jan M. Brummer, Nicolaas E. P. Deutz,
and Margriet S. Westerterp-Plantenga. 2008. “Comparison of the Effects of a Highand Normal-Casein Breakfast on Satiety, ‘satiety’ Hormones, Plasma Amino Acids
and Subsequent Energy Intake.” British Journal of Nutrition 101 (02): 295.
Veldhorst, Margriet A.B., Arie G. Nieuwenhuizen, Ananda Hochstenbach-Waelen, Klaas R.
Westerterp, Marielle P.K.J. Engelen, Robert-Jan M. Brummer, Nicolaas E.P. Deutz,
and Margriet S. Westerterp-Plantenga. 2009. “Effects of Complete Whey-Protein
Breakfasts versus Whey without GMP-Breakfasts on Energy Intake and Satiety.”
54
Wang, S., S. Noh, and S. Koo. 2006. “Green Tea Catechins Inhibit Pancreatic Phospholipase
A2 and Intestinal Absorption of Lipids in Ovariectomized Rats.” The Journal of
Nutritional Biochemistry 17 (7): 492–98.
Weigle, David S., Patricia A. Breen, Colleen C. Matthys, Holly S. Callahan, Kaatje E.
Meeuws, Verna R. Burden, and Jonathan Q. Purnell. 2005. “A High-Protein Diet
Induces Sustained Reductions in Appetite, Ad Libitum Caloric Intake, and Body
Weight despite Compensatory Changes in Diurnal Plasma Leptin and Ghrelin
Concentrations.” The American Journal of Clinical Nutrition 82 (1): 41–48.
Westerterp-Plantenga, M.S., N. Luscombe-Marsh, M.P.G.M. Lejeune, K. Diepvens, A.
Nieuwenhuizen, M.P.K.J Engelen, N.E.P. Deutz, D. Azzout-Marniche, D. Tome, and
K.R. Westerterp. 2006. “Dietary Protein, Metabolism, and Body-Weight Regulation:
Dose–response Effects.” International Journal of Obesity 30 (December): S16–S23.
Westerterp-Plantenga, M.S., V. Rolland, S.A.J. Wilson, and K.R. Westerterp. 1999. “Satiety
Related to 24 H Diet-Induced Thermogenesis during High Protein/carbohydrate vs
High Fat Diets Measured in a Respiration Chamber.” European Journal of Clinical
Nutrition 53 (6): 495–502.
Wijlens, Anne G.M., Alfrun Erkner, Erin Alexander, Monica Mars, Paul A.M. Smeets, and
Cees de Graaf. 2012. “Effects of Oral and Gastric Stimulation on Appetite and
Energy Intake.” Obesity 20 (11): 2226–32.
Yasuda, Akiko, Midori Natsume, Naomi Osakabe, Keiko Kawahata, and Jinichiro Koga.
2011. “Cacao Polyphenols Influence the Regulation of Apolipoprotein in HepG2 and
Caco2 Cells.” Journal of Agricultural and Food Chemistry 59 (4): 1470–76.
Zeigerer, Anja, Matthew S. Rodeheffer, Timothy E. McGraw, and Jeffrey M. Friedman.
2008. “Insulin Regulates Leptin Secretion from 3T3–L1 Adipocytes by a PI 3 Kinase
Independent Mechanism.” Experimental Cell Research 314 (11-12): 2249–56.
Zhang, Faming, Yanyun Chen, Mark Heiman, and Richard DiMarchi. 2005. “Leptin:
Structure, Function and Biology.” In Vitamins & Hormones, 71:345–72. Elsevier.
http://linkinghub.elsevier.com/retrieve/pii/S0083672905710128.
Zhang, Xian-Hua, Bo Huang, Soo-Kyong Choi, and Jung-Sook Seo. 2012. “Anti-Obesity
Effect of Resveratrol-Amplified Grape Skin Extracts on 3T3-L1 Adipocytes
Differentiation.” Nutrition Research and Practice 6 (4): 286.
Zwirska-Korczala, K., M. Adamczyk-Sowa, P. Sowa, K. Pilc, R. Suchanek, K. Pierzchala, G.
Namyslowski, M. Misiolek, K. Sodowski, and I. Kato. 2007. “Role of Leptin,
55
Ghrelin, Angiotensin II and Orexins.” Journal of Physiology and Pharmacology 58
(1): 53–64.
56
CHAPTER 2: EFFECTS OF COCOA POLYPHENOLS
AND LEUCINE ON DIFFERENTIATION, LIPID
ACCUMULATION, AND LEPTIN PRODUCTION IN
3T3-L1 PRE-ADIPOCYTES
57
2.1 ABSTRACT
Bioactive food ingredients exhibit the potential to counteract obesity and facilitate
weight loss. Whey protein intake has been demonstrated to decrease total body fat while
increasing satiety. Cocoa phenolics have been reported to prevent lipid accumulation,
improve insulin signaling, and slow digestion. Little research exists on the effects of cocoa
upon satiety. This study aimed to determine the effects of cocoa and leucine, a major whey
protein amino acid, upon differentiation, lipid accumulation, and leptin production in murine
3T3-L1 pre-adipocytes. 3T3-L1 cells were treated with 0.5-100 ug/ml cocoa phenolic extract
(CPE) and/or 1-15 mM leucine during and after differentiation. Extent of differentiation and
lipid accumulation were quantified by Oil-Red-O staining and leptin production was
measured by leptin enzyme-linked immunosorbent assay (ELISA). Results showed that 10,
50, and 100 ug/ml CPE treatments inhibited pre-adipocyte lipid accumulation by 17, 35, and
50%, respectively. CPE treatments of 0.5 ug/ml increased leptin production by 66%. Leucine
treatment had no effect upon lipid accumulation but increased leptin production by 26-37%.
In combination, CPE and 15 mM leucine inhibited lipid accumulation by 10-40% and
increased leptin production by 14%. This study indicates that the consumption of cocoa and
whey protein, individually and in combination, may increase lipid metabolism and satiety.
2.2 INTRODUCTION
Polyphenolic compounds found in cocoa, fruits, and tea have been shown to increase
satiety, insulin sensitivity, and fat metabolism (Jalil et al. 2009, Panickar 2013). Cocoa
tannins, catechins, and procyanidins effectively slowed digestion in vitro by binding α-
58
amylase, glucoamylase, and pancreatic lipase (Gu et al. 2011, Barrett et al., 2013). In mouse
and human clinical studies, flavanol-rich cocoa or chocolate consumption decreased fat
accumulation and fatty acid synthesis, increased insulin sensitivity, and lowered short-term
blood glucose and free fatty acid levels (Matsui et al. 2005, Grassi et al. 2008, Jalil et al.
2009, Min et al. 2012). Epicatechin consumption in drinking water (equivalent to 250 g of
dark chocolate per day) decreased the incidence of diabetes by 50% and increased insulin
levels in mice (Fu, Yuskavage, and Liu 2013). Polyphenol-rich dark chocolate consumption
decreased hunger ratings and ad libitum intake by 17% and increased satiety more than milk
chocolate (Sørensen and Astrup 2011, Fu, Yuskavage, and Liu 2013). Even in the absence of
substantial cocoa polyphenols, a variety of chocolate flavored desserts increased plasma
insulin levels more than the same vanilla or strawberry-flavored foods (Brand-Miller et al.
2003).
Of the major food macromolecules, whey proteins have been shown to increase
satiety, quantified both by subjective satiety scaling and hormonal markers. Whey protein
decreased ad libitum food intake by 19% and increased levels of satiation hormones by 60%
in comparison to casein (Hall et al. 2007). Pichon et al. (2007) showed that whey proteins
were more effective than whole milk protein in limiting weight gain and increasing insulin
and leptin levels in rats fed high-protein diets. The satiety-inducing benefits of whey proteins
are attributed to their high branched chain amino acid content (Layman and Walker 2006).
Valine, leucine, and isoleucine are more quickly metabolized by the body; the subsequent
increase in plasma amino acids appears to trigger the release of satiety hormones and to
induce greater feelings of satiety (Boirie et al. 1997). Leucine supplementation in vivo and in
59
clinical trials has been found to increase muscle synthesis, increase plasma leptin, decrease
plasma lipid levels, and improve body composition (Katsanos et al. 2006, Lynch et al. 2006,
Pal, Ellis, and Dhaliwal 2010).
Adipose tissue is the major energy reserve within the human body and influences
both lipid metabolism and satiety signals sent to the brain (Hwang et al. 1997). The satiety
hormone leptin is only secreted by white adipose tissue and its appetite-suppressing action
influences the length of time between meals, snacking habits, and calories consumed at the
following meal (De Graaf et al. 2004, Benelam 2009). The 3T3-L1 murine pre-adipocyte cell
line is a common model used to evaluate the in vitro effectors of adipocyte lipid metabolism
and hormonal secretion. In vitro, adipocytes have been demonstrated to express only 1% of
the total leptin expressed in vivo, somewhat limiting their use as a model of fat mass in vivo
(MacDougald et al. 1995). However, conclusions can be extrapolated from in vitro
observations and these cell lines serve as an adequate initial indication of adipocyte response
to specific environmental conditions.
Polyphenolics from tea and fruits have been shown to decrease adipogenesis and lipid
accumulation but less research exists on cocoa polyphenolics (Kim and Sakamoto 2012,
Zhang et al. 2012). In 3T3-L1 cells, 100 or 200 µg/ml cocoa polyphenol extract inhibited
adipogenesis by 30% and 72%, respectively (Min et al. 2012). To mimic whey protein
consumption in vitro, treatment of adipocytes with 5 mM leucine increased leptin secretion
2-5 fold, increased fatty acid oxidation, and lowered fatty acid synthesis (Cammisotto et al.
2006, Roh et al. 2003). Cammisotto et al. (2006) indicated that leucine and glutamate
increased leptin secretion by almost 2-fold and slightly increased intracellular leptin content.
60
Leucine treatment also increased fatty acid oxidation in muscle cells and lowered fatty acid
synthesis (Sun and Zemel 2007).
Beverages designed for weight control or nutritional supplementation can contain
whey proteins and cocoa. No research exists on the effects of cocoa polyphenols on leptin
levels in vitro or in vivo. In addition, the combined effects of cocoa and whey proteins on
parameters contributing to obesity have not been investigated. This study aimed to examine
the in vitro effects of cocoa polyphenols and leucine on 3T3-L1 differentiation, lipid
accumulation, and leptin secretion. Existing in vitro studies have treated cells with leucine in
the absence of basic growth media, implying that the cells were potentially starved of
essential nutrients. The treatments in this study intended to mimic in vivo conditions as
closely as possible: leucine concentrations were similar to those used in clinical protein
supplementation studies and cells were treated with leucine in the presence of all other basic
growth nutrients. The results of this study assess the individual and combined effects of
cocoa and whey protein ingredients on in vitro indicators of satiety and weight management.
2.3 MATERIALS AND METHODS
2.3.1 MATERIALS AND REAGENTS
Tissue culture plates and flasks were purchased from BD Biosciences (San Jose, CA,
USA). All reagents were purchased from Sigma-Aldrich (St. Louis, MO, USA) or Fisher
Scientific (Waltham, MA, USA) and were of the highest purity available. Dulbecco’s
Modified Eagle’s Medium and streptomycin-penicillin-glutamine were purchased from
61
Invitrogen-Life Technologies (Carlsbad, CA, USA) and fetal bovine serum was purchased
from Atlanta Biologicals (Flowery Branch, GA, USA). Hershey’s cocoa powder was
purchased from a local grocery store (Raleigh, NC, USA). 1-methyl-3-isobutylxanthine and
dexamethasone were purchased from Sigma-Aldrich (St. Louis MO, USA) and insulin from
Santa Cruz Biotechnology (Dallas, TX, USA). MTT was purchased from Molecular Probes
(Eugene, OR, USA) and Oil-Red-O from Sigma-Aldrich (St. Louis, MO, USA). L-leucine
was purchased from Sigma-Aldrich (St. Louis, MO, USA).
2.3.2 PREPARATION OF COCOA PHENOLIC EXTRACT (CPE)
Extraction of cocoa polyphenols was performed as by (Adamson et al. 1999). Briefly,
4 g of cocoa powder was defatted by three extractions with 25 ml hexanes. The remaining
cocoa pellet was then dried with nitrogen in an analytical rotary evaporator (Organomation,
Berlin, MA, USA). Polyphenolics were then extracted by three extractions of 1 g of dried
cocoa solids with 5 ml of 70% acetone, 29.5% water, and 0.5% glacial acetic acid.
Extractions were performed by sonication for 10 minutes and centrifugation for 10 minutes at
1500 x g and the extract from each extraction was decanted and combined to yield 15 ml
total extract. Extract was centrifuged at 3300 x g for 35 minutes in 25 ml conical tubes to
remove fine cocoa solids, filter sterilized through a 0.22 µm filter (Genesee Scientific, San
Diego, CA, USA), and stored at -20°C until use. Phenolic content of the cocoa extract was
determined by the Folin-Ciocalteu Total Phenolics assay as by (Magalhães et al. 2010) and
read at 690 nm. Cocoa polyphenolic treatments were based on the total phenolics assay and
expressed in µg/ml gallic acid equivalents. A more specific HPLC analysis of CPE content
62
was performed by The Hershey Company. The results of these analyses, including
epicatechin polymer and methylxanthine content, are shown in Tables A.1 and A.2 in the
Appendix.
2.3.3 CELL CULTURE
3T3-L1 pre-adipocytes were obtained from ATCC (Manassas, VA, USA). Cells were
grown in Dulbecco’s modified Eagle medium (DMEM) supplemented with 10% fetal bovine
serum (FBS) and 1% streptomycin-penicillin in 75 cm3 Falcon flasks at 37°C with 5% CO2.
Cell differentiation to adipocytes was performed as by (Phrakonkham et al. 2008). Briefly, at
90% confluency, 5,000 cells/well were seeded into 96-well cell culture plates, grown to
confluency, and then maintained for 48 hours post-confluency in the same growth media (day
0). At day 0, cells were treated with DMEM containing 0.5 mM 1-methyl-3-isobutylxanthine,
0.25 µM dexamethasone, and 170 nM insulin for 48 hours. Cells were then treated with
DMEM/10% FBS with 166 nM insulin for 48 hours. At day 4, media was replaced every two
days with DMEM/10% FBS until cells were 80-90% differentiated. To test the effects of
cocoa and leucine upon pre-adipocyte differentiation, wells were treated in triplicate with
0.5-100 µg/ml cocoa phenolic extract or 1-15 mM leucine from days 0-2. To determine
adipocyte lipid accumulation and leptin secretion, cells were treated with 0.5-100 µg/ml
cocoa extract or 1-15 mM leucine for 48 hours after complete differentiation was achieved
(between days 6-10). For lipid accumulation experiments, DMEM/10% FBS/1%
streptomycin-penicillin served as a negative control. A second negative control + solvent
consisted of 100 µg/ml acetone/water/acetic acid in order to control for the effects of the CPE
63
extraction solvent. For leptin secretion experiments, 0.5 mM insulin treatment served as a
positive control.
2.3.4 CELL VIABILITY
Cell viability was assessed using an MTT cell proliferation assay. Following
differentiation and cocoa/leucine treatment, growth media was replaced with DMEM/10%
FBS containing 0.5 mg/ml MTT. Cells were incubated at 37°C with 5% CO2 for 3.5 hours
until MTT was reduced to form purple formazan crystals at the bottom of each well. Media
was removed, replaced with dimethyl sulfoxide to dissolve the crystals, and the contents of
each well were transferred to corresponding wells of a clear 96-well plate. Absorbance was
read at 570 nm. Triplicate negative control readings were averaged and assigned a value of
100% viability; triplicate experimental absorbance values were converted to an average
percent of the negative control.
2.3.5 CELLULAR LIPID ACCUMULATION
3T3-L1 cellular lipid accumulation was determined using an Oil-Red-O staining
assay. Following differentiation and cocoa extract or leucine treatment, growth media was
removed and cells were fixed with formalin. Cells were then treated with 60% isopropanol
for 5 minutes and stained with 0.6 mg/ml Oil-Red-O in isopropanol for 30 minutes. Wells
were washed three times with DI water, photographed, and the water was replaced with
isopropanol to dissolve the Oil-Red-O dye. The contents of each well were transferred to a
clear 96-well plate and absorbance was read at 520 nm. Triplicate negative control readings
64
were averaged and assigned a value of 100%; triplicate experimental absorbance values were
converted to an average percent of the negative control.
2.3.6 LEPTIN SECRETION
3T3-L1 pre-adipocytes were differentiated as above and treated with cocoa extract,
leucine, or a combination of CPE and leucine for 48 hours post-differentiation. After 48
hours of treatment, growth media was removed from each well and assayed for leptin content
with a Mouse Leptin ELISA kit (Sigma-Aldrich, St. Louis, MO) according to manufacturer
instructions.
2.3.7 STATISTICAL ANALYSIS
A one-way ANOVA for Tukey’s honestly significant differences was applied using
SAS software to make all pairwise comparisons among treatment means at an experimentwise error rate of 0.05.
2.4 RESULTS AND DISCUSSION
2.4.1 EFFECTS OF COCOA EXTRACT AND LEUCINE ON 3T3-L1 CELL VIABILITY
A MTT cell viability assay was used to determine the effects of CPE and leucine on
cell growth. As shown below in Figures 2.1 to 2.4, the treatment of cells with CPE and/or
leucine during (days 0-2) or after differentiation (days 6-8) did not significantly affect
viability. All treatments exhibited cell viability values above 82% of the control.
65
Figure 2.1. Effects of CPE treatment on pre-adipocyte cell viability during differentiation
(day 0-2).
Treatments with same letter are not statistically different. Data expressed as percent of negative
control as mean ± S.E.
Neg control: complete growth media, Neg control + solvent: complete growth media + 100 µg/ml acetone
solvent
66
Figure 2.2. Effects of leucine treatment on pre-adipocyte cell viability during differentiation.
Treatments with same letter are not statistically different. Data expressed as percent of negative
control as mean ± S.E.
Neg control: complete growth media
67
Figure 2.3. Effects of CPE and 15 mM Leu treatment on pre-adipocyte cell viability.
Treatments with same letter are not statistically different. Data expressed as percent of negative
control as mean ± S.E.
Neg control: complete growth media, Neg control + solvent: complete growth media + 100 µg/ml acetone
solvent
68
Figure 2.4. Effects of CPE treatment on adipocyte cell viability. Treatments with same letter
are not statistically different. Data expressed as percent of negative control as mean ± S.E.
Neg control: complete growth media, Neg control + solvent: complete growth media + 100 µg/ml acetone
solvent
2.4.2 EFFECTS OF COCOA EXTRACT AND LEUCINE ON 3T3-L1 DIFFERENTIATION
AND LIPID ACCUMLATION
To isolate the effects of CPE and leucine upon pre-adipocyte differentiation and
adipocyte lipid metabolism, 3T3-L1 cells were treated either during differentiation (days 0-2)
or after differentiation (days 6-8), respectively. Following treatment, cells were stained with
Oil-Red-O to determine the effect of each treatment on cellular lipid content. In addition to a
standard control treatment (DMEM growth medium), a second set of control wells were
treated with DMEM growth medium supplemented with 100 µg/ml of the CPE extraction
solvent (70% acetone, 29.5% water, and 0.5% acetic acid) in order to differentiate between
the effects of the CPE solvent and the cocoa polyphenolic treatment. In addition, all
69
treatments, regardless of CPE concentration, were standardized to 100 µg/ml total extraction
solvent so as to mitigate any concentration-based cellular effects of the acetone mixture.
As shown in Figure 2.5, treatment of 3T3-L1 cells with CPE during differentiation
significantly decreased the final lipid content of the cells. As compared to the control
treatment, CPE treatment during differentiation decreased cellular lipid content by 17, 35,
and 50% at CPE treatments of 10, 50, and 100 µg/ml, respectively. Lipid decreases at 50 and
100 µg/ml were found to be statistically significant. Figure 2.6 shows microscopy images of
the (a) control treatment, (b) 50 µg/ml CPE treatment, and (c) 100 µg/ml CPE treatment after
Oil-Red-O staining. Uptake of the red Oil-Red-O stain within cells represents the differences
upon differentiation and lipid accumulation. In Figure 2.6a, 90% of pre-adipocytes
successfully differentiated into mature adipocytes after treatment with standard growth media
and the differentiation cocktail. Figures 2.6b and c show the 35 and 50% decrease in lipid
accumulation after 50 and 100 µg/ml CPE treatment, respectively, during differentiation.
While some cells differentiated to mature adipocytes during 50 µg/ml CPE treatment, Figure
2.6c shows that 100 µg/ml CPE treatment prevented major differentiation. At 100 µg/ml CPE
treatment, cells retained their pre-adipocyte morphology and fewer cells accumulated lipids.
70
Figure 2.5. Effects of CPE treatment on pre-adipocyte lipid accumulation during
differentiation. Treatments with same letter are not statistically different. Data expressed as
percent of negative control as mean ± S.E.
Neg control: complete growth media, Neg control + solvent: complete growth media + 100 µg/ml acetone
solvent
Figure 2.6. Effects of CPE on lipid accumulation and extent of cell differentiation as viewed
by microscopy after ORO lipid staining. Red color indicates presence of lipids within mature
adipocytes. (a) negative control, (b) 50 µg/ml CPE, and (c) 100 µg/ml CPE treatments.
71
These results are concurrent with (Min et al. 2012) who showed that 100 and 200
µg/ml CPE treatments during differentiation decreased cellular lipids by 30 and 72%,
respectively. Min and others (2012) also reported a decrease in fatty acid synthase with CPE
treatment, attributed to CPE treatment. Our results showed an additional 20% decrease in
lipid accumulation at 100 µg/ml CPE, likely due to differences in cocoa source and extraction
preparation. Similar levels of inhibition were observed with treatments of epigallocatechin
gallate and resveratrol-amplified grape skin extract (Chan et al. 2011, Lasa et al. 2012,
Zhang et al. 2012).
While pre-adipocytes possess the necessary genes for lipid accumulation, these genes
are not expressed until stimulated by extracellular factors (Rosen and Spiegelman 2000).
Thus, the observed decreases in lipid accumulation are due to an inhibition of the genes
necessary for pre-adipocyte differentiation. Inhibition of pre-adipocyte differentiation and the
accompanying decrease in lipid accumulation is attributed to CPE inhibition of the
transcription factors peroxisome proliferator-activated receptor-γ and -α (PPAR-γ, PPAR-α)
and CCAAT/enhancer binding protein-α (C/EBP-α), two proteins involved in transcription of
genes important to cell growth (Rayalam et al., 2008, Min et al. 2012). These factors increase
expression of adipocyte-specific genes, including those that regulate lipid synthesis (Rosen
2002). Min et al. (2012) also showed that compounds in CPE bind directly to the insulin
receptor and reduce phosphorylation of extracellular signal-regulated kinase (ERK) and
protein kinase b (Akt), critical downstream signals for cell proliferation.
Contradictory research on fat metabolism indicates that activation of PPAR by
polyphenolic compounds in mature cells may actually increase fatty acid oxidation. Genistein
72
isoflavones and grape flavonoids were found to increase PPAR mRNA and protein
expression in vitro, inducing fatty acid lipolysis (S. Kim et al. 2004, Goldwasser et al. 2010).
It must be mentioned that these studies were done with mature liver and kidney cells. This
research provides a comparison for the effects of polyphenolics in undifferentiated v. mature
cells, as well as between different cell types. It is possible that phenolic treatment
accomplishes the same goal across cell types, but through different mechanisms. As shown in
the present study and by Min et al. (2012), cocoa polyphenolics inhibit lipid accumulation in
immature adipocytes by inhibiting expression of PPAR-α. Conversely, in mature cells, or
potentially simply other cell types, phenolic treatment activates PPAR expression and
subsequent lipolysis, thus inhibiting lipid accumulation. More research is needed to
determine which specific polyphenolics downregulate lipid accumulation or upregulate
lipolysis in certain cell types. Figure 2.7 demonstrates the hypothetical regulatory effects of
polyphenolics upon PPAR in pre-adipocytes and adipocytes.
73
Figure 2.7. The hypothetical mechanistic effects of cocoa polyphenolics, alone and in
combination with leucine, on pre-adipocytes and adipocytes. Polyphenolic treatment of
adipocytes inhibits PPAR while treatment of adipocytes activates PPAR expression. Both
effects may result in reduced cellular lipid content.
As shown in Figure 2.8, treatment of mature adipocytes with 10, 50, and 100 µg/ml
CPE decreased cellular lipid contents by 19, 12, and 16%, respectively. Decreases were only
statistically significant at treatment levels of 10 and 100 µg/ml. This treatment demonstrated
the effects of CPE upon lipid accumulation in mature adipocytes as compared to preadipocyte differentiation during treatment days 0-2. CPE treatment of mature adipocytes did
not inhibit lipid accumulation to the same extent as in pre-adipocytes, nor did it follow a
significant dose-dependent trend.
74
Figure 2.8. Effects of CPE treatment on adipocyte lipid accumulation. Treatments with same
letter are not statistically different. Data expressed as percent of negative control as mean ±
S.E.
Neg control: complete growth media, Neg control + solvent: complete growth media + 100 µg/ml acetone
solvent
This observation corresponds with research conducted by (Kim et al. 2011), who
treated 3T3-L1 pre-adipocytes with curcumin during varying stages of differentiation. Their
results show that polyphenolic treatment during the earliest stage of differentiation (first two
days) have the most pronounced impact upon final cellular lipid content (Kim et al. 2011).
Curcumin treatment during early differentiation decreased lipid accumulation and
differentiation by 80-90% while treatment during intermediate and terminal differentiation
only decreased lipid accumulation by 20-40%. This indicates that CPE may have a greater
inhibitory effect upon PPAR-γ and C/EBP-α during the early stages of genetic transcription
75
and translation. After these adipocyte-specific genes have been activated, CPE only exerts a
limited effect upon inhibition of differentiation and lipid accumulation (Lasa et al. 2012).
1-15 mM leucine treatment of pre-adipocytes during or after differentiation did not
significantly affect lipid content, indicating that leucine alone does not affect the preadipocyte growth cycle or lipid metabolism (see Figure A.1 in Appendix). The results of
combined CPE and leucine treatment during differentiation are shown in Figure 2.9. 15 mM
leucine and 10, 50, and 100 µg/ml CPE treatment during differentiation decreased cellular
lipids by 10, 22, and 36%, respectively and were significantly different from both controls at
50 and 100 µg/ml. These decreases mirrored the dose-dependent trend in the isolated CPE
treatments but combined CPE and leucine inhibition of lipid accumulation was not as
extensive as that found with CPE treatments alone.
76
Figure 2.9. Effects of CPE + 15 mM Leu treatment on pre-adipocyte lipid accumulation
during differentiation. Treatments with same letter are not statistically different. Data
expressed as percent of negative control as mean ± S.E.
Neg control: complete growth media, Neg control + solvent: complete growth media + 100 µg/ml acetone
solvent
It is possible that cocoa polyphenols and leucine competed for similar cellular binding
sites or that polyphenols and leucine may affect cell growth and metabolism through
conflicting mechanisms. It is also possible that the presence of leucine prevented or changed
the binding affinity of polyphenols to cellular receptors. The strong affinity between proteins
and polyphenols has been established in the literature; compound binding affinities are
dependent upon number and strength of charges. In a study of polyphenol-protein binding,
(Nagy et al. 2012) found that catechin-like polyphenols bind well to highly charged protein
sequences. Leucine has a partial positive and partial negative charge in neutral cell culture
media and exhibits surfactant, or emulsifying, properties. However, Kanakis et al. (2011)
77
reported that catechins interact with β-lactoglobulin through both hydrophilic and
hydrophobic contacts. While catechin and β-lactoglobulin bound weakly in buffered solution,
leucine and isoleucine accounted for four of the thirteen amino acid residues involved in
stable catechin binding (Kanakis et al. 2011). Though leucine was present as a single amino
acid in this study, rather than in a protein, it is possible that it may competitively inhibit
polyphenolic cocoa compounds from interacting with cell surface receptor binding. In the
present study, leucine appears to dampen the effects of CPE upon adipocyte lipid
accumulation. However, it is still unclear how well cocoa polyphenolic compounds may bind
to leucine in solution and how this may impact CPE bioactivity.
Treatment of 3T3-L1 cells with leucine was intended to model the effects of whey
protein metabolism on pre-adipocytes and adipocytes. When compared to other food-derived
proteins, whey proteins contain a significantly higher proportion of the branched chain amino
acids leucine, isoleucine, and valine (Luhovyy, Akhavan, and Anderson 2007). Leucine is of
particular interest in muscle anabolism and lipid metabolism because it has been shown to
enter the blood stream faster than other amino acids. In vitro and in vivo, leucine and whey
protein has been shown to decrease expression of fatty acid synthase in adipocytes, to
increase fatty acid oxidation in muscle cells, to improve body composition, and to limit
weight gain (Pichon et al. 2007, Sun and Zemel 2007, Pal, Ellis, and Dhaliwal 2010). In the
case of leucine, the insignificant changes in lipid metabolism observed in this study could be
explained by cellular signaling of the mammalian target of rapamycin (mTOR) (Dann,
Selvaraj, and Thomas 2007). This protein kinase integrates signals from insulin, growth
factors, and amino acids and detects cellular nutrient and energy levels (Roh et al. 2003). In
78
addition, mTOR regulates cell growth and protein synthesis and maintains lean body mass
during times of energy deficit (Layman and Walker 2006, Dann, Selvaraj, and Thomas
2007). Amino acids, and leucine in particular, have been suggested to act as potent ligands of
the mTOR signaling cascade and its subsequent upregulation of protein synthesis (Kimball
and Jefferson 2006). One would then predict that leucine treatment in this study may have
stimulated protein synthesis, controlled by mTOR signaling, while having little effect upon
cellular lipid accumulation. In addition, because the pre-adipocytes and mature adipocytes
were isolated in vitro, the effects of endocrine signaling between different types of cells upon
lipid metabolism in the presence of leucine and CPE cannot be determined.
50% of mature fat cells are replaced only every eight years, indicating that the
regulation of adipocyte lipid metabolism in vivo may have a greater impact upon controlling
obesity than the regulation of pre-adipocyte differentiation into mature fat cells (MorenoNavarrete and Fernández-Real 2012). While CPE demonstrated greater effects in preadipocyte lipid accumulation, the smaller decreases observed in adipocyte lipid accumulation
indicate that cocoa could still be beneficial in controlling fat accumulation over time.
2.4.3 EFFECTS OF COCOA EXTRACT AND LEUCINE ON 3T3-L1 LEPTIN SECRETION
To determine the effects of CPE and leucine on leptin secretion, differentiated
adipocytes were treated with 0.5-100 µg/ml CPE or 1-15 mM leucine. Adipocyte leptin
secretion is partially controlled by the mTOR pathway, which is upregulated by insulin (
Szkudelski 2007). Thus, 0.5 µM insulin treatment (with acetone solvent) served as a positive
control for leptin production. As shown in Figure 2.10, CPE treatment elicited a reversed
79
dose-dependent trend: the lowest CPE treatments (0.5, 1, and 5 µg/ml) increased leptin
production above that of the negative control by 66, 17, and 10%, respectively. Only the 0.5
µg/ml CPE treatment was significantly different from the negative control. However, this
upregulation was not significantly different than that of the positive control or the negative
control containing acetone solvent. Higher CPE treatments of 50 and 100 µg/ml significantly
decreased leptin production, 78% below that of the negative control.
These concentration-based results provide an interesting contrast to the inhibition of
lipid accumulation by CPE. While high CPE treatments (10-100 µg/ml) were most effective
in inhibiting lipid accumulation in pre-adipocytes, the lowest CPE treatments (0.5-5 µg/ml)
were most effective in increasing cellular leptin secretion in mature adipocytes. This suggests
that polyphenolic compounds may exhibit hormesis-like effects upon pre-adipocyte and
adipocyte metabolism; inhibition of lipid accumulation or upregulation of leptin production
appears to be concentration specific.
80
Figure 2.10. Leptin secretion in adipocytes treated with CPE. Treatments with same letter
are not statistically different. Data expressed as mean ± S.E.
Neg control: complete growth media, Neg control + solvent: complete growth media + 100 µg/ml acetone
solvent, Pos control + solvent: complete growth media + 0.5 µM insulin + 100 µg/ml acetone solvent
To test the effects of leucine upon leptin secretion, leucine treatments were
administered as a supplementation of regular growth media. All treatment groups were
provided with basic DMEM growth medium supplemented with FBS and provided 32 mM
total protein in the form of amino acids. Leucine treatments of 1, 5, 10, and 15 mM
represented growth media amino acid supplementations of 3.5, 17, 30, and 50%, respectively.
These treatments were meant to be representative of protein supplementation treatments
commonly found in in vivo and clinical trial studies. With this treatment method, the cells
were provided with a surplus, and variety, of amino acids in addition to all essential nutrients.
81
Leucine supplementation in this manner was designed to prevent cellular nutrient starvation
and subsequent misleading results.
As shown in Figure 2.11, all leucine treatments were effective in upregulating leptin
secretion by 37, 36, 26, and 26% above that of the negative control (at 1, 5, 10, and 15 mM
leucine treatments, respectively). All leucine treatments were significantly higher than the
control. The combined effects of CPE and leucine upon leptin secretion were less clear
(Figure 2.12). Because the most significant increases in leptin secretion were observed at the
lowest CPE treatment, all leucine treatment concentrations were combined with 0.5 µg/ml
CPE. 1, 5, and 10 mM leucine treatments combined with 0.5 µg/ml CPE showed similar
leptin secretion to the negative control. Only the 15 mM leucine + 0.5 µg/ml CPE treatment
significantly increased leptin secretion above that of the negative control, by 14%, but was
still significantly lower than the negative control with acetone solvent and the positive
control.
82
Figure 2.11. Leptin secretion in adipocytes treated with leucine. Treatments with same letter
are not statistically different. Data expressed as mean ± S.E.
Neg control: complete growth media, Pos control: complete growth media + 0.5 µM insulin
83
Figure 2.12. Leptin secretion in adipocytes treated with leucine and 0.5 µg/ml CPE.
Treatments with same letter are not statistically different. Data expressed as mean ± S.E.
Neg control: complete growth media, Neg control + solvent: complete growth media + 100 µg/ml acetone
solvent, Pos control + solvent: complete growth media + 0.5 µM insulin + 100 µg/ml acetone solvent
While this study found increases in leptin secretion after CPE and leucine treatment,
the increases observed here were not as pronounced as those in similar studies. In vitro
induction of adipocyte leptin secretion by leucine was demonstrated by Roh et al. (2003).
Treatment of adipocytes with 5 mM leucine increased leptin secretion 4-5 fold within four
hours of treatment (Roh et al. 2003). Cammisotto et al. (2006) showed that leucine and
glutamate increased leptin secretion by almost 2-fold and slightly increased intracellular
leptin content. In vivo, a high leucine meal increased plasma leptin in rats by 3 fold, peaking
three hours post-feeding (Lynch et al. 2006). The same authors found that in vivo leptin
84
secretion decreased by 40% in rats fed leucine-deficient meals (Lynch et al. 2006). Oral
gavage of leucine and norleucine also increased plasma leptin concentrations, but not to the
same extent as when incorporated into a meal.
The differences in magnitude of leptin secretion observed in this study may be
explained by the treatment method. This study examined the effects of leucine
supplementation of basic growth media while studies by (Roh et al. 2003, Cammisotto et al.
2005) treated adipocytes with leucine in phosphate buffer, in the absence of other energy
substrates. The availability of all necessary energy substrates in the present study may have
diminished the expected increases in leptin secretion.
Cammisotto et al. (2005) showed that the presence of glucose was correlated with the
maintenance of basal leptin and slight increases in leptin secretion in adipocytes. However,
high glucose levels did not increase leptin production beyond that of low glucose treatment
(Cammisotto et al. 2005). As aforementioned, insulin and leucine have both been found to be
positive regulators of leptin secretion through the mTOR-signaling pathway (Lynch et al.
2006). Though insulin increases mTOR signaling and leptin secretion and served as the
positive control in this study, it is important to note that insulin and leucine regulate mTOR
through different mechanisms, an important, but subtle, distinction in signaling that could
account for the complexities observed in leptin secretion studies in vitro (Avruch et al. 2008).
Treatment with insulin or amino acids have been shown to strongly increase leptin
synthesis: insulin doubled leptin production in the presence of glucose while the effects of
individual amino acids varied (Cammisotto et al., 2005, Cammisotto and Bendayan 2007). Lglycine and L-alanine maintained basal leptin production but did not contribute to increased
85
leptin secretion in the presence of insulin. L-aspartate, L-valine, L-methionine, and Lphenylalanine increased leptin secretion in the presence of both insulin and glucose
(Cammisotto et al. 2005). L-leucine and L-glutamate increased leptin levels in the presence
and absence of insulin or glucose. In addition, it was found that these dietary substrates must
be broken down in order to induce leptin secretion (Cammisotto et al. 2005). The basic
DMEM + FBS growth media used to culture pre-adipocytes contained all of these basic
amino acids as well as glucose. Thus, interacting effects of the other energy substrates may
have masked the effects of leucine.
The amino acid supplementation method may also explain the decrease in leptin
secretion with increasing leucine treatment concentration. Above 10 mM, the leucine content
may have saturated cellular receptors so that the presence of additional amino acids had no
further effect upon mTOR signaling. Though more complicated to interpret, the media
supplementation method may provide a more realistic observation of the effects of leucine
upon adipocytes in vitro and thus, may serve as a better model and predictor for higher
animal studies.
Few studies have examined the effects of polyphenolic compounds on leptin and
signaling peptide secretion in adipocytes. (−)-Catechin and green tea polyphenolic treatment
of 3T3-L1 adipocytes increased secretion of adiponectin, a protein that regulates glucose
levels and fatty acid metabolism (Cho et al. 2006). It was observed that (−)-catechin
suppressed expression of Kruppel-like factor 7, increasing adiponectin levels as well as
leptin, PPAR-γ, and C/EBP-α expression. In vivo, Décordé et al (2009) supplemented high
fat hamster diets with chardonnay grape polyphenols, which prevented weight gain,
86
increased adiponectin production, and decreased insulin resistance. However, leptin
production was also decreased. Treatment of insulin-resistant 3T3-L1 adipocytes with 4-100
µg/ml polyphenolic extracts from Hibiscus sabdariffa was found to significantly decrease
secretion of eight adipokines, including leptin secretion by 20-50% (Herranz-López et al.
2012). The results from Herranz-López et al (2012) and the present study suggest that the
positive or negative effects of polyphenols upon biomarkers of obesity may be concentrationspecific. Polyphenolic treatment in vitro may follow a J-shaped curve, in which lower
concentrations of polyphenolics decrease obesity risk factors while higher treatments
increase risk.
Any in vitro cell culture study must mention the inherent variability of cells grown
outside of the body. Adipocytes in vitro have been shown to express only 1% of the total
leptin expressed by adipocytes in vivo, somewhat limiting their use as a model of fat mass in
vivo (MacDougald et al. 1995). It follows that the picogram level leptin concentrations
quantified by ELISA assays in vitro require the investigator to make conclusions from slim
margins in leptin secretion. However, the conclusions extrapolated from in vitro observations
serve as an adequate initial indication of adipocyte response to specific and controlled
environmental conditions.
2.5 CONCLUSIONS
These cell culture experiments evaluated the effects of CPE and leucine on three
aspects of obesity and weight management: pre-adipocyte differentiation, adipocyte lipid
accumulation, and adipocyte leptin secretion. The results indicate that both cocoa
87
polyphenols and whey protein metabolites have the potential to positively affect lipid
metabolism and satiety signaling. However, these compounds appear to have greater impacts
upon specific aspects of physiological obesity and satiety.
Cocoa polyphenolic treatment had the greatest effect upon limiting lipid accumulation
in pre-adipocytes during differentiation. Significant decreases in pre-adipocyte differentiation
and lipid accumulation of 35 and 50% were found at CPE concentrations of 50 and 100
µg/ml, respectively. CPE treatment of adipocytes post-differentiation significantly decreased
lipid accumulation by 19 and 16% at 10 and 100 µg/ml, respectively. This indicates that
cocoa polyphenols are more effective in preventing formation of new fat cells than
preventing lipid storage and expansion of existing fat cells. Leucine treatment had no effect
upon adipocyte lipid metabolism but combinations of 15 mM leucine and 50 and 100 µg/ml
CPE treatment during differentiation decreased cellular lipids by 22 and 36%, respectively.
Thus, CPE treatment was slightly less effective in the presence of a leucine.
0.5 µg/ml CPE increased leptin secretion by 66% over the negative control but was
not significantly higher than the positive control. 50 and 100 µg/ml CPE treatment almost
completely inhibited leptin secretion. 1-15 mM leucine increased leptin by 26-37% and the
combination of 0.5 µg/ml CPE and 15 mM leucine increased leptin secretion by 14% above
the negative control but was significantly lower than the positive control. CPE was observed
to have opposing concentration-dependent effects upon both lipid accumulation and leptin
secretion. Of the outputs measured, leucine had a much greater impact upon leptin secretion
than lipid accumulation.
88
This study indicates that cocoa polyphenols may be beneficial in decreasing body fat
and that both cocoa polyphenols and leucine may increase satiety by upregulating adipocyte
leptin secretion. Cocoa and whey ingredients, individually and in combination, show promise
in the formulation of foods that increase satiety and fat metabolism and aid in weight
management and the mitigation of hunger. The cocoa extract tested in this study contained
cocoa polyphenolics as they exist in plants, rather than their in vivo metabolites. To better
model the effects of cocoa consumption in vivo, further research must be conducted to
determine the effects of catechin and proanthocyanidin metabolites upon pre-adipocyte lipid
accumulation and adipocyte leptin production.
89
2.6 REFERENCES
Adamson, Gary E., Sheryl A. Lazarus, Alyson E. Mitchell, Ronald L. Prior, Guohua Cao,
Pieter H. Jacobs, Bart G. Kremers, et al. 1999. “HPLC Method for the Quantification
of Procyanidins in Cocoa and Chocolate Samples and Correlation to Total
Antioxidant Capacity.” Journal of Agricultural and Food Chemistry 47 (10): 4184–
88.
Avruch, J., X. Long, S. Ortiz-Vega, J. Rapley, A. Papageorgiou, and N. Dai. 2008. “Amino
Acid Regulation of TOR Complex 1.” AJP: Endocrinology and Metabolism 296 (4):
E592–E602.
Benelam, B. 2009. “Satiation, Satiety and Their Effects on Eating Behaviour.” Nutrition
Bulletin 34 (2): 126–73.
Boirie, Yves, Martial Dangin, Pierre Gachon, Marie-Paule Vasson, Jean-Louis Maubois, and
Bernard Beaufrère. 1997. “Slow and Fast Dietary Proteins Differently Modulate
Postprandial Protein Accretion.” Proceedings of the National Academy of Sciences 94
(26): 14930–35.
Brand-Miller, Jennie, Susanna H.A. Holt, Vanessa de Jong, and Peter Petocz. 2003. “Cocoa
Powder Increases Postprandial Insulinemia in Lean Young Adults.” The Journal of
Nutrition 133 (10): 3149–52.
Cammisotto, P.G., and Moise Bendayan. 2007. “Leptin Secretion by White Adipose Tissue
and Gastric Mucosa.” Histology and Histopathology 22: 199-210.
Cammisotto, P.G., Yves Gelinas, Yves Deshaies, and Ludwik J. Bukowiecki. 2005.
“Regulation of Leptin Secretion from White Adipocytes by Insulin, Glycolytic
Substrates, and Amino Acids.” AJP: Endocrinology and Metabolism 289 (1): E166–
E171.
Cammisotto, Philippe G., Ludwik J Bukowiecki, Yves Deshaies, and Moise Bendayan. 2006.
“Leptin Biosynthetic Pathway in White Adipocytes.” Biochemistry and Cell Biology
84 (2): 207–14.
Chan, Cheuk Ying, Lai Wei, Federico Castro-Muñozledo, and Wing Leung Koo. 2011. “(−)Epigallocatechin-3-Gallate Blocks 3T3-L1 Adipose Conversion by Inhibition of Cell
Proliferation and Suppression of Adipose Phenotype Expression.” Life Sciences 89
(21-22): 779–85.
Cho, S.Y., P.J. Park, H.J. Shin, Y.K. Kim, D.W. Shin, E.S. Shin, H.H. Lee, B.G. Lee, J.H.
Baik, and T.R. Lee. 2006. “(-)-Catechin Suppresses Expression of Kruppel-like
90
Factor 7 and Increases Expression and Secretion of Adiponectin Protein in 3T3-L1
Cells.” AJP: Endocrinology and Metabolism 292 (4): E1166–E1172.
Dann, Stephen G., Anand Selvaraj, and George Thomas. 2007. “mTOR Complex1–S6K1
Signaling: At the Crossroads of Obesity, Diabetes and Cancer.” Trends in Molecular
Medicine 13 (6): 252–59.
De Graaf, Cees, Wendy A.M. Blom, Paul A.M. Smeets, Annette Stafleu, and Henk F.J.
Hendriks. 2004. “Biomarkers of Satiation and Satiety.” The American Journal of
Clinical Nutrition 79 (6): 946–61.
Fu, Zhuo, Julia Yuskavage, and Dongmin Liu. 2013. “Dietary Flavonol Epicatechin Prevents
the Onset of Type 1 Diabetes in Nonobese Diabetic Mice.” Journal of Agricultural
and Food Chemistry 61 (18): 4303–9.
Goldwasser, Jonathan, Pazit Y. Cohen, Eric Yang, Patrick Balaguer, Martin L. Yarmush, and
Yaakov Nahmias. 2010. “Transcriptional Regulation of Human and Rat Hepatic Lipid
Metabolism by the Grapefruit Flavonoid Naringenin: Role of PPARα, PPARγ and
LXRα.” Edited by Catherine A. Wolkow. PLoS ONE 5 (8): e12399.
Grassi, Davide, Giovambattista Desideri, Stefano Necozione, Cristina Lippi, Raffaele Casale,
Giuliana Properzi, Jeffrey B. Blumberg, and Claudio Ferri. 2008. “Blood Pressure Is
Reduced and Insulin Sensitivity Increased in Glucose-Intolerant, Hypertensive
Subjects after 15 Days of Consuming High-Polyphenol Dark Chocolate.” The Journal
of Nutrition 138 (9): 1671–76.
Gu, Yeyi, William J. Hurst, David A. Stuart, and Joshua D. Lambert. 2011. “Inhibition of
Key Digestive Enzymes by Cocoa Extracts and Procyanidins.” Journal of
Agricultural and Food Chemistry 59 (10): 5305–11.
Hall, W.L., D.J. Millward, S.J. Long, and L.M. Morgan. 2007. “Casein and Whey Exert
Different Effects on Plasma Amino Acid Profiles, Gastrointestinal Hormone
Secretion and Appetite.” British Journal of Nutrition 89 (02): 239.
Herranz-López, María, Salvador Fernández-Arroyo, Almudena Pérez-Sanchez, Enrique
Barrajón-Catalán, Raúl Beltrán-Debón, Javier Abel Menéndez, Carlos AlonsoVillaverde, Antonio Segura-Carretero, Jorge Joven, and Vicente Micol. 2012.
“Synergism of Plant-Derived Polyphenols in Adipogenesis: Perspectives and
Implications.” Phytomedicine 19 (3-4): 253–61.
Hwang, Cheng-Shine, Thomas M. Loftus, Susanne Mandrup, and M. Daniel Lane. 1997.
“Adipocyte Differentiation and Leptin Expression.” Annual Review of Cell and
Developmental Biology 13: 231–59.
91
Jalil, Abbe Maleyki, Amin Ismail, Pei Pei Chong, Muhajir Hamid, and Syed Hasbullah Syed
Kamaruddin. 2009. “Effects of Cocoa Extract Containing Polyphenols and
Methylxanthines on Biochemical Parameters of Obese-Diabetic Rats.” Journal of the
Science of Food and Agriculture 89 (1): 130–37.
Kanakis, C.D., Imed Hasni, Philippe Bourassa, P.A. Tarantilis, M.G. Polissiou, and HeidarAli Tajmir-Riahi. 2011. “Milk Β-Lactoglobulin Complexes with Tea Polyphenols.”
Food Chemistry 127 (3): 1046–55.
Katsanos, C.S., Hisamine Kobayashi, Melinda Sheffield-Moore, Asle Aarsland, and Robert
R Wolfe. 2006. “A High Proportion of Leucine Is Required for Optimal Stimulation
of the Rate of Muscle Protein Synthesis by Essential Amino Acids in the Elderly.”
AJP: Endocrinology and Metabolism 291 (2): E381–E387.
Kim, Choon Young, Thuc T. Le, Chihyu Chen, Ji-Xin Cheng, and Kee-Hong Kim. 2011.
“Curcumin Inhibits Adipocyte Differentiation through Modulation of Mitotic Clonal
Expansion.” The Journal of Nutritional Biochemistry 22 (10): 910–20.
Kim, Hyojung, and Kazuichi Sakamoto. 2012. “(−)-Epigallocatechin Gallate Suppresses
Adipocyte Differentiation through the MEK/ERK and PI3K/Akt Pathways.” Cell
Biology International 36 (2): 147–53.
Kim, Sujong, Hye-Jin Shin, Sun Young Kim, Ji Hyun Kim, Yong Sung Lee, Duck-Hee Kim,
and Mi-Ock Lee. 2004. “Genistein Enhances Expression of Genes Involved in Fatty
Acid Catabolism through Activation of PPARα.” Molecular and Cellular
Endocrinology 220 (1-2): 51–58.
Kimball, Scot R., and Leonard S. Jefferson. 2006. “Signaling Pathways and Molecular
Mechanisms through Which Branched-Chain Amino Acids Mediate Translational
Control of Protein Synthesis.” The Journal of Nutrition 136 (1): 227S–231S.
Lasa, Arrate, Itziar Churruca, Itziar Eseberri, Cristina Andrés-Lacueva, and María P. Portillo.
2012. “Delipidating Effect of Resveratrol Metabolites in 3T3-L1 Adipocytes.”
Molecular Nutrition & Food Research 56 (10): 1559–68.
Layman, Donald K. and Denise A. Walker. 2006. “Potential Importance of Leucine in
Treatment of Obesity and the Metabolic Syndrome.” The Journal of Nutrition 136
(1): 319S–323S.
Luhovyy, Bohdan L., Tina Akhavan, and G. Harvey Anderson. 2007. “Whey Proteins in the
Regulation of Food Intake and Satiety.” Journal of the American College of Nutrition
26 (6): 704S–712S.
92
Lynch, C. J., Beth Gern, Carlyn Lloyd, Susam M Hutson, Rachel Eicher, and Thomas C
Vary. 2006. “Leucine in Food Mediates Some of the Postprandial Rise in Plasma
Leptin Concentrations.” AJP: Endocrinology and Metabolism 291 (3): E621–E630.
MacDougald, Ormond A., Cheng-Shine Hwang, Haiying Fan, and M. Daniel Lane. 1995.
“Regulated Expression of the Obese Gene Product (leptin) in White Adipose Tissue
and 3T3-L1 Adipocytes.” Proceedings of the National Academy of Sciences 92 (20):
9034–37.
Magalhães, Luís M., Fernando Santos, Marcela A. Segundo, Salette Reis, and José L.F.C.
Lima. 2010. “Rapid Microplate High-Throughput Methodology for Assessment of
Folin-Ciocalteu Reducing Capacity.” Talanta 83 (2): 441–47.
Matsui, Naoko, Ryoichi Ito, Eisaku Nishimura, Mariko Yoshikawa, Masatoshi Kato,
Masanori Kamei, Haruki Shibata, Ichiro Matsumoto, Keiko Abe, and Shuichi
Hashizume. 2005. “Ingested Cocoa Can Prevent High-Fat Diet-Induced Obesity by
Regulating the Expression of Genes for Fatty Acid Metabolism.” Nutrition 21 (5):
594–601.
McAllan, Liam, Deirdre Keane, Harriët Schellekens, Helen M. Roche, Riitta Korpela, John
F. Cryan, and Kanishka N. Nilaweera. 2013. “Whey Protein Isolate Counteracts the
Effects of a High-Fat Diet on Energy Intake and Hypothalamic and Adipose Tissue
Expression of Energy Balance-Related Genes.” British Journal of Nutrition, June, 1–
13.
Min, S.Y., H. Yang, S.G. Seo, S.H. Shin, M-Y Chung, J. Kim, S.J. Lee, H.J. Lee, and K.W.
Lee. 2012. “Cocoa Polyphenols Suppress Adipogenesis in Vitro and Obesity in Vivo
by Targeting Insulin Receptor.” International Journal of Obesity 37 (4): 584–92.
Moreno-Navarrete, José María, and José Manuel Fernández-Real. 2012. “Adipocyte
Differentiation.” In Adipose Tissue Biology, edited by Michael E. Symonds, 17–38.
New York, NY: Springer New York.
Nagy, Kornél, Marie-Claude Courtet-Compondu, Gary Williamson, Serge Rezzi, Martin
Kussmann, and Andreas Rytz. 2012. “Non-Covalent Binding of Proteins to
Polyphenols Correlates with Their Amino Acid Sequence.” Food Chemistry 132 (3):
1333–39.
Pal, Sebely, Vanessa Ellis, and Satvinder Dhaliwal. 2010. “Effects of Whey Protein Isolate
on Body Composition, Lipids, Insulin and Glucose in Overweight and Obese
Individuals.” British Journal of Nutrition 104 (05): 716–23.
93
Panickar, Kiran S. 2013. “Effects of Dietary Polyphenols on Neuroregulatory Factors and
Pathways That Mediate Food Intake and Energy Regulation in Obesity.” Molecular
Nutrition & Food Research 57 (1): 34–47.
Phrakonkham, Pascal, Say Viengchareun, Christine Belloir, Marc Lombès, Yves Artur, and
Marie-Chantal Canivenc-Lavier. 2008. “Dietary Xenoestrogens Differentially Impair
3T3-L1 Preadipocyte Differentiation and Persistently Affect Leptin Synthesis.” The
Journal of Steroid Biochemistry and Molecular Biology 110 (1-2): 95–103.
Roh, Cecilia, Jianrong Han, Alexandros Tzatsos, and Konstantin V. Kandror. 2003.
“Nutrient-Sensing mTOR-Mediated Pathway Regulates Leptin Production in Isolated
Rat Adipocytes.” American Journal of Physiology-Endocrinology And Metabolism
284 (2): E322–E330.
Rosen, E.D. 2002. “C/EBPalpha Induces Adipogenesis through PPARgamma : A Unified
Pathway.” Genes & Development 16 (1): 22–26. doi:10.1101/gad.948702.
Rosen, E.D., and Bruce M. Spiegelman. 2000. “Molecular Regulation of Adipogenesis.”
Annu. Rev. Cell Dev. Biol 16: 145–71.
Sørensen, L.B., and A. Astrup. 2011. “Eating Dark and Milk Chocolate: A Randomized
Crossover Study of Effects on Appetite and Energy Intake.” Nutrition and Diabetes 1
(12): e21.
Sun, Xiaocun, and Michael B. Zemel. 2007. “Leucine and Calcium Regulate Fat Metabolism
and Energy Partitioning in Murine Adipocytes and Muscle Cells.” Lipids 42 (4): 297–
305.
Szkudelski, Tomasz. 2007. “Intracellular Mediators in Regulation of Leptin Secretion from
Adipocytes.” Physiological Research 56 (5): 503.
Zhang, Xian-Hua, Bo Huang, Soo-Kyong Choi, and Jung-Sook Seo. 2012. “Anti-Obesity
Effect of Resveratrol-Amplified Grape Skin Extracts on 3T3-L1 Adipocytes
Differentiation.” Nutrition Research and Practice 6 (4): 286.
94
CHAPTER 3: THE EFFECTS OF COCOA
POLYPHENOLICS AND WHEY PROTEIN ON
BIOMARKERS OF SATIETY AND GLUCOSE
METABOLISM IN A HUMAN CLINICAL TRIAL
95
3.1 ABSTRACT
Low-calorie, hunger-suppressing snacks are important in regulating daily calorie
intake and in preventing long-term weight gain. While flavored whey protein beverages are
popular supplements for muscle recovery, the combined effects of whey protein and cocoa
upon satiety are unknown. Whey protein has been demonstrated to decrease subjective
ratings of hunger and ad libitum calorie intake as well as to increase levels of satiation and
satiety hormones. Cocoa polyphenolics may moderate glucose levels and increase
physiological and psychological markers of satiety. This study was a six-week clinical trial in
which nine healthy panelists (age: 22.6 ± 1.7; BMI: 22.3 ± 2.1) consumed chocolate-protein
beverages once per week. Isocaloric beverage formulations included: placebo, whey protein
isolate (WPI), low polyphenolic cocoa (LP), high polyphenolic cocoa (HP), LP-WPI, and
HP-WPI. Panelists responded to a hunger questionnaire, measured blood glucose levels, and
provided blood samples in a fasted state and 0.5, 1, 2, and 4 hours following beverage
consumption. Hunger ratings were measured using a 100 mm visual analogue scale (VAS),
blood glucose levels were measured using a commercial blood sugar meter, and serum leptin
and adiponectin levels were assayed with appropriate ELISA kits. Beverage formulation with
WPI decreased ratings of hunger while HP cocoa suppressed hunger more than LP cocoa. At
30 minutes post-consumption, the WPI, HP-WPI, and LP-WPI beverages increased blood
glucose 8, 12, and 16% above baseline levels, respectively, compared to increases of 27, 39,
and 58% in HP, LP, and placebo beverages, respectively. The moderation of blood glucose
levels by WPI and HP cococa was statistically significant as compared to the placebo. Serum
leptin decreased after consumption of all beverages while all WPI and cocoa-containing
96
beverages significantly increased adiponectin levels above that of the placebo. This study
indicates that WPI and high polyphenolic cocoa may have beneficial effects, alone and in
combination, upon feelings of satiety and blood glucose and adiponectin levels.
3.2 INTRODUCTION
Obesity is an epidemic with a multitude of causes, including the availability,
affordability, and convenience of high calorie foods as well as an increase in sedentary
lifestyles (Asp 1999, Finkelstein, Ruhm, and Kosa 2005). The prevailing treatment of obesity
advises a reduction in calorie consumption and an increase in energy expenditure. However,
this ideology is based solely upon physiological factors that impact food intake and does not
consider more subjective, psychological influences including social and emotional factors.
From a scientific perspective, these factors are difficult, perhaps impossible, to control. In
addition, research suggests that individual-specific physiological conditions, such as leptin
resistance, may hinder or prevent weight loss (Lustig 2006, Myers, Cowley, and Münzberg
2008). These sometimes conflicting and entangled factors only increase the difficulty in
identifying effective approaches to weight management.
Food structure and texture, as well as macro and micromolecular composition, have
physiological and psychological effects upon food consumption and fullness between meals.
Altering the formulation, oral perception, and breakdown of food products may increase
feelings of satiety and decrease calorie intake. Specifically, foods that require extensive
chewing action or that provide a large volume with low calorie density, such as soups and
beverages, may slow food consumption and signal additional fullness to the brain (Mattes
97
and Campbell 2009). Generally, subjective rating and ad libitum feeding studies have
indicated that solid foods induce greater satiety than liquids (Tieken et al. 2007, Leidy,
Bales-Voelker, and Harris 2011). A study of oral and gastric stimulation found that both
chewing without ingestion of food and intestinal infusion with liquid decreased ad libitum
food intake (Wijlens et al. 2012). Though it is generally accepted that solid foods provide
higher satiety than liquid foods when total calories and macronutrients are equal, many
studies also indicate that the stomach-filling sensation induced by liquid foods may
compensate for the lack of mastication time (Stull et al. 2008). However, these studies have
not found differences in satiety hormone profiles between solid and liquid foods.
Selection of specific ingredients may also aid in controlling fat accumulation and
satiety, or the feeling of fullness between meals (Cammisotto et al. 2005, Sun and Zemel
2007, Min et al. 2012). Protein and fiber in particular appear to be determining factors of
post- and between-meal satiety (Veldhorst et al. 2008, Benelam 2009). Pasiakos et al. (2013)
showed that variations in protein consumption did not affect total weight loss but that higher
protein consumption (2-3 times the recommended dietary intake) increased overall fat loss
and improved body composition. In general, diets consisting of greater than 30% calories
from protein are more effective in inducing satiety and reducing food intake (Weigle et al.
2005, Lejeune et al. 2006, Veldhorst et al. 2008). It is suggested that the feeling of satiety
provided by protein requires fewer grams and calories than that obtained from carbohydrates
or lipids, thereby reducing total calorie intake and speeding weight loss. This satiety may be
attributed to an increase in plasma levels of the satiation and satiety hormones GLP-1, CCK,
98
PYY and leptin or an increase in plasma amino acid levels (Westerterp-Plantenga et al. 1999,
Lejeune et al. 2006).
While it is apparent that protein induces greater satiety than lipids or carbohydrates,
there is no uniform agreement on a specific type or percent of daily protein calories
necessary for increasing satiety (Benelam 2009). Clinical trials by Lang et al. (1998) found
no differences between egg albumin, casein, gelatin, soy protein, pea protein, or wheat gluten
on satiety. Aldrich et al. (2011) also found no significant differences in weight loss, fat loss,
or satiety ratings among subjects fed low protein, whey protein, or mixed protein diets.
However, the whey protein diet induced greater regional fat loss and lowered blood pressure
(Aldrich et al. 2011). Of those studies that indicate differences between specific proteins,
whey, pea, and soy appear most promising in increasing satiety (Anderson et al. 2004,
Diepvens, Häberer, and Westerterp-Plantenga 2007).
In comparison to other proteins, whey has a higher proportion of branched chain
amino acids and is more rapidly absorbed, quickly increasing plasma amino acids levels
(Boirie et al. 1997, Farnfield et al. 2009). Pal and Ellis (2010) found that a whey protein meal
increased satiety and plasma insulin response and decreased ad libitum intake at a subsequent
meal when compared to tuna, turkey, and egg albumin. Direct comparisons of milk proteins
found that whey protein decreases ad libitum food intake by 19% and increases satiety
ratings when compared to casein (Hall et al. 2007). Whey proteins also increased
postprandial plasma amino acids, CCK, and GLP-1 levels by 28%, 60%, and 65%,
respectively, above that of casein (Hall et al. 2007). This effect may be attributed to amino
99
acid stimulation of the mammalian target of rapamycin signaling (mTOR) pathway, which
regulates insulin signaling and muscle synthesis (Morrison et al. 2007).
A limited amount of research has indicated that micronutrients such as polyphenolic
compounds may also contribute to satiety and fat metabolism. Polyphenols bind strongly to
proteins and have been shown to bind digestive enzymes in vitro, demonstrating their
potential to slow digestion and nutrient metabolism (Gu et al. 2011, Barrett et al., 2013). In
vivo, green tea catechins were also shown to increase satiety and fullness and to limit lipid
nutrient absorption by inhibiting pancreatic phospholipase A2 (Wang, Noh, and Koo 2006,
Josic et al. 2010). Chocolate-specific human clinical studies show that consumption of
polyphenol-rich dark chocolate decreased hunger ratings and ad libitum intake by 17% and
increased satiety more than milk chocolate (Sørensen and Astrup 2011). In obese-diabetic
rats, treatment with cocoa extract was found to significantly reduce plasma glucose, free fatty
acid, and oxidative stress biomarker levels as well as to increase the activity of the
antioxidant enzyme superoxide dismutase in the hours following treatment (Jalil et al. 2008).
The available literature and results of cell culture studies reported in Chapter 2
suggest that cocoa and whey protein ingredients, individually and in combination, may
increase satiety and prevent lipid accumulation. The present study is the first to examine the
effects of high cocoa polyphenolic doses on satiety and the first to combine these
polyphenolics with whey protein in a human clinical trial. The aim of the study was to isolate
the effects of cocoa polyphenolics and whey proteins upon physiological satiety and glucose
metabolism. We hypothesized that combinations of cocoa and whey protein would exhibit
100
additive or synergistic modulatory effects upon satiety hormone levels, subjective ratings of
satiety, and plasma glucose levels.
3.3 MATERIALS AND METHODS
3.3.1 SUBJECTS
All procedures used in this study were approved through the North Carolina State
University Institutional Review Board. Panelists were recruited via email advertisements and
announcements made to the North Carolina State University Food, Nutrition, and
Bioprocessing department and undergraduate classes. Panelist criteria were based on the
following: men and women between 18 and 35 years old, healthy weight (body mass index
between 18 and 25 and/or waist to hip circumference ratio of ≤0.95 for men and ≤0.8 for
women), not dieting, no loss or gain of significant weight (defined as 10% of body weight) in
the last year, hadn’t recently started or ceased a regular exercise program, no dietary allergies
or intolerances to dairy or cocoa ingredients, and no history of Type I or Type II diabetes. A
total of 9 panelists were selected based upon the above requirements and an initial screening
which involved body mass index and hip to waist ratio measurements as well as surveys of
medical history, eating behavior, and physical activity. Baseline panelist information is listed
in Table 3.1. All panelists were informed of the procedures, outcomes, potential risks, and
benefits of study participation and gave written informed consent prior to beginning the trial.
Monetary compensation was also provided for trial participation.
101
Table 3.1. Panelist measurements at beginning of trial.
Panelist attribute
Age (years)
22.6 ± 1.7
Weight (kg)
65.5 ± 8.1
Height (m)
1.71 ± 0.05
-2
BMI (kg/m )
22.3 ± 2.1
Waist (cm)
79.9 ± 5.7
Hip (cm)
98.8 ± 5.0
Waist/hip ratio
0.81 ± 0.03
n = 9, 4 females and 5 males
Abbreviations: BMI: body mass index
3.3.2 ANTHROPOMETRY
Panelist weight was measured to the nearest kilogram using a Taylor lithium
electronic digital scale accurate to 0.1 kg (Oak Brook, IL, USA) and height was measured to
the nearest centimeter using a wall-mounted ruler. Hip and waist measurements were
measured to the nearest centimeter via a tape measure (Stanley, New Britain, CT, USA) with
panelists in standing position. Hip measurement was defined by the widest circumference
between the waist and thighs, while waist measurement was the narrowest circumference
near the belly button.
3.3.3 EXPERIMENTAL DESIGN
This was a randomized study including 6, 4-hour sessions per participant. For each
session, panelists fasted overnight (no food, caloric beverages, or smoking for 12 hours) and
arrived at the laboratory at 7 am. Panelists were also required to refrain from vigorous
physical activity for 24 hours prior to a scheduled session. In addition, panelists were asked
to refrain from consuming high polyphenolic foods the night before a session, including
102
cooca/chocolate products, tea, wine, berries, and peanuts. Upon arrival, panelists filled out a
baseline hunger questionnaire (Figure A.3), sterilized their fingertip with an alcohol wipe,
and used a Fisherbrand sterile high flow safety lancet (Waltham, MA, USA) to prick their
finger and draw blood. Each panelist used a Nova Max Plus glucose/ketone monitor and
Nova Max blood glucose test strips (Waltham, MA, USA) to determine their baseline blood
glucose level and then provided 200 µl of blood into a BD microtainer serum separator blood
collection tube (Waltham, MA, USA). The panelist instructions used in each session is
shown in Figure A.2.
After initial blood glucose readings and blood collection, panelists consumed a 340
gram (12 oz) beverage. Following beverage consumption, the beverage container was
washed and shaken with 200 ml of water, which was then consumed by the panelist to ensure
ingestion of the entire dosage. The test beverage consumed by panelists at each session was
randomized and each beverage was consumed within 10 minutes. Panelists ranked their
hedonic liking of the beverage immediately following consumption (Figure A.3). Panelists
provided blood samples, tested blood glucose levels, and ranked their appetite at 30, 60, 120,
and 240 minutes following beverage consumption.
3.3.4 QUESTIONNAIRE
During each session, panelists recorded their blood glucose readings and feelings of
satiety at each time point. The questionnaire asked the panelists to rate their feelings of
satiety on a 100 mm horizontal visual analogue scale (VAS), anchored at both ends with
qualifying statements. The statement “not at all hungry” was labeled at 0 mm while 100 mm
103
was labeled with the statement “extremely hungry.” This measurement method was validated
by (Flint et al. 2000) for single test meal studies. Panelist ratings were measured by ruler and
quantified in millimeter values. Panelists also scored their liking of the overall beverage,
beverage flavor, and beverage texture/mouthfeel post-consumption on a 9-point hedonic
scale. The complete form used to record panelist responses and blood glucose levels is shown
in Figure A.2 and A.3.
3.3.5 MATERIALS
Regular (high polyphenolic) and Dutched (low polyphenolic) cocoa powder was
provided by The Hershey Company (Hershey, PA, USA). BiPRO whey protein isolate was
provided by Davisco, Inc (Le Sueur, MN, USA). Clintose maltodextrin CR10 (DE 10),
Fibersol-2 resistant maltodextrin, and crystalline fructose were provided by ADM (Decatur,
IL, USA). A carrageenan-based hydrocolloid stabilizer was provided by TIC Gums (White
Marsh, MD, USA).
3.3.6 BEVERAGE FORMULATION AND PREPARATION
The beverages tested are outlined in Table 3.2. Beverage formulations included:
1.
2.
3.
4.
5.
6.
Placebo
Whey protein isolate (WPI)
Low polyphenolic cocoa (LP)
High polyphenolic cocoa (HP)
LP + WPI
HP + WPI
The WPI-containing beverages were designed to deliver 10 g total protein (20% of DRI, an
excellent source of protein). The HP beverages delivered 1,580 mg of total flavanols as
104
determined by the DMAC (4-dimethylaminocinnamaldehyde) assay or 870 mg of total cocoa
proanthocyanidins, as measured by the proanthocyanidin 1-10 (PAC 1-10) assay, both
performed by The Hershey Company. The PAC 1-10 assay measured all present
proanthocyanidins composed of 1 to 10 monomer units. The LP served as a control for the
effect of polyphenolic compounds by providing the fiber and other nutrients regularly found
in cocoa but very low levels of flavanols and proanthocyanidins (6.7 mg by DMAC and 1.8
mg by PAC 1-10). The comparison of DMAC and PAC 1-10 analyses of HP and LP are
found in Table A.4. It must be stated that the LP cocoa still contained flavanols but at a much
lower concentration. Maltodextrin was used as a direct replacement for WPI in the placebo,
LP, and HP samples. Fibersol-2, a digestion-resistant maltodextrin, was used to replace cocoa
in the placebo and WPI-only sample. All beverages were isocaloric and provided 150
calories.
Table 3.2. Formulation of the six test beverages.
LP
HP
Ingredients (g) Placebo WPI
Water
283.8
283.8 283.8 283.8
HP cocoa
36
LP cocoa
36
WPI
10.8
Fibersol-2
36
36
Maltodextrin
10.8
10.8
10.8
Fructose
8.6
8.6
8.6
8.6
Stabilizer
0.75
0.75
0.75
0.75
LP-WPI
283.8
36
10.8
8.6
0.75
HP-WPI
283.8
36
10.8
8.6
0.75
Fibersol-2 and maltodextrin served as direct replacements for cocoa and WPI, respectively.
Abbreviations: WPI: whey protein isolate; LP: low polyphenolic cocoa; HP: high polyphenolic cocoa
105
Bulk dry mixes of each beverage treatment were prepared by combining the dry
ingredients and mixing in a KitchenAid stand mixer (St. Joseph, MI, USA) for three minutes
on speed two followed by hand mixing for two minutes. This mix was then divided into
single beverage portions and stored until use. Twelve hours prior to panelist consumption,
each portion was hydrated with deionized water to 340 grams in a BlenderBottle SportMixer
shaker bottle (Lehi, UT, USA) by shaking vigorously for three minutes. All beverages were
refrigerated overnight at 4°C and shaken again immediately before panelist consumption.
3.3.7 SERUM PEPTIDE ANALYSIS/BLOOD PARAMTERS
Blood samples were collected in BD Microtainer serum separator blood collection
tubes (Waltham, MA, USA) at five time points (0, 30, 60, 120, and 240 minutes) for leptin
and adiponectin analysis. Serum was prepared by allowing the blood samples to clot at room
temperature for 30 minutes followed by centrifugation for 2.5 minutes at 6,000 g. The serum
layer was transferred to 600 µL tubes and stored at -80C. Analysis for serum leptin and
adiponectin levels were performed using human leptin ELISA kits and human
ADIPOQ/Adiponectin ELISA kits, respectively, all purchased from Sigma-Aldrich (St.
Louis, MO, USA). All analyses were performed per the manufacturer’s instructions. Leptin
and adiponectin levels were expressed as percent changes from baseline (fasted, time point
1).
3.3.8 STATISTICAL ANALYSIS
Randomization of sample order for each panelist was established using a randomized
block design using JMP software (Cary, NC, USA). Due to the inherent variability between
106
panelists, hunger ratings, blood glucose, leptin, and adiponectin data were calculated using
the percent change from baseline (fasted, time 0) for each panelist. The experimental design
was a randomized complete block split plot in time, where panelists served as complete
blocks and beverages as the whole plot blocks, measured repeatedly in time. For each of four
responses (hunger rating, blood glucose level, leptin, and adiponectin), the linear mixed
effects model, appropriate to the design, was fit with all factorial effects: beverage, time, and
all possible interactions and random effects for panelist and panelist-by-beverage. The levels
of “beverage” are combinations of two crossed factors, cocoa and whey, and were coded as
such in all analyses of variance. Statistical analysis utilized SAS software (Cary, NC, USA).
The data are presented as mean ± S.E.
3.4 RESULTS AND DISCUSSION
3.4.1. EFFECTS OF COCOA POLYPHENOLS AND WHEY PROTEIN ON SUBJECTIVE
RATINGS OF HUNGER
Panelist hunger ratings were quantified by marking a 100 mm visual analogue scale
(VAS) at each time point. The distance of this mark from 0 (“not at all hungry”) was
recorded in millimeters. Figure 3.1 shows the changes in average panelist hunger ratings
following beverage consumption. All beverages similarly decreased feelings of hunger 30
minutes following beverage consumption and hunger was significantly decreased at the 30
and 60-minute time point. The two-hour time point was not significantly different from
baseline (time 0) hunger ratings but the four-hour rating was significantly higher than all
107
previous time points. No significant differences were found in overall hunger ratings (hours
0-4) between beverage treatments, nor between any individual cocoa or whey variables.
One to four hours post-consumption, the WPI and HP-WPI beverages were most
effective in controlling hunger ratings. The LP beverage was the least effective at controlling
hunger. After 30 minutes, hunger levels increased quickly for the LP cocoa beverage and
slightly more slowly for the placebo, WPI, HP, and LP-WPI samples. Cocoa-only beverages
(HP or LP) elicited the highest final hunger ratings. The remaining beverages showed similar
final hunger ratings four hours post-consumption. The HP-WPI beverage most effectively
controlled hunger between hours one and four. This beverage showed the slowest increases
in hunger over time but reached a similar final hunger rating as the WPI and LP-WPI
beverages.
Because panelist satiety ratings may have been impacted by beverage hedonic factors,
panelists also rated their overall, flavor, and texture liking of each beverage. The results of
the hedonic questionnaire are provided in Table A.4. Overall liking was shown to be more
highly correlated with flavor than texture. From panelist comments, the bitterness and
astringency of the high dose cocoa polyphenolics appeared to reduce panelist liking while the
addition of WPI to HP and LP beverages appeared to increase beverage liking. This may be
due to a change or masking of cocoa flavor and gritty texture.
108
Figure 3.1. Changes in hunger ratings before and after beverage consumption. Values
expressed as changes from baseline in mean ± S.E. from a 100 mm visual analogue scale.
Letters refer to significant differences; time points with same letter are not statistically
different.
n=9
Abbreviations: LP: low polyphenolic cocoa, HP: high polyphenolic cocoa, WPI: whey protein isolate, LP-WPI:
low polyphenolic cocoa + whey protein isolate, HP-WPI: high polyphenolic cocoa + whey protein isolate.
The WPI-containing beverages contained 10 g of WPI, representing 29% of the total
calories. This dose was selected to provide an “excellent” source of protein as defined by the
USDA Dietary Reference Intake for protein and is comparable to chocolate protein beverages
on the market (Food and Nutrition Board, 2013). In addition, it has been shown that diets
consisting of greater than 30% calories from protein induce satiety and decrease food intake
better than lower protein diets (Veldhorst et al. 2008). In test beverages without WPI, WPI
was replaced isocalorically with maltodextrin.
109
Two test beverages containing whey protein slowed hunger response two hours
(WPI) and three hours (HP-WPI) post-consumption. These ingredient-based changes in
satiety ratings are supported by the literature. Weigle et al. (2005) and Lejeune et al. (2006)
found that when compared to a 10 or 15% protein diet, a 30% protein diet increased satiety
ratings, decreased ad libitum food intake, and increased average weight loss in separate
clinical trials. Veldhorst et al. (2009) also found that breakfasts containing 25% calories from
protein (casein, whey, or soy) induced greater satiety than their 10% protein counterparts.
Mellinkoff et al. (1997) postulated that increases in plasma amino acid levels are
associated with higher satiety and reduction in appetite. If true, this provides a distinction
between macronutrients in regards to weight loss: fewer protein calories could initiate the
same level of satiety as greater calorie intakes of carbohydrates or lipids. In mice, increases
in plasma amino acids that were not destined for protein synthesis increased satiety, while an
increase in appetite was accompanied by decreases in plasma amino acids. Morrison et al.
(2007) found that intracerebroventricular injections of amino acids or leucine alone reduced
caloric intake in mice over 24 hours. In the present study, it appears that the presence of
amino acids in the form of whey protein decreased hunger as compared to the carbohydrate
control. This satiety may be attributed to an increase in plasma levels of the satiation
hormones GLP-1, CCK or PYY, which will be monitored in future studies (WesterterpPlantenga et al. 1999, Lejeune et al. 2006, Diepvens, Häberer, and Westerterp-Plantenga
2007).
The combination of HP cocoa and WPI in this study had the greatest effect upon
suppressing hunger ratings. While the HP-only beverage did not exhibit the same hunger
110
suppressing effects as HP-WPI, the HP-WPI beverage suppressed hunger ratings over the
LP-WPI beverage. This indicates that the cocoa polyphenols may have played a role in
appetite suppression. While WPI increases plasma amino acid levels to suppress hunger,
cocoa polyphenols may bind digestive enzymes and slow digestion and nutrient metabolism.
In vitro, tannins and procyanidins in cocoa, pomegranate, cranberry, and grape extracts have
been shown to inhibit α-amylase, glucoamylase, pancreatic lipase, and secreted
phospholipase A2 activity (Gu et al. 2011, Barrett et al., 2013). In vivo, green tea catechins
were also shown to increase satiety and fullness and to limit lipid nutrient absorption by
inhibiting pancreatic phospholipase A2 (Wang, Noh, and Koo 2006, Josic et al. 2010).
Chocolate-specific human clinical studies have shown that consumption of
polyphenol-rich dark chocolate decreased hunger ratings and ad libitum intake by 17% and
increased satiety more than milk chocolate (Sørensen and Astrup 2011). Eating or simply
smelling chocolate also increased satiety ratings, though smelling had no effect upon known
physiological biomarkers of hunger and satiety (Massolt et al. 2010). The comparison of
chocolate and yogurt snacks before a meal found increased fullness ratings after eating
yogurt, which is higher in protein (Chapelot and Payen 2009). However, the duration of
satiety was similar between both foods and there was no difference in ad libitum intake at the
next meal. The hunger ratings reported in the present study indicate that whey protein was
the major factor in determining satiety four hours post-consumption. Cocoa polyphenolics
were a secondary, and minimized, determining factor. Due to wide variances in individual
panelist hunger ratings, further studies with much larger sample sizes are necessary to
111
determine the psychological and physical effects of WPI and cocoa upon feelings hunger and
satiety.
3.4.2. EFFECTS OF COCOA POLYPHENOLS AND WHEY PROTEIN ON BLOOD
GLUCOSE LEVELS
Blood glucose levels before and following beverage consumption were determined
via commercial glucose meters and recorded in mg/dL. Figure 3.2 shows the percent changes
in average blood glucose levels four hours following beverage consumption. All changes
were measured as percent changes from baseline at time 0 (fasted). The most significant
difference among beverage formulations occurred 30 minutes following beverage
consumption. At this time point, the WPI, HP-WPI, and LP-WPI beverages increased blood
glucose 8, 12, and 16% above baseline levels, respectively, compared to increases of 27, 39,
and 58% in HP, LP, and placebo beverages, respectively. Although all beverages were
formulated isocalorically, those with less protein contained more carbohydrates. Predictably,
those beverages containing the most high glycemic glucose-based carbohydrates (Placebo,
LP, HP) produced the largest spikes in blood glucose. The glucose spikes observed in the
placebo, LP, and HP beverages were 7.3, 4.9, and 3.4 times greater than that of the WPI-only
beverage. The presence of WPI in the remaining three beverages had a significant
moderating effect upon glucose levels over the hours following consumption. A similar
statistically significant trend was observed in those beverages containing LP and HP cocoa:
the HP cocoa moderated glucose levels better than LP cocoa, whether present alone or
combined with WPI. Though all beverages elicited similar glucose levels four hours post-
112
consumption, the placebo and LP cocoa beverages exhibited more erratic fluctuations than
the HP and WPI beverages.
Figure 3.2. Percent changes in blood glucose levels before and after beverage consumption.
Values expressed as percent changes from baseline in mean ± S.E. Letters refer to significant
differences between time points or beverages at the 30-minute time point; variables with the
same letter are not statistically different.
n=9
Abbreviations: LP: low polyphenolic cocoa, HP: high polyphenolic cocoa, WPI: whey protein isolate, LP-WPI:
low polyphenolic cocoa + whey protein isolate, HP-WPI: high polyphenolic cocoa + whey protein isolate.
In this study, blood glucose responses to each beverage formulation were indicative
of the total glucose or carbohydrate content. Those beverages formulated with maltodextrin
to replace WPI (thus increasing glucose content and increasing glycemic index) elicited
larger spikes in blood glucose. Fibersol, a resistant starch, was used to replace cocoa in the
placebo and WPI beverages. Though not an identical replacement, Fibersol mimicked the
113
high fiber content of cocoa powder. However, the placebo and LP cocoa beverages elicited
large spikes in glucose levels, up to 58% of baseline. Blood glucose levels dropped almost
completely to baseline levels one hour post-consumption. While all beverages decreased to
similar glucose levels one hour post-consumption, the magnitude of these short-term glucose
spikes is indicative of energy level and glucose metabolism. The non-significant increases in
blood glucose levels observed between hours two and four after the placebo may be
explained by the induction of gluconeogenesis and subsequent glucose transport to the brain.
While proteins alone do not contribute to blood glucose levels, Nilsson, Holst, and
Björck (2007) showed that specific protein amino acid compositions may stimulate insulin
production. Drinks containing the branched chain amino acids leucine, isoleucine, and valine
decreased plasma glucose by 44% and increased insulin production by 31%. A similar drink
containing whey protein decreased glucose levels by 56% and increased insulin levels by
60% (Nilsson, Holst, and Björck 2007). Similar effects of WPI on blood glucose levels were
observed in the current study, in which the WPI, HP-WPI, and LP-WPI lowered blood
glucose levels by 85, 78, and 71%, respectively, as compared to the placebo at the 30-minute
time point. The WPI beverage only elicited an 8% increase in blood glucose levels at 30
minutes compared to a 58% increase by the placebo. This is partially explained by the lower
carbohydrate content of these beverages, which provide less glucose-based polymers for
digestion and circulation. However, it is possible that an increase in plasma amino acids or
bioactive peptides found in whey proteins increased the production of insulin, and thus the
cellular absorption of plasma glucose.
114
With or without WPI, beverages containing HP cocoa better moderated changes in
blood glucose levels. The LP cocoa beverage produced a 39% increase in blood glucose as
compared to a 27% increase following the HP cocoa beverage. A similar, but blunted, trend
was observed when cocoa was combined with WPI: the LP-WPI and HP-WPI beverages
elicited blood glucose increases of 16% and 12%, respectively. Because the HP and LP
beverage formulations only varied in their polyphenolic content, the differences between the
initial spikes in blood glucose may be attributed to the polyphenolic content of the HP cocoa.
Plant polyphenolics have also demonstrated effects on blood glucose levels and
insulin sensitivity. In vitro, 1-10 µM epicatechin and 1-10 µg/ml cocoa polyphenolic
treatment increased insulin receptor activity, insulin signaling, and glucose transport while
decreasing glucose production in HepG2 cells (Cordero-Herrera et al. 2013). In vivo, 0.5%
epicatechin consumption in drinking water (equivalent to 250 g of dark chocolate
consumption per day) increased insulin levels in mice (Fu, Yuskavage, and Liu 2013). In
mouse and human clinical studies, flavanol-rich cocoa or chocolate consumption increased
insulin sensitivity, and lowered short-term blood glucose and free fatty acid levels (Matsui et
al. 2005, Grassi et al. 2008, Jalil et al. 2009). In obese-diabetic rats, treatment with 1-3%
cocoa extract was found to significantly reduce plasma glucose by 60-75% (Ruzaidi et al.
2005). Brand-Miller et al. (2003) even showed that chocolate flavors may have psychological
effects upon physiological biomarkers: in the absence of substantial cocoa polyphenols, a
variety of chocolate flavored desserts increased plasma insulin levels more than the same
vanilla or strawberry-flavored foods.
115
The mechanisms by which polyphenols moderate changes in plasma glucose levels
have been demonstrated in vitro. Johnston et al. (2005) and Kobayashi et al. (2000) found
that dietary polyphenolics, including catechin, epicatechin, and their derivatives inhibit
cellular glucose uptake via steric hindrance of the sodium-dependent glucose transporter
(SGLT1) and the facilitated diffusion glucose transporter (GLUT1) in lipid membranes. This
would slow cellular glucose uptake and inhibit rapid declines in glood glucose. Alternatively,
spikes in blood glucose levels may be moderated by polyphenolic upregulation of GLUT1
and GLUT4 protein synthesis and activation of phosphatidylinositol 3-kinase, a signaling
enzyme involved in muscle cell growth (Purintrapiban, Suttajit, and Forsberg 2006). These
effects are mediated by polyphenolic upregulation of PPAR-γ, which in turn upregulates
genetic expression of insulin and glucose transporters (Ali, Ismail, and Kersten 2014). Jalil et
al. (2009) reported that caffeine consumption can also reduce insulin-stimulated glucose
uptake, moderating and slowing decreases in blood glucose levels. Dutching, or alkali
treatment, of cocoa powder lowers caffeine content by approximately one third (Li et al.
2012). These reported effects of cocoa polyphenolics and caffeine may explain the
differences observed in the HP v. LP cocoa beverages in moderating blood glucose levels.
3.4.3. EFFECTS OF COCOA POLYPHENOLS AND WHEY PROTEIN ON SERUM LEPTIN
LEVELS
Figure 3.3 shows the percent changes in mean serum leptin levels following
consumption of each beverage. Average panelist leptin levels fell below baseline levels 30minutes post consumption and remained below baseline at all subsequent time points. Leptin
levels reached lowest levels at one or two hours post-consumption. At 30-minutes post-
116
consumption, leptin levels decreased most in the LP cocoa beverage, followed by the WPI
beverage. LP cocoa leptin levels remained the lowest of all treatments until experiencing a
steep increase at the four-hour time point. LP-WPI and HP beverages followed similar
trends, with leptin levels increasing between the two and four-hour time points. The leptin
levels of the remaining beverages, placebo, HP-WPI, and WPI, remained constant between
the two and four-hour time points. The LP-WPI and LP cocoa beverages had the highest final
leptin levels, with decreases from baseline of 17%.
Figure 3.3. Percent changes in serum leptin levels before and after beverage consumption.
Values expressed as percent changes from baseline in mean ± S.E. Letters refer to significant
differences between time points or beverages; variables with the same letter are not
statistically different.
n=9
Abbreviations: LP: low polyphenolic cocoa, HP: high polyphenolic cocoa, WPI: whey protein isolate, LP-WPI:
low polyphenolic cocoa + whey protein isolate, HP-WPI: high polyphenolic cocoa + whey protein isolate.
117
Serum leptin levels unexpectedly decreased, and remained below baseline, following
consumption of all beverage treatments. Levels decreased most quickly during the first hour
and then slightly increased (LP, LP-WPI, and HP) or remained constant (placebo, WPI, and
HP-WPI) between hours two and four. LP cocoa ingredients were associated with higher
final leptin levels while WPI-containing beverages were not correlated with a specific pattern
in serum leptin.
Based upon previous research, WPI beverages high in leucine were expected to have
the greatest impact upon leptin levels. Leucine has been found to regulate leptin secretion in
vitro through the mTOR-signaling pathway (Lynch et al. 2006). Oral gavage of rats with
leucine or norleucine doubled plasma leptin concentrations, but not to the same extent as a
regular meal feeding. A meal lacking leucine reduced leptin synthesis by 40% in comparison
to a control meal; no reductions in leptin were observed in subsequent meals lacking
branched-chain amino acids or all amino acids (Lynch et al. 2006).
It is possible that no increases in leptin were observed because the beverages did not
provide enough calories to induce an increase in leptin above baseline. Liu, Askari, and
Dagogo-Jack (1999) found that fasting plasma leptin concentrations are reproducible in both
lean and obese adults over 26 days, indicating that the below baseline leptin levels observed
in this study should be reliable representations across panelists and weekly sessions. The
question remains whether the low calorie beverage provided enough energy to stimulate a
measureable physiological response. The beverages formulated for this study were intended
to mimic the calorie and macronutrient content of a supplementary snack rather than a meal
replacement product. These 150-calorie beverages were meant to represent commercial
118
chocolate-protein beverages that would provide longer and more satisfying hunger control
than other higher calorie snack options. The beverages may have been so low in calories that,
after a 12-hour fast, the body continued to decrease leptin production until finally sensing the
small calorie intake. This is demonstrated by the slight increases in leptin levels between
hours two and four in three of the treatments.
Consumption of these beverages appeared to blunt declining leptin concentrations and
partially returned the declining levels back to baseline. These observations are supported by
Wadikar and Premavalli (2011), who showed that appetizers of 59-94 calories actually
decreased plasma leptin levels by 6-16% 30-minutes post consumption, effectively
increasing appetite. The control appetizer treatment elicited the smallest decreases in leptin
levels. It is possible that if the test beverages in the present study had provided a more
substantial calorie content, such as a 300-400 calorie meal equivalent, panelist physiological
responses would have been observed faster or may have followed clearer trends. Previous
research has also found that in vitro and in vivo, plasma leptin levels peak three to four hours
following meal consumption (Roh et al. 2003, Diepvens, Häberer, and Westerterp-Plantenga
2007). It is possible that in the present study, panelist serum levels were not monitored for
enough hours following beverage consumption.
Multiple studies have demonstrated that circulating leptin levels are highly correlated
with insulin induction, and thus with glucose uptake. Insulin and glucose infusion studies in
humans provide evidence that serum leptin and insulin levels are inversely correlated over
24-hour cycles (Utriainen et al. 1996, Boden et al. 1997, Saad et al. 1998). Serum leptin
levels were not associated with serum glucose or free fatty acid levels and increases of at
119
least 200 pM serum insulin are necessary to significantly increase serum leptin (Boden et al.
1997). Koopmans et al. (1998) showed that increases in serum leptin levels in rats are dose
and time dependent: noticeable changes in serum leptin levels were not observed until over
four hours of insulin infusion. During a six-hour prolonged fast in lean children, Levitt Katz
et al. (2006) also found that steady declines in leptin levels during fasting are associated with
decreased insulin secretion.
The beverages used in this study were formulated with fructose, rather than glucose.
This was done consciously to avoid misleading glucose-mediated changes in blood
biomarkers that were unrelated to experimental beverage ingredients. The previously
referenced studies indicate that substantial and prolonged increases in insulin production
upregulate leptin levels in vivo. A study by Teff et al. (2004) monitored serum glucose,
insulin, and leptin levels during a 24-hour, controlled diet study. When fructose constituted
the carbohydrate portion of meals, leptin levels declined by 33 and 21% after 12 and 24
hours, respectively. Glucose consumption also suppressed the hunger hormone ghrelin by
30% as compared to fructose (Teff et al. 2004). Test beverage formulation with fructose may
explain the lack of significant increases in serum leptin levels observed in the present study.
Additionally, leptin is only one indicator of satiety so it remains unclear whether the null
results observed in this study can be extrapolated to other physiological biomarkers of
satiation and satiety.
3.4.4. EFFECTS OF COCOA POLYPHENOLS AND WHEY PROTEINS ON SERUM
ADIPONECTIN LEVELS
Figure 3.4 shows the percent changes in mean serum adiponectin levels following
120
consumption of each beverage. Much smaller percent changes were observed in adiponectin
levels as compared to those of leptin. All WPI and cocoa beverages increased serum
adiponectin levels above that of the placebo while the placebo lowered levels below baseline
for the four hours following consumption. The WPI beverage elicited the highest increases in
adiponectin levels, significantly higher than the placebo at 30 minutes and one and two hours
post-consumption. The HP beverage significantly increased adiponectin levels above the
placebo at the one hour time point. However, there were no significant differences between
cocoa and WPI variables. HP-WPI and LP-WPI beverages had the smallest serum
adiponectin increases from baseline while the LP and HP beverages increased adiponectin to
a greater degree. The WPI and LP beverages followed very similar trends with adiponectin
levels peaking at the 30-minute time point. The HP, HP-WPI, and LP-WPI beverages
reached peak adiponectin levels at the one-hour time point.
121
Figure 3.4. Percent changes in serum adiponectin levels before and after beverage
consumption. Values expressed as percent changes from baseline in mean ± S.E. Letters refer
to significant differences between time points or beverages; variables with the same letter are
not statistically different.
n=9
Abbreviations: LP: low polyphenolic cocoa, HP: high polyphenolic cocoa, WPI: whey protein isolate, LP-WPI:
low polyphenolic cocoa + whey protein isolate, HP-WPI: high polyphenolic cocoa + whey protein isolate.
Adiponectin is a hormone-like peptide secreted by fat cells in vivo. This
adipocytokine increases fatty acid oxidation and glucose uptake in muscle and liver cells
(Huang et al. 2008). Unlike leptin, adiponectin levels are lower in obese subjects and higher
in healthy people with less body fat (Yamashita et al. 2012). Physiological doses of
adiponectin have been shown to decrease insulin resistance (Yamauchi et al. 2001, Tschritter
et al. 2003). Most studies of diet-induced changes upon adiponectin have investigated the
122
effects of dietary protein and lipid content. Torres-Leal et al. (2011) found that leucine
supplementation increased serum adiponectin levels and reduced total cholesterol in obese
rats. Huang et al. (2008) reported that whey protein intake increased adiponectin production
in mice on a high-fat diet. This stimulation of adiponectin was associated with decreased
appetite and moderation of weight gain. Dietary supplementation with α-lactalbumin has also
been shown to increase adiponectin levels as well as to decrease blood glucose in diabetic
mice after glucose loading (Yamaguchi and Takai 2014). Conversely, no significant
differences in adiponectin levels were found between low fat/high carbohydrate or low
fat/high protein diets in a human clinical trial (Claessens et al. 2009). The results of the
current study support the observation that whey protein significantly increased adiponectin
levels in vivo.
Polyphenolic upregulation of adiponectin expression is less studied but has also been
reported. Ølholm et al. (2010) showed that after induction of inflammation in vitro,
resveratrol treatment increased adiponectin mRNA expression. These changes in adiponectin
expression are attributed to PPAR-γ regulation by polyphenolic ligands. Maeda et al. (2001)
found that treatment of diabetic humans and rodents with thiazolidinediones, synthetic
polyphenolic PPAR-γ ligands, increased plasma adiponectin levels without changing body
weight. Yamashita et al. (2012) reported that a high-fat diet supplemented with cocoa
procyanidins significantly increased plasma adiponectin levels in mice. Cocoa procyanidins
were shown to activate AMP-activated protein kinase-α (AMPK- α) and to increase GLUT4
levels in the plasma membrane of liver and adipose tissue. Adiponectin increases AMPK-α
expression, which in turn downregulates fatty acid synthesis and upregulates fatty acid
123
oxidation. These studies indicate that through PPAR-γ and AMPK-α activation, polyphenols
may reverse the effects of metabolic syndrome by increasing both blood glucose uptake and
lipolysis. The present study showed that both high and low polyphenolic cocoa significantly
increases adiponectin levels above that of a placebo. In the cocoa-only beverages, HP cocoa
induced a greater increase than LP cocoa. However, when combined with WPI, adiponectin
levels decreased slightly. Because the percent changes in adiponectin levels were so small,
additional studies are necessary to better elucidate the effects of combining cocoa
polyphenolics and whey protein.
This study investigated the differences between cocoa and whey protein ingredients
upon three physiological markers of satiety (blood glucose, leptin, and adiponectin levels)
and one subjective marker of satiety (hunger ratings). It must be stated that it is often difficult
to isolate physiological and psychological effects on satiety: both factors influence each other
and, consciously and subconsciously, determine eating habits. While the beverage
formulations used in this study were controlled for calorie content, the placebo and WPI
beverages had a slightly different textures and distinctly different appearances when
compared to the cocoa-containing beverages. These differences may have subconsciously
impacted panelist hunger ratings throughout the study.
In addition, though the panelists were aware that each beverage was isocaloric, the
color differences between the cocoa and non-cocoa beverages (brown v. clear) may also have
influenced the panelists to feel, and give responses, that matched the type of beverage they
believed they had consumed (i.e. lower ratings of satiety for clear beverages that were
perceived as the control). A study by Crum et al. (2011) investigated the physiological effects
124
of food labeling and panelist preconceptions of two identical milkshakes. On separate days,
panelists consumed two identical milkshakes, one labeled a 620 calorie “indulgent” shake
and the other labeled a 140 calorie “sensible” shake. Crum et al. (2011) found significant
decreases in panelist ghrelin levels following the indulgent milkshake while consumption of
the sensible milkshake elicited no changes in ghrelin levels. This study indicates that more
research is necessary to better understand the interactions between psychological and
physiological parameters that may influence total calorie intake, food selection, and eating
habits.
3.5 CONCLUSIONS
This study investigated the acute effects of cocoa polyphenolics and whey protein
upon markers of satiety and glucose and lipid metabolism in humans. These measures
encompassed both psychological and physiological indicators, including subjective ratings of
satiety, blood glucose levels, as well as serum leptin and adiponectin levels. Beverages
containing whey protein increased satiety in the hours following beverage consumption. The
presence of cocoa polyphenolics in the HP and HP-WPI beverages also increased satiety over
that of the LP cocoa beverages. Based on the literature, these effects may be due to increases
in plasma amino acids and polyphenolic partial inhibition of digestive enzymes.
WPI and HP beverages were also found to significantly moderate spikes in blood
glucose following beverage consumption. 30 minutes post-consumption, the WPI, HP-WPI,
and LP-WPI beverages increased blood glucose 8, 12, and 16% above baseline levels,
respectively, compared to increases of 27, 39, and 58% in HP, LP, and placebo beverages,
125
respectively. In addition to higher initial levels, the placebo and LP beverage also exhibited
more erratic fluctuations in blood glucose over time. These results may indicate that an
increase in plasma amino acids or bioactive compounds found in whey proteins and cocoa
can increase the production of insulin and cellular glucose transporters, and thus the cellular
absorption of plasma glucose.
Average panelist leptin levels fell below baseline levels 30-minutes post consumption
and remained below baseline at all subsequent time points. Levels decreased most quickly
during the first hour and then slightly increased (LP, LP-WPI, and HP) or remained constant
(placebo, WPI, and HP-WPI) between hours two and four. LP cocoa ingredients were
associated with higher final leptin levels while WPI-containing beverages were not correlated
with a specific pattern in serum leptin. A lack of increases in leptin may be due to the low
calorie content (150 kcal) of the test beverages or to a lack of insulin induction. In addition,
leptin levels may not have been monitored for enough hours following beverage
consumption. Leptin is only one indicator of satiety, and is often difficult to correlate with
individual meals, so it remains unclear whether the null results observed in this study can be
extrapolated to other physiological biomarkers of satiation and satiety.
All test beverages increased adiponectin levels above that of the placebo. The WPI
beverage significantly increased adiponectin levels compared to the placebo at 30 minutes
and one and two hours post-consumption while the HP beverage reached significantly higher
adiponectin levels one hour post-consumption. Adiponectin levels were not significantly
different among WPI or cocoa variables. In the absence of WPI, HP cocoa elicited higher
adiponectin levels than LP; the combination of WPI and cocoa decreased adiponectin levels
126
in comparison to cocoa alone. The results of this clinical trial indicate that WPI suppresses
hunger, significantly moderates blood glucose, and significantly increases adiponectin levels
above that of the placebo. Cocoa polyphenolic consumption moderated blood glucose levels
and increased adiponectin levels better than a low polyphenolic control and the placebo.
Expanded human clinical trials are necessary to better elucidate the acute and chronic effects
of cocoa polyphenolics and whey protein upon biomarkers of satiety, weight gain, and
metabolic syndrome. However, this study indicates that cocoa and whey protein
consumption, alone and in combination, may be potential tools in the formulation of low
calorie, satiety-inducing foods.
127
3.6 REFERENCES
Aldrich, Noel D., Marla M. Reicks, Shalamar D. Sibley, J. Bruce Redmon, William Thomas,
and Susan K. Raatz. 2011. “Varying Protein Source and Quantity Do Not
Significantly Improve Weight Loss, Fat Loss, or Satiety in Reduced Energy Diets
among Midlife Adults.” Nutrition Research 31 (2): 104–12.
Ali, Faisal, Amin Ismail, and Sander Kersten. 2014. “Molecular Mechanisms Underlying the
Potential Antiobesity-Related Diseases Effect of Cocoa Polyphenols.” Molecular
Nutrition & Food Research 58 (1): 33–48.
Anderson, G. Harvey, Sandy N. Tecimer, Deepa Shah, and Tasleem A. Zafar. 2004. “Protein
Source, Quantity, and Time of Consumption Determine the Effect of Proteins on
Short-Term Food Intake in Young Men.” The Journal of Nutrition 134 (11): 3011–15.
Asp, Elaine H. 1999. “Factors Affecting Food Decisions Made by Individual Consumers.”
Food Policy 24 (2): 287–94.
Benelam, B. 2009. “Satiation, Satiety and Their Effects on Eating Behaviour.” Nutrition
Bulletin 34 (2): 126–73.
Boden, Guenther, Xinhua Chen, Jerzy W. Kolaczynski, and Marcia Polansky. 1997. “Effects
of Prolonged Hyperinsulinemia on Serum Leptin in Normal Human Subjects.”
Journal of Clinical Investigation 100 (5): 1107.
Boirie, Yves, Martial Dangin, Pierre Gachon, Marie-Paule Vasson, Jean-Louis Maubois, and
Bernard Beaufrère. 1997. “Slow and Fast Dietary Proteins Differently Modulate
Postprandial Protein Accretion.” Proceedings of the National Academy of Sciences 94
(26): 14930–35.
Brand-Miller, Jennie, Susanna H.A. Holt, Vanessa de Jong, and Peter Petocz. 2003. “Cocoa
Powder Increases Postprandial Insulinemia in Lean Young Adults.” The Journal of
Nutrition 133 (10): 3149–52.
Cammisotto, P.G., Yves Gelinas, Yves Deshaies, and Ludwik J Bukowiecki. 2005.
“Regulation of Leptin Secretion from White Adipocytes by Insulin, Glycolytic
Substrates, and Amino Acids.” AJP: Endocrinology and Metabolism 289 (1): E166–
E171.
Chapelot, Didier, and Flore Payen. 2009. “Comparison of the Effects of a Liquid Yogurt and
Chocolate Bars on Satiety: A Multidimensional Approach.” British Journal of
Nutrition 103 (05): 760.
128
Claessens, M., M.A. Van Baak, S. Monsheimer, and W.H.M. Saris. 2009. “The Effect of a
Low-Fat, High-Protein or High-Carbohydrate Ad Libitum Diet on Weight Loss
Maintenance and Metabolic Risk Factors.” International Journal of Obesity 33 (3):
296–304.
Cordero-Herrera, Isabel, María Angeles Martín, Laura Bravo, Luis Goya, and Sonia Ramos.
2013. “Cocoa Flavonoids Improve Insulin Signalling and Modulate Glucose
Production via AKT and AMPK in HepG2 Cells.” Molecular Nutrition & Food
Research 57 (6): 974–85.
Crum, Alia J., William R. Corbin, Kelly D. Brownell, and Peter Salovey. 2011. “Mind over
Milkshakes: Mindsets, Not Just Nutrients, Determine Ghrelin Response.” Health
Psychology 30 (4): 424–29.
Diepvens, K., D. Häberer, and M. Westerterp-Plantenga. 2007. “Different Proteins and
Biopeptides Differently Affect Satiety and Anorexigenic/orexigenic Hormones in
Healthy Humans.” International Journal of Obesity 32 (3): 510–18.
Farnfield, Michelle M, Craige Trenerry, Kate A Carey, and David Cameron-Smith. 2009.
“Plasma Amino Acid Response after Ingestion of Different Whey Protein Fractions.”
International Journal of Food Sciences and Nutrition 60 (6): 476–86.
Finkelstein, Eric A., Christopher J. Ruhm, and Katherine M. Kosa. 2005. “Economic Causes
and Consequences of Obesity.” Annual Review of Public Health 26 (1): 239–57.
Flint, A., A. Raben, J.E. Blundell, and A. Astrup. 2000. “Reproducibility, Power and Validity
of Visual Analogue Scales in Assessment of Appetite Sensations in Single Test Meal
Studies.” International Journal of Obesity & Related Metabolic Disorders 24 (1).
Food and Nutrition Board. 2013. "Dietary Reference Intakes (DRIs): Estimated Average
Requirements." Institute of Medicine, National Academies. Washington, D.C.
Fu, Zhuo, Julia Yuskavage, and Dongmin Liu. 2013. “Dietary Flavonol Epicatechin Prevents
the Onset of Type 1 Diabetes in Nonobese Diabetic Mice.” Journal of Agricultural
and Food Chemistry 61 (18): 4303–9.
Grassi, Davide, Giovambattista Desideri, Stefano Necozione, Cristina Lippi, Raffaele Casale,
Giuliana Properzi, Jeffrey B. Blumberg, and Claudio Ferri. 2008. “Blood Pressure Is
Reduced and Insulin Sensitivity Increased in Glucose-Intolerant, Hypertensive
Subjects after 15 Days of Consuming High-Polyphenol Dark Chocolate.” The Journal
of Nutrition 138 (9): 1671–76.
129
Gu, Yeyi, William J. Hurst, David A. Stuart, and Joshua D. Lambert. 2011. “Inhibition of
Key Digestive Enzymes by Cocoa Extracts and Procyanidins.” Journal of
Agricultural and Food Chemistry 59 (10): 5305–11.
Hall, W. L., D. J. Millward, S. J. Long, and L. M. Morgan. 2007. “Casein and Whey Exert
Different Effects on Plasma Amino Acid Profiles, Gastrointestinal Hormone
Secretion and Appetite.” British Journal of Nutrition 89 (02): 239.
Huang, Xu-Feng, Yingxu Liu, Gita L. Rahardjo, Peter L. Mclennan, Linda C. Tapsell, and
William A. Buttemer. 2008. “Effects of Diets High in Whey, Soy, Red Meat and Milk
Protein on Body Weight Maintenance in Diet-Induced Obesity in Mice.” Nutrition &
Dietetics 65 (June): S53–S59.
Jalil, Abbe Maleyki, Amin Ismail, Pei Pei Chong, Muhajir Hamid, and Syed Hasbullah Syed
Kamaruddin. 2009. “Effects of Cocoa Extract Containing Polyphenols and
Methylxanthines on Biochemical Parameters of Obese-Diabetic Rats.” Journal of the
Science of Food and Agriculture 89 (1): 130–37.
Jalil, Abbe Maleyki Mhd, Amin Ismail, Chong Pei Pei, Muhajir Hamid, and Syed Hasbullah
Syed Kamaruddin. 2008. “Effects of Cocoa Extract on Glucometabolism, Oxidative
Stress, and Antioxidant Enzymes in Obese-Diabetic (Ob-Db) Rats.” Journal of
Agricultural and Food Chemistry 56 (17): 7877–84.
Johnston, Kelly, Paul Sharp, Michael Clifford, and Linda Morgan. 2005. “Dietary
Polyphenols Decrease Glucose Uptake by Human Intestinal Caco-2 Cells.” FEBS
Letters 579 (7): 1653–57.
Josic, Julija, Anna Tholén Olsson, Jennie Wickeberg, Sandra Lindstedt, and Joanna
Hlebowicz. 2010. “Does Green Tea Affect Postprandial Glucose, Insulin and Satiety
in Healthy Subjects: A Randomized Controlled Trial.” Nutrition Journal 9 (1): 63.
Kobayashi, Yoko, Miho Suzuki, Hideo Satsu, Soichi Arai, Yukihiko Hara, Koichi Suzuki,
Yusei Miyamoto, and Makoto Shimizu. 2000. “Green Tea Polyphenols Inhibit the
Sodium-Dependent Glucose Transporter of Intestinal Epithelial Cells by a
Competitive Mechanism.” Journal of Agricultural and Food Chemistry 48 (11):
5618–23.
Koopmans, Sietse J., Marijke Frolich, Eric H. Gribnau, Rudi GJ Westendorp, and Ralph A.
DeFronzo. 1998. “Effect of Hyperinsulinemia on Plasma Leptin Concentrations and
Food Intake in Rats.” American Journal of Physiology-Endocrinology and
Metabolism 274 (6): E998–E1001.
130
Leidy, Heather J, Louise I. Bales-Voelker, and Corey T. Harris. 2011. “A Protein-Rich
Beverage Consumed as a Breakfast Meal Leads to Weaker Appetitive and Dietary
Responses v. a Protein-Rich Solid Breakfast Meal in Adolescents.” British Journal of
Nutrition 106 (01): 37–41.
Lejeune, Manuela P.G.M., Klaas R. Westerterp, Tanja C.M. Adam, Natalie D. LuscombeMarsh, and Margriet S. Westerterp-Plantenga. 2006. “Ghrelin and Glucagon-like
Peptide 1 Concentrations, 24-H Satiety, and Energy and Substrate Metabolism during
a High-Protein Diet and Measured in a Respiration Chamber.” The American Journal
of Clinical Nutrition 83 (1): 89–94.
Levitt Katz, Lorraine E., Máire Abraham, Line Johansen, and Abbas F. Jawad. 2006. “Leptin
Levels Decline Steadily during Prolonged Fasting in Lean Children.” The Journal of
Pediatrics 149 (6): 798–802.e1.
Li, Yue, Yun Feng, Song Zhu, Changrong Luo, Jianguo Ma, and Fang Zhong. 2012. “The
Effect of Alkalization on the Bioactive and Flavor Related Components in
Commercial Cocoa Powder.” Journal of Food Composition and Analysis 25 (1): 17–
23.
Liu, Jianmei, Hasan Askari, and Samuel Dagogo-Jack. 1999. “Reproducibility of Fasting
Plasma Leptin Concentration in Lean and Obese Humans.” Endocrine Research 25
(1): 1–10.
Lustig, Robert H. 2006. “Childhood Obesity: Behavioral Aberration or Biochemical Drive?
Reinterpreting the First Law of Thermodynamics.” Nature Clinical Practice
Endocrinology & Metabolism 2 (8): 447–58.
Lynch, C. J., Beth Gern, Carlyn Lloyd, Susam M Hutson, Rachel Eicher, and Thomas C
Vary. 2006. “Leucine in Food Mediates Some of the Postprandial Rise in Plasma
Leptin Concentrations.” AJP: Endocrinology and Metabolism 291 (3): E621–E630.
Maeda, Norikazu, Masahiko Takahashi, Tohru Funahashi, Shinji Kihara, Hitoshi Nishizawa,
Ken Kishida, Hiroyuki Nagaretani, Morihiro Matsuda, Ryutaro Komuro, and
Noriyuki Ouchi. 2001. “PPARγ Ligands Increase Expression and Plasma
Concentrations of Adiponectin, an Adipose-Derived Protein.” Diabetes 50 (9): 2094–
99.
Massolt, Elske T., Paul M. van Haard, Jens F. Rehfeld, Eduardus F. Posthuma, Eveline van
der Veer, and Dave H. Schweitzer. 2010. “Appetite Suppression through Smelling of
Dark Chocolate Correlates with Changes in Ghrelin in Young Women.” Regulatory
Peptides 161 (1-3): 81–86.
131
Matsui, Naoko, Ryoichi Ito, Eisaku Nishimura, Mariko Yoshikawa, Masatoshi Kato,
Masanori Kamei, Haruki Shibata, Ichiro Matsumoto, Keiko Abe, and Shuichi
Hashizume. 2005. “Ingested Cocoa Can Prevent High-Fat Diet-Induced Obesity by
Regulating the Expression of Genes for Fatty Acid Metabolism.” Nutrition 21 (5):
594–601.
Mattes, Richard D., and Wayne W. Campbell. 2009. “Effects of Food Form and Timing of
Ingestion on Appetite and Energy Intake in Lean Young Adults and in Young Adults
with Obesity.” Journal of the American Dietetic Association 109 (3): 430–37.
Mellinkoff, Sherman M., Marjorie Frankland, David Boyle, and Margaret Greipe. 1997.
"Relationship between serum amino acid concentration and fluctuations in appetite."
Obesity Research, 5 (4): 381–384.
Min, S Y, H Yang, S G Seo, S H Shin, M-Y Chung, J Kim, S J Lee, H J Lee, and K W Lee.
2012. “Cocoa Polyphenols Suppress Adipogenesis in Vitro and Obesity in Vivo by
Targeting Insulin Receptor.” International Journal of Obesity 37 (4): 584–92.
Morrison, C. D., X. Xi, C. L. White, J. Ye, and R. J. Martin. 2007. “Amino Acids Inhibit
Agrp Gene Expression via an mTOR-Dependent Mechanism.” Endocrinology and
Metabolism 293 (1): E165–E171.
Myers, Martin G., Michael A. Cowley, and Heike Münzberg. 2008. “Mechanisms of Leptin
Action and Leptin Resistance.” Annual Review of Physiology 70 (1): 537–56.
Nilsson, Mikael, Jens J. Holst, and Inger ME Björck. 2007. “Metabolic Effects of Amino
Acid Mixtures and Whey Protein in Healthy Subjects: Studies Using GlucoseEquivalent Drinks.” The American Journal of Clinical Nutrition 85 (4): 996–1004.
Ølholm, J., S.K. Paulsen, K.B. Cullberg, B. Richelsen, and Steen Bønløkke Pedersen. 2010.
“Anti-Inflammatory Effect of Resveratrol on Adipokine Expression and Secretion in
Human Adipose Tissue Explants.” International Journal of Obesity 34 (10): 1546–53.
Pasiakos, S.M., J.J. Cao, L.M. Margolis, E.R. Sauter, L.D. Whigham, J.P. McClung, J.C.
Rood, J.W. Carbone, G.F. Combs, and A.J. Young. 2013. “Effects of High-Protein
Diets on Fat-Free Mass and Muscle Protein Synthesis Following Weight Loss: A
Randomized Controlled Trial.” The FASEB Journal 27 (9): 3837–47.
Purintrapiban, Juntipa, Maitree Suttajit, and Neil E. Forsberg. 2006. “Differential Activation
of Glucose Transport in Cultured Muscle Cells by Polyphenolic Compounds from
Canna Indica L. Root.” Biological and Pharmaceutical Bulletin 29 (10): 1995.
132
Roh, Cecilia, Jianrong Han, Alexandros Tzatsos, and Konstantin V. Kandror. 2003.
“Nutrient-Sensing mTOR-Mediated Pathway Regulates Leptin Production in Isolated
Rat Adipocytes.” American Journal of Physiology-Endocrinology And Metabolism
284 (2): E322–E330.
Ruzaidi, A., I. Amin, A.G. Nawalyah, M. Hamid, and H.A. Faizul. 2005. “The Effect of
Malaysian Cocoa Extract on Glucose Levels and Lipid Profiles in Diabetic Rats.”
Journal of Ethnopharmacology 98 (1-2): 55–60.
Saad, Mohammed F., Arshad Khan, Alok Sharma, Ragui Michael, Maggy G. Riad-Gabriel,
Rima Boyadjian, Sujata D. Jinagouda, Garry M. Steil, and Vikram Kamdar. 1998.
“Physiological Insulinemia Acutely Modulates Plasma Leptin.” Diabetes 47 (4): 544–
49.
Sørensen, L.B., and A Astrup. 2011. “Eating Dark and Milk Chocolate: A Randomized
Crossover Study of Effects on Appetite and Energy Intake.” Nutrition and Diabetes 1
(12): e21.
Stull, April J., John W. Apolzan, Anna E. Thalacker-Mercer, Heidi B. Iglay, and Wayne W.
Campbell. 2008. “Liquid and Solid Meal Replacement Products Differentially Affect
Postprandial Appetite and Food Intake in Older Adults.” Journal of the American
Dietetic Association 108 (7): 1226–30.
Sun, Xiaocun, and Michael B Zemel. 2007. “Leucine and Calcium Regulate Fat Metabolism
and Energy Partitioning in Murine Adipocytes and Muscle Cells.” Lipids 42 (4): 297–
305.
Teff, Karen L., Sharon S. Elliott, Matthias Tschöp, Timothy J. Kieffer, Daniel Rader, Mark
Heiman, Raymond R. Townsend, Nancy L. Keim, David D’Alessio, and Peter J.
Havel. 2004. “Dietary Fructose Reduces Circulating Insulin and Leptin, Attenuates
Postprandial Suppression of Ghrelin, and Increases Triglycerides in Women.” The
Journal of Clinical Endocrinology & Metabolism 89 (6): 2963–72.
Tieken, S., H. Leidy, A. Stull, R. Mattes, R. Schuster, and W. Campbell. 2007. “Effects of
Solid versus Liquid Meal-Replacement Products of Similar Energy Content on
Hunger, Satiety, and Appetite-Regulating Hormones in Older Adults.” Hormone and
Metabolic Research 39 (5): 389–94.
Torres-Leal, Francisco L., Miriam H. Fonseca-Alaniz, Gabriela FR Teodoro, Mariana D. de
Capitani, Daiana Vianna, Lucas C. Pantaleão, Emidio M. Matos-Neto, Marcelo M.
Rogero, Jose Donato Jr, and Julio Tirapegui. 2011. “Leucine Supplementation
Improves Adiponectin and Total Cholesterol Concentrations despite the Lack of
133
Changes in Adiposity or Glucose Homeostasis in Rats Previously Exposed to a HighFat Diet.” Cellulose 50 (50.0): 50–0.
Tschritter, Otto, Andreas Fritsche, Claus Thamer, Michael Haap, Fatemeh Shirkavand,
Stefanie Rahe, Harald Staiger, Elke Maerker, Hans Häring, and Michael Stumvoll.
2003. “Plasma Adiponectin Concentrations Predict Insulin Sensitivity of Both
Glucose and Lipid Metabolism.” Diabetes 52 (2): 239–43.
Utriainen, Tapio, Raija Malmström, Sari Mäkimattila, and Hannele Yki-Järvinen. 1996.
“Supraphysiological Hyperinsulinemia Increases Plasma Leptin Concentrations after
4 H in Normal Subjects.” Diabetes 45 (10): 1364–66.
Veldhorst, M., A. Smeets, S. Soenen, A. Hochstenbach-Waelen, R. Hursel, K. Diepvens, M.
Lejeune, N. Luscombe-Marsh, and M. Westerterp-Plantenga. 2008. “Protein-Induced
Satiety: Effects and Mechanisms of Different Proteins.” Physiology & Behavior 94
(2): 300–307.
Wadikar, Dadasaheb D., and K.S. Premavalli. 2011. “Effect of Appetizer Administration on
Plasma Leptin Level in Human Volunteers.” International Journal of Food Sciences
and Nutrition 62 (2): 148–51.
Wang, S, S. Noh, and S. Koo. 2006. “Green Tea Catechins Inhibit Pancreatic Phospholipase
A2 and Intestinal Absorption of Lipids in Ovariectomized Rats.” The Journal of
Nutritional Biochemistry 17 (7): 492–98.
Weigle, David S., Patricia A. Breen, Colleen C. Matthys, Holly S. Callahan, Kaatje E.
Meeuws, Verna R. Burden, and Jonathan Q. Purnell. 2005. “A High-Protein Diet
Induces Sustained Reductions in Appetite, Ad Libitum Caloric Intake, and Body
Weight despite Compensatory Changes in Diurnal Plasma Leptin and Ghrelin
Concentrations.” The American Journal of Clinical Nutrition 82 (1): 41–48.
Westerterp-Plantenga, M.S., V. Rolland, S.A. J. Wilson, and K.R. Westerterp. 1999. “Satiety
Related to 24 H Diet-Induced Thermogenesis during High Protein/carbohydrate vs
High Fat Diets Measured in a Respiration Chamber.” European Journal of Clinical
Nutrition 53 (6): 495–502.
Wijlens, Anne G.M., Alfrun Erkner, Erin Alexander, Monica Mars, Paul A.M. Smeets, and
Cees de Graaf. 2012. “Effects of Oral and Gastric Stimulation on Appetite and
Energy Intake.” Obesity 20 (11): 2226–32.
Yamaguchi, Makoto, and Shoko Takai. 2014. “Chronic Administration of Bovine MilkDerived Α-Lactalbumin Improves Glucose Tolerance via Enhancement of
134
Adiponectin in Goto–Kakizaki Rats with Type 2 Diabetes.” Biological and
Pharmaceutical Bulletin 37 (3): 404–8.
Yamashita, Yoko, Masaaki Okabe, Midori Natsume, and Hitoshi Ashida. 2012. “Prevention
Mechanisms of Glucose Intolerance and Obesity by Cacao Liquor Procyanidin
Extract in High-Fat Diet-Fed C57BL/6 Mice.” Archives of Biochemistry and
Biophysics 527 (2): 95–104.
Yamauchi, Toshimasa, J. Kamon, H. Waki, Y. Terauchi, N. Kubota, K. Hara, Y. Mori, T.
Ide, K. Murakami, and N. Tsuboyama-Kasaoka. 2001. “The Fat-Derived Hormone
Adiponectin Reverses Insulin Resistance Associated with Both Lipoatrophy and
Obesity.” Nature Medicine 7 (8): 941–46.
135
APPENDICES
136
APPENDIX A: CELL CULTURE SUPPLEMENTARY
MATERIAL
137
Table A.1. Epicatechin polymer (1-10) content of cocoa polyphenolic extract used in 3T3-L1
cell culture treatments.
Epicatechin degree Concentration
of polymerization
(ppm)
1
2
3
4
5
6
7
8
9
10
504
324
216
207
132
108
124
142
71
52
Total
1878
Table A.2. Methylxanthine content of cocoa polyphenolic extract used in 3T3-L1 cell culture
treatments.
Concentration
Methylxanthine
(mg/ml)
Proanthocyanidins
(1-10 monomers)
Theobromine
Caffeine
1.88
1.73
0.15
138
Figure A.1. Effects of leucine treatment on pre-adipocyte lipid accumulation during
differentiation
139
APPENDIX B: CLINICAL TRIAL SUPPLEMENTARY
MATERIAL
140
Table A.3. Compositional, DMAC, and PAC 1-10 analysis results for regular high
polyphenolic and Dutched low polyphenolic cocoa.
Analysis
Dose, g
Calories
Fat, g (calculated)
Sat fat, g
Trans fat, g
Cholesterol, mg
Sodium, mg
Carbohydrates, g
Dietary fiber, g
Sugar, g
Protein, g
Vitamin A, IU
Vitamin C, mg
Calcium, mg
Iron, mg
Magnesium, mg
Caffeine, mg
Theobromine, mg
Content (per g of cocoa)
Regular, high
Dutched, low
polyphenolic cocoa
polyphenolic cocoa
1
2
0.11
0.066
0
0
0.2
0.58
0.332
0.0175
0.196
0
0
1.28
0.4
5
0.23
2.2
Total Polyphenols, mg
Catechin, mg
Epicatechin, mg
62
1.5
3.5
Total Flavanols (DMAC), mg
44
6.7
Proanthocyanidins (PACs)
PAC 1-10, mg on whole product
24.16
1.82
PACs 1 mers
5.6
0.6
PACs 2 mers
3.5
0.3
PACs 3 mers
2.5
0.2
PACs 4 mers
2.9
0.2
PACs 5 mers
2.4
0.1
PACs 6 mers
2.4
0.1
PACs 7 mers
2.2
0.2
PACs 8 mers
0.72
0.1
PACs 9 mers
1.4
0.1
PACs 10 mers
0.45
0.1
All analyses performed courtesy of The Hershey Co.
Abbreviations: DMAC: 4-dimethylaminocinnamaldehyde, PAC 1-10: proanthocyanidin 1-10. Both
representative of proanthocyanidin content; DMAC measures total flavanols (all polymer lengths) while PAC 110 describes only catechin or epicatechin polymers between 1 and 10 units in length.
141
Figure A.2. Clinical trial panelist instructions for each session.
!"#$%&'$()"#*
!
+,-.#-*%-./*.,,*0&(/-,("-#*'.%-1&,,2*3-1)%-*3-0(""("04***
"#$! %&''! (#'')(*! +! *#*+'! #,! -! .'##/! 0'$(#1)! 2)+/&3014! 56)! ,&21*! 2)+/&30! %&''! .)! /#3)! .),#2)!
(#31$7&30!+38!1+79')4!56)!:!1$.1);$)3*!2)+/&301!%&''!.)!/#3)!<=>!?=>!@A=>!+3/!A:=!7&3$*)1!+,*)2!
(#31$7&30!*6)!1+79')4!"#$!%&''!92#B&/)!@==!7&(2#'&*)21!#,!.'##/!.),#2)>!+3/!<=>!?=>!@A=>!+3/!A:=!
7&3$*)1!+,*)2!(#31$7&30!+!1+79')4!+,-.#-*.#5*(1*2)&*6.7-*."2*8&-#$()"#4!
!
@4 C+D)!1$2)!*6+*!8#$!6+B)!*6)!,#''#%&30!&*)71E!
• @!.'##/!0'$(#1)!7)*)2!
• @!2)(#2/!16))*!
• -!'+3()*1!
• @!*&7)2!
• -!.'##/!0'$(#1)!*)1*!1*2&91!
• -!.+3/+&/1!
• -!.'##/!(#'')(*!B&+'1!
!
!
• -!/&1&3,)(*&30!%&9)1!
• @!/2&3D!1+79')!
• A==!7'!%+*)2
A4 F2&*)!8#$2!9."-,(#$!')/-!+3/!$)/.2:#!/.$-!#3!*6)!2)(#2/!16))*4!!
;."5*2)&%*.99-$($-!,#2!*&7)!=4!
!
<4 <-.#&%-*."/*%-')%/*=#$*3,))/*0,&')#-*%-./("0*G,+1*&30!.'##/!0'$(#1)H4!!I,!7)*)2!
16#%1!+!2)+/&30!.3)7-*==>*?0@/,>!9')+1)!+')2*!#3)!#,!*6)!2)1)+2(6)214!!J#''#%!*6)1)!
&31*2$(*!*#!#.*+&3!+!.'##/!0'$(#1)!2)+/&30E!
!
+4 I31)2*!*#9!)3/!#,!*)1*!1*2&9!&3*#!.'##/!0'$(#1)!7)*)24!!!!!!!!!!!!!!!!!!!!!!!!!!!!!!!!!!!!!!!!!!!!!!!!!!!!!!!!!!!!!!!
.4 K$.!,&30)2*&9!B&0#2#$1'8!,#2!+!,)%!1)(#3/1!$3*&'!8#$!,))'!&*!0)**&30!%+274!!!
(4 L&1&3,)(*!,&30)2*&9!+3/!3+&'!.)/!%&*6!+'(#6#'!%&9)4!
/4 F&*6!*6)!'+3()*!3))/')!)3/!*#%+2/!8#$2!3+&'!.)/>!92)11!*6)!8)''#%!.$**#3!+3/!
'+3()!!!!!!!
,&30)24!
!
!
!
!
!
!
!
!
!
!
!
!
!
!
142
(
(
(
(
(
(
(
(
(
(
!" #!$%&'(%)*+,()$!(!-.!()/(%!0%(0%123(%)(4&))-(0563&!(*$%2&(')*(0!!(5(
+)*$%-)7$"(852%(/)1($*64!1(%)(533!51"(9/(:;<(533!510()$(%,!(0+1!!$=(%,!1!(
750($)%(!$)*.,(4&))-()$(%,!(%!0%(0%123(%)()4%52$(%,!(1!5-2$."((>!3&5+!(%,!(%!0%(
0%123(72%,(5(+&!5$()$!(5$-(1!3!5%(0%!30(?;@"(
O)1(4!0%(1!0*&%0(,)&-(6!%!1(%,20(
75'"(P&))-(72&&(4!(0*+%2)$!-(2$%)(
%,!(%!0%(0%123"(
/" A$(%,!(1!+)1-(0,!!%=(1!+)1-(%,!($*64!1(-203&5'!-()$(%,!(0+1!!$(5$-(%26!(5%(
7,2+,(')*(%))B(%,!(1!5-2$."(
." C203)0!()/(&5$+!%(5$-(%!0%(0%123(2$(!"#$%&'("!)*'#(")+,&('$&"-(5/%!1(!5+,(
1!5-2$."(
(
(
D)&&!+%(EFF(62+1)&2%!10()/(4&))-(2$%)(-!02.$5%!-(0%!12&!(%*4!(G0!!(32+%*1!(4!&)7H"(.'/")
#0-")(1")(02")$#)3'2"3"!)*$(1)4567)859:;)<=.:)>;)'&!)?::@)AB)I1!00(/2$.!1%23(%)(5&&)7(
4&))-(%)(-123(2$%)(J25&"(9/(')*(,5J!(%1)*4&!(.!%%2$.(!$)*.,(4&))-=(*0!(5($!7(&5$+2$.(-!J2+!(%)(
&5$+!(%,!(02-!()1(%23()/(5(-2//!1!$%(/2$.!1"(
<" D&)0!(J25&=(2$J!1%(?(%26!0=(5$-(.2J!(%)(1!0!51+,!1"(C202$/!+%(/2$.!1%23(5$-(533&'(45$-5.!(
2/($!!-!-B(()
)
)
I"&(3J)#+-'F")23,,!),&)D$&%"-)'3,&%)
(
$&#$!")"!%"),D)(02")'&!)('F)(02")(,)
(
%"()23,,!)(,)(1")2,((,E),D)(02"B)
(
(
(
(
(
(
(
)
O2&&(%)(%,20(&!J!&(
?" C1'/")+,&("&(#),D)!-$&/)#'EF3";)%,!$()3!$(5$-)+)$0*6!(!$%21!(+)$%!$%0()/(0563&!(2$)
3"##)(1"&)G>)E$&0("#B(K--(LFF(6&()/(75%!1(%)(0,5B!1(4)%%&!-=(0,5B!=(5$-(+)$0*6!(
1!652$2$.(0563&!M75%!1"(966!-25%!&'=)#"()($E"-)(,)H>)E$&0("#)'&!)2"%$&)($E$&%B)
C12$B(75%!1(%,1)*.,)*%(1!652$2$.(0!002)$(50($!!-!-"))
)
N" >5$B(5$-(+)66!$%()$(')*1(3$/$&%),D)(1")#'EF3"()$(%,!(1!+)1-(0,!!%(/)16")
(
(
(
143
!
!
!" #$%&'()*+,%-.*+/%0/'(1'(2%,-&34+5%%
-" "#$%!&'($)!*+$,!+--.!&/0$!"#$!%&''$!(&)*'+,!-,.$/#(0!1$2+)3!&#$!%4(5$)!
/%3!&'($6!%
6" 7$&!&'($)!-+)!89!('%4&$,!/%3!5$*'%!&'('%*6!%
7" :(($3'/&$;<!*'&&,*1!233!4/*-'&/1,-+!'5!%&''$!'%&+!3$,'*%/&$3!,&$)';$!&45$!
;/5$;$3!6/17!89:;!<9=>?!@AB>!C3?!.#$!D>>E!F0!=','%-$2&!-'%*$)&'>!/%3!
/>>;<!/!5/%3/*$!'-!%$2$,,/)<6!:%?$)&!,/(>;$!&45$!@!&'($,6%
0" ;.#G!H')!.II,1/1,!-+)!89!('%4&$!&'($!>+'%&6%
!
#" 8$%&'()*+,%-.*+/%0/'(1'(2%,-&34+5%%
-" "#$%!&'($)!*+$,!+--.!&/0$!C-$!%&''$!(&)*'+,!-,.$/#(0!1$2+)3!&#$!%4(5$)!
/%3!&'($6!%
6" 7$&!&'($)!-+)!A9!('%4&$,!/%3!5$*'%!&'('%*6!%
7" :(($3'/&$;<!*'&&,*1!233!4/*-'&/1,-+!'5!%&''$!'%&+!3$,'*%/&$3!,&$)';$!&45$!
;/5$;$3!6/17!89:;!<9=>?!@AB>!J3?!.#$!D>>E!F0!=','%-$2&!-'%*$)&'>!/%3!
/>>;<!/!5/%3/*$!'-!%$2$,,/)<6!:%?$)&!,/(>;$!&45$!@!&'($,6%
0" ;.#G!H')!.II,1/1,!-+)!A9!('%4&$!&'($!>+'%&6%
!
!
9" :;$%&'()*+,%-.*+/%0/'(1'(2%,-&34+5%%
-" "#$%!&'($)!*+$,!+--.!&/0$!K17!%&''$!(&)*'+,!-,.$/#(0!1$2+)3!&#$!%4(5$)!
/%3!&'($6!%
6" 7$&!&'($)!-+)!BC9!('%4&$,!/%3!5$*'%!&'('%*6!%
7" :(($3'/&$;<!*'&&,*1!233!4/*-'&/1,-+!'5!%&''$!'%&+!3$,'*%/&$3!,&$)';$!&45$!
;/5$;$3!6/17!89:;!<9=>?!@AB>!2"3?!.#$!D>>E!F0!=','%-$2&!-'%*$)&'>!/%3!
/>>;<!/!5/%3/*$!'-!%$2$,,/)<6!:%?$)&!,/(>;$!&45$!@!&'($,6%
0" ;.#G!H')!.II,1/1,!-+)!BC9!('%4&$!&'($!>+'%&6%
!
<" ;9$%&'()*+,%-.*+/%0/'(1'(2%,-&34+5%%
-" "#$%!&'($)!*+$,!+--.!1.G,!L17!%&''$!(&)*'+,!-,.$/#(0!1$2+)3!&#$!%4(5$)!
/%3!&'($6!%
6" :(($3'/&$;<!*'&&,*1!233!4/*-'&/1,-+!'5!%&''$!'%&+!3$,'*%/&$3!,&$)';$!&45$!
;/5$;$3!6/17!89:;!<9=>?!@AB>!"K3?!.#$!D>>E!F0!=','%-$2&!-'%*$)&'>!/%3!
/>>;<!/!5/%3/*$!'-!%$2$,,/)<6!:%?$)&!,/(>;$!&45$!@!&'($,6%
7" ;.#G!H')!.II,1/1,!-+)!CD9!('%4&$!&'($!>+'%&6%
A6 E;$/,$!>;/2$!4%4,$3!;/%2$&,.!5/%3/*$,.!/;2+#+;!F'>$,.!/%3!&$,&!,&)'>,!+%!<+4)!>/%$;',&!
(/&6!=',>+,$!+-!4,$3!;/%2$&,.!3','%-$2&'%*!F'>$,.!/%3!5/%3/*$,!'%!3$,'*%/&$3!
5'+#/G/)3!F/,&$!5'%6!M.#$!/#!-,*'-$!+7,,1!.#$!&,.N,!,N,-H17/#(!,&+,!.1!17,!1.%&,0!
!
!
@7.#G!H')!5'-!H')-!7,&IO!
144
Figure A.3. Panelist session record form.
Panelist code:
Sample code:
Panelist Record Sheet
Date: ___________
Time 0:
Please record your blood glucose reading directly from the instrument: ___________
How hungry do you feel? Please mark a vertical line with your response on the scale below.
30 minutes:
Please record your blood glucose reading directly from the instrument: ___________
How hungry do you feel? Please mark a vertical line with your response on the scale below.
60 minutes:
Please record your blood glucose reading directly from the instrument: ___________
How hungry do you feel? Please mark a vertical line with your response on the scale below.
120 minutes:
Please record your blood glucose reading directly from the instrument: ___________
How hungry do you feel? Please mark a vertical line with your response on the scale below.
240 minutes:
Please record your blood glucose reading directly from the instrument: ___________
How hungry do you feel? Please mark a vertical line with your response on the scale below.
145
Panelist code:
Sample code:
Sample Liking
Please circle the number that corresponds with your like or dislike of the overall sample:
9
8
7
6
5
4
3
2
1
Like extremely
Like very much
Like moderately
Like slightly
Neither like or dislike
Dislike slightly
Dislike moderately
Dislike very much
Dislike extremely
Please circle the number that corresponds with your like or dislike of the flavor:
9
8
7
6
5
4
3
2
1
Like extremely
Like very much
Like moderately
Like slightly
Neither like or dislike
Dislike slightly
Dislike moderately
Dislike very much
Dislike extremely
Please circle the number that corresponds with your like or dislike of the texture/mouthfeel:
9
8
7
6
5
4
3
2
1
Like extremely
Like very much
Like moderately
Like slightly
Neither like or dislike
Dislike slightly
Dislike moderately
Dislike very much
Dislike extremely
Comments:
______________________________________________________________________________
______________________________________________________________________________
146
Figure A.4. Averaged hedonic liking results for overall beverage, flavor, and texture.
Ranking on a 9-point scale, with 0 labeled as “extremely dislike” and 9 as “like extremely.”
Values shown in mean ± S.E.
147
© Copyright 2026 ExpyDoc


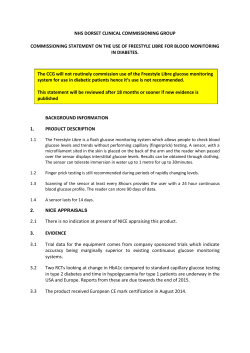

![PDF [2.90 MB] - Nutrition Partner](http://s3.expydoc.com/store/data/002525669_1-f8922e1cb608f3a298d4657381e809de-250x500.png)


