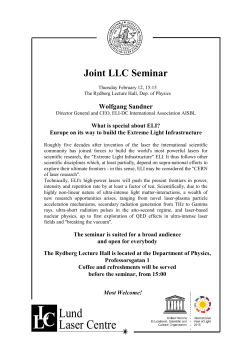
VOLUME 90, N UMBER 16 PHYSICA L R EVIEW LET T ERS week ending 25 APRIL 2003 First Observation of Atomic Levels for the Element Fermium (Z 100) M. Sewtz, H. Backe, A. Dretzke, G. Kube, W. Lauth, and P. Schwamb Institut fu¨r Kernphysik, Universita¨t Mainz, D-55099 Mainz, Germany K. Eberhardt, C. Gru¨ning, P. Tho¨rle, and N. Trautmann Institut fu¨ r Kernchemie, Universita¨t Mainz, D-55099 Mainz, Germany P. Kunz, J. Lassen, and G. Passler Institut fu¨r Physik, Universita¨t Mainz, D-55099 Mainz, Germany C. Z. Dong and S. Fritzsche Fachbereich Physik, Universita¨t Kassel, D-34132 Kassel, Germany R. G. Haire Oak Ridge National Laboratory, Oak Ridge, Tennessee 37831-6375 (Received 25 October 2002; revised manuscript received 6 March 2003; published 25 April 2003) The atomic level structure of the element fermium was investigated for the first time using a sample of 2:7 1010 atoms of the isotope 255 Fm with a half-life of 20.1 h. The atoms were evaporated from a filament and stored in the argon buffer gas of an optical cell. Atomic levels were sought by the method of resonance ionization spectroscopy using an excimer-dye-laser combination. Two atomic levels were found at wave numbers 25 099:8 0:2 and 25 111:8 0:2 cm1 . Partial transition rates to the 5f12 7s2 3 H e6 ground state have been determined from their saturation characteristics. Multiconfiguration Dirac-Fock calculations suggest that the leading orders of these levels could be the 5f12 7s7p 5 I o6 and 5f12 7s7p 5 Go5 terms. DOI: 10.1103/PhysRevLett.90.163002 PACS numbers: 32.30.–r, 31.10.+z, 32.10.Hq, 32.70.–n The investigation of atomic, chemical, and nuclear properties of heavy elements with charge numbers of Z > 100 is a real challenge. Heavy elements are produced in nuclear fusion reactions with rates of sometimes only a few atoms per week [1]. Their lifetimes are short, occasionally only in the order of milliseconds. At present, the most advanced method for the investigation of the properties of heavy elements is chemistry on single atoms in aqueous solutions [2] and in the gas phase [3]. This technique has already yielded detailed chemical information up to Z 108 [4]. Such experiments aid in the investigation of relativistic effects. For the heaviest elements these may result in alterations from expectations within a period of homolog elements. Relativistic effects, roughly speaking, originate from a shrinkage of the wave functions of inner shell electrons which, in turn, influence the binding energy of the valence electrons and thus the chemical properties. In the actinide region these are the 5f, 6d, 7p, and 7s orbitals. Therefore, a more direct approach to investigate relativistic effects may be to study first ionization potentials (IP) or, even better, the atomic level schemes, both experimentally and by relativistic ab initio multiconfiguration Dirac-Fock (MCDF) calculations or other methods [5–7]. However, any atomic spectroscopy, even with the most sensitive laser methods, is hampered by the fact that a broadband search for levels is limited due to the small number of atoms available for the studies. To obtain reliable information under these circumstances, it is necessary to incorporate theoretical level predictions in performing the experiments. In this Letter we report our successful search for predicted atomic levels for elemental fermium for which experimental information was not available previously. As mentioned, very sophisticated experimental methods are required for a level search. For production rates of about 10 s1 the radiation detected resonance ionization spectroscopy technique in a buffer gas cell can be applied to investigate radioactive nuclides with half-lives as short as 1 ms, as has been demonstrated with the spectroscopic investigations of the 240f;242f Am fission isomers [8]. The detection of the ionization process by radioactive decay limits the applicability of this method to nuclides with half-lives of less than a few minutes. This method has thus been developed further to the ion guide-detected resonance ionization spectroscopy (IGRIS) [9]. In the latter, radioactive decay detection is replaced by massselective direct detection of the ions, similar to the ion guide isotope separation on-line (IGISOL) technique [10], where the ions leaving the buffer gas cell are separated from the gas jet and mass analyzed using a sector magnet or a quadrupole mass filter [11]. The combination of resonance ionization spectroscopy and mass analysis provides information on both the nuclear charge number and the mass of the ions. This method is therefore well suited for the spectroscopy of the isotope 255 Fm with a half-life of 20.1 h. 163002-1 2003 The American Physical Society 0031-9007=03=90(16)=163002(4)$20.00 163002-1 Buffer-Gas Cell Laser Beam Optical Fiber Channeltron TMP III 330 l/s Fm Filament QMS TMP IV 230 l/s TMP I 700 l/s TMP II 360 l/s LPM α Detector 0 5 10 cm FIG. 1 (color online). Experimental setup. The four sections are evacuated by turbo molecular pumps (TMP) with relatively low pumping speeds as indicated. QMS is the quadrupole mass spectrometer and LPM is the laser power meter. The detectors are mounted perpendicular to the plane of drawing. The isotope 255 Fm was produced at ORNL in Oak Ridge, USA. Starting with the isotope 246 Cm, the isotope 255 Es was bred in the high-flux isotope reactor by successive neutron captures and decays. A sample of 1.718 ng of the isotope 255 Fm was chemically extracted and air shipped to Germany. At Mainz University an amount of 2:7 1010 255 Fm atoms was electrodeposited onto a tantalum filament and sputtered with approximately 1 m of Ti. The filament was inserted into the optical cell of the IGRIS apparatus; see Fig. 1. The fermium atoms, evaporated from the electrically heated filament, remained stored in the argon buffer gas for approximately 40 ms. This storage time is limited by the diffusion or thermal convection of the atoms from the volume illuminated by the laser in front of the filament. Nevertheless, this time was sufficiently long to enable a pulsed laser system to achieve resonance ionization. The laser system consisted of an excimer pump laser (Lambda Physik EMG 104), which runs on XeF at a wavelength of 351/353 nm with a repetition rate of 200 Hz providing 50 mJ pulses with a width of 15 ns, and a tunable dye laser (Lambda Physik FL 2002) with a spectral line width of 8 GHz. As opposed to the conventional IGISOL apparatus where the gas jet alone transports the ions out of the cell, in this cell they drift along electric field lines created by a suitable electrode system. Shortly before the ions enter the nozzle they are decoupled from the electrical field and flushed out by the gas jet. With a nozzle diameter of 1 mm and argon at a pressure of 35 mbar as a buffer gas pumps with relatively low pumping speeds can be used (TMP I–IV). Thus, the apparatus remains rather compact. With the aid of a segmented quadrupole ion guide structure [12] and skimmers, the ions are separated from the buffer gas, mass selected in a quadrupole mass spectrometer (Balzers QMG 311), and identified by a channeltron detector. In the first stage of the experiment the release temperature TFm of fermium was determined. To acquire this information the activity of the filament was monitored 163002-2 week ending 25 APRIL 2003 PHYSICA L R EVIEW LET T ERS VOLUME 90, N UMBER 16 with two surface barrier detectors (Schlumberger LEC 500-4000), each having an active area of 4:9 cm2 , located outside the optical cell. The filament current was then raised until at TFm 960 10 C a decrease in radioactivity was observed. The absolute temperature of the filament was determined with an optical pyrometer. Measurements in a dedicated high vacuum setup yielding TFm 970 30 C [13] indicate that the buffer gas has no significant influence on the release temperature. The temperature was raised in the course of the 9 h experiment to finally 1184 10 C. In order to predict suitable intermediate levels for a two-step resonance ionization spectroscopy, relativistic MCDF calculations have been carried out using the atomic structure codes described in Refs. [14,15]. Because most configuration state function (CSF) expansions increase very rapidly with the number of active orbitals, only a single correlation layer, i.e., the correlation orbitals f8s; 8p; 6d; 6f; 5gg, could be taken into account in addition to the 5f, 7s, and 7p spectroscopic orbitals. Since ab initio theory yields an even-parity 5f12 7s2 3 H e6 term for the spectroscopical ground state, only odd-parity levels with total angular momenta J 5, 6, and 7 can be excited via allowed electric dipole transitions. Five calculated levels with large transition rates Aki are listed in Table I. The efficient dyes, Exalite 389/398, allowed us to scan across a wave number range of 24 703 to 25 990 cm1 in the middle of which the two levels 2 and 3 were predicted. About 10% of the UV light from the 351/353 nm excimer pump laser was coupled into the optical cell for nonresonant ionization leading into a region not too far above the predicted IP 52 400 cm1 [16]. During the course of the 8 h scan two resonances were found at the energies 25 099:8 0:04stat 0:2syst and 25 111:8 0:04stat 0:2syst cm1 . The quoted systematic error takes into account the uncertainty of the wavelength calibration. The signals are shown in Fig. 2. To ensure these resonances belong to fermium the laser was set to the transition at 25 111:8 cm1 and a mass spectrum was recorded; see Fig. 3. Two lines 4 mass units apart can be clearly observed which, following a rough calibration of the mass filter, can be assigned to the mass TABLE I. Results of MCDF calculations. Accuracy of transition energy is 2400 cm1 , Aki Einstein coefficient, classification according to the largest coefficient c in the CSF expansion. No. (cm1 ) J Aki s1 Config. Term jcj2 1 2 3 4 5 6 0 25 226 25 471 27 394 27 633 27 802 6 6 5 6 5 7 0 1:89 106 1:28 106 2:43 108 1:98 108 3:67 108 5f12 7s2 5f12 7s7p 5f12 7s7p 5f12 7s7p 5f12 7s7p 5f12 7s7p 3 He 6 5 Io 6 5 Go 5 3 Ho 6 3 Go 5 3 o I7 0.96 0.46 0.34 0.62 0.60 0.66 163002-2 PHYSICA L R EVIEW LET T ERS VOLUME 90, N UMBER 16 300 Counts 25099.8 cm 250 ν [cm-1] 200 52400 150 -1 25111.8 cm -1 IP ν2 25100 ν1 100 0 GS 50 0 25090 25095 25100 25105 25110 25115 -1 ν1 [cm ] FIG. 2. Wave number scan of the dye laser at 1 7:9 1014 photons=cm2 pulse for mass number A 255. The excimer photon number flux was 6:5 1015 photons=cm2 pulse. The full line shows the best fit of the power broadened line profile to the data. numbers 251 and 255. The hypothesis was that the line at A 255 can be attributed to 255 Fm while that one at A 251 to 251 Cf, the continuously produced decay daughter of fermium with the low release temperature of 730 C [13]. Since the half-life of the latter is 898 yr at the beginning of the experiment the atomic number ratio of Cf to Fm was 100:1. The continuous presence of 251 Cf in the buffer gas was verified by resonance ionization of Cf via the known intermediate level at 26 408:31 cm1 [17]. At the same time this result enabled a precision mass calibration of the quadrupole mass filter to be carried out. Thereafter, the dye laser was tuned off resonant to 25 105 cm1 and the mass filter was scanned from mass number 200 to 270. In the mass spectrum only the peak at A 251 was recorded with unchanged intensity. The fact that the count rate does not depend on the wavelength of the dye laser strongly suggests that the peak at A 251 is due to a two-photon ionization process of 251 Cf with two excimer laser photons. Indeed, the spectral distribution of the excimer laser [18] enables also a resonant excitation via the Cf level at 28 308:60 cm1 [17]. The same arguments also hold for the other 255 Fm transition at 250 255 Fm + Counts 200 150 251 100 Cf + 50 0 200 210 220 230 240 250 260 270 Mass [u] FIG. 3. Mass spectrum of the atoms ionized at fixed dye laser wave number of 25 111:8 cm1 . 163002-3 week ending 25 APRIL 2003 25 099:8 cm1 ; thus both transitions shown in Fig. 2 belong to an isotope with a mass number of A 255. Based on the production of the sample we can be dealing only with the elements Fm, Es, and Cf or a molecular ion. The isotope 255 Cf with a half-life of only 2.5 h would have decayed at the time of the measurement and can thus be eliminated on these grounds alone. Molecular ions can be clearly distinguished from atoms in the time spectra, with the laser pulse acting as a start signal and the channeltron pulse as a stop signal. Molecular ions have larger radii than atoms and therefore a lower ionic mobility in the buffer gas resulting in a significant increase in the drift time [19]. Based on and -spectroscopical measurements of the sample at ORNL an atomic number ratio N255 Es =N255 Fm < 0:28 has been calculated at the time of the experiment. The release of Fm from the filament was monitored as function of time. It was found that the decrease of the Fm activity was proportional to the resonance count rate in the channeltron detector. This fact suggests strongly that the detected element was Fm. The Cf count rate, however, showed a significantly different trend as expected from its lower release temperature. Since Es has an even lower release temperature of TEs 650 30 C [13] it can be excluded that the observed transitions belong to Es. Consequently, the optical transitions illustrated in Fig. 2 belong to the element fermium. Some insight into the structure of the levels can be obtained from the partial transition rates Aki for the decay into the ground state. By varying the photon flux of the first laser excitation the saturation characteristic was measured for both transitions; see Fig. 4. A model was developed by us describing the saturation characteristics as well as the line shape. It is based on the optical Bloch equations; see, e.g., Ref. [20]. Because of rapid phase fluctuations in buffer gas collisions and within the laser wave train Rabi oscillations are absent in our experiment. Therefore, steady state solutions could be used for the off-diagonal density matrix elements with which the rate equations for the diagonal elements were solved. A best fit of the model to the saturation characteristics and the power broadened line profiles at two different photon fluxes, see Fig. 4, yields Aki 3:4 0:8 106 s1 for the transition at 1 25 099:8 cm1 , and Aki 3:5 0:7 106 s1 for the transition at 1 25 111:8 cm1 . Let us compare the experimental results with the MCDF calculations. For the levels 2 and 3 in Table I, both the calculated level energies and the transition rates are in very good agreement with the experimental observations. A better agreement between the calculated finestructure splitting of 245 cm1 with the observed one of 12 cm1 cannot be expected, as the atomic levels with different total angular momenta had to be obtained independently in the relativistic computations. Even a reversal of the level order cannot be excluded. It is rather unlikely that levels 4, 5, or 6 were observed. Even though 163002-3 PHYSICA L R EVIEW LET T ERS VOLUME 90, N UMBER 16 1.2 0.8 3 0.6 N(ν1)/100 4 2 3 N(ν1)/100 N(φ1)/N(φ1 max) 1.0 0.4 2 1 1 0.2 0 25111 0 25112 25111 -1 0 2 14 25112 -1 ν1 [cm ] 0.0 ν1 [cm ] 4 6 2 8 φ1 [10 photons/(cm pulse)] FIG. 4. Saturation characteristic of the optical transition at 1 25 111:8 cm1 . Shown is the measured ion number N1 at mass A 255 as a function of the photon flux 1 of the first excitation step normalized at 1 max . The full lines show best fits of model calculations to the data from which the partial transition rate Aki can be inferred. Insets: line shapes at fluxes of 0:5 1014 and 7:9 1014 photons=cm2 pulse, as indicated. the energy of level 4 agrees within the estimated uncertainty with the observed levels, the transition rates are off by 2 orders of magnitude. This situation led, in contrast to a preliminary communication [19], to assigning the two observed transitions to the calculated levels 2 and 3. This assignment is supported by the observed reduced transition rates to the 3 He6 ground state, as expected for an intercombination transition. Finally, an upper limit for the ionization potential of Fm can be estimated from the condition 1 2 th IP. With 1 25 100 cm1 , 2 28 490 cm1 , and the thermal energy of the buffer gas atoms th 660 cm1 that is transferrable in collisions, an IP 54 250 cm1 ^ 6:7 eV is obtained. This value is in accord with predictions of IP 52 400 cm1 ^ 6:5 eV [16]. In principle, a measurement of the drift time of the ions in the optical cell (in our experiment being in the order of 1 ms) enables a determination of the ionic mobility [19] and may open up new avenues in studies of relativistic effects on ionic radii and the bond lengths of simple molecular ions [21,22]. In conclusion, for the element fermium, Z 100, for which atomic information was not previously available, atomic levels have been predicted by MCDF calculations. Two levels have been found by the method of two-step resonance ionization spectroscopy. Partial lifetimes were determined from the saturation characteristics and term assignments are proposed. The agreement between experiment and calculations is striking. A search for the three predicted levels around 27 400 cm1 and the determination of the IP could not be pursued further in this 163002-4 week ending 25 APRIL 2003 work because of the small number of Fm atoms available for this experiment. We thank C. E. Porter, F. D. Riley, Jr., R. D. Vandergriff, L. K. Felker, and J. B. Knaure, Jr. at the R.E.D.C. facility, ORNL, for their efforts in separating and processing the Fm isotope from the target products. We are indebted to the Division of Chemical Sciences, Office of Basic Energy Research, U.S. Department of Energy, for making the 255 Fm material available through the transplutonium element production program at ORNL. We acknowledge the hospitality of the Max-Planck-Institut fu¨ r Kernphysik, Heidelberg. This work has been supported by the Bundesministerium fu¨ r Bildung und Forschung under Contract No. 06 MZ 959I. [1] S. Hofmann and G. Mu¨nzenberg, Rev. Mod. Phys. 72, 733 (2000). [2] M. Scha¨del, Radiochim. Acta 89, 721 (2001). [3] A. Tu¨rler, Radiochim. Acta 72, 7 (1996). [4] Ch. E. Du¨llmann et al., Nature (London) 418, 859 (2002). [5] B. Fricke, E. Johnson, and G. M. Rivera, Radiochim. Acta 62, 17 (1993). [6] E. Eliav, U. Kaldor, and Y. Ishikawa, Phys. Rev. Lett. 74, 1079 (1995). [7] W. C. Martin and J. Sugar, Phys. Rev. A 53, 1911 (1996). [8] H. Backe, M. Hies, H. Kunz, W. Lauth, O. Curtze, P. Schwamb, M. Sewtz, W. Theobald, R. Zahn, K. Eberhardt, N. Trautmann, D. Habs, R. Repnow, and B. Fricke, Phys. Rev. Lett. 80, 920 (1998). [9] H. Backe, K. Eberhardt, R. Feldmann, M. Hies, H. Kunz, W. Lauth, R. Martin, H. Scho¨pe, P. Schwamb, M. Sewtz, P. Tho¨rle, N. Trautmann, and S. Zauner, Nucl. Instrum. Methods Phys. Res., Sect. B 126, 406 (1997). ¨ rje, J. A ¨ ysto¨, J. Taskinen, J. Honkanen, and K. Valli, [10] J. A Nucl. Instrum. Methods Phys. Res., Sect. B 26, 384 (1987). [11] A. Iivonen, R. Saintola, and K. Valli, Phys. Scr. 42, 133 (1990). [12] M. Sewtz, Diplomarbeit, Universita¨t Mainz, 1997. [13] C. Gru¨ning, K. Eberhardt, G. Huber, J. Lassen, J.V. Kratz, P. Kunz, M. Nunnemann, G. Passler, and N. Trautmann, Institute for Nuclear Chemistry of the University of Mainz Annual Report (Jahresbericht) No. 2002-1, 2001. [14] F. A. Parpia, C. Froese Fischer, and I. P. Grant, Comput. Phys. Commun. 94, 249 (1996). [15] S. Fritzsche, J. Electron Spectrosc. Relat. Phenom. 114 – 116, 1155 (2001). [16] J. Sugar, J. Chem. Phys. 60, 4103 (1974). [17] J. G. Conway, E. F. Worden, and J. Blaise, J. Opt. Soc. Am. B 12, 1186 (1995). [18] M. Hies, Dissertation, Universita¨t Mainz, 1993. [19] H. Backe et al., J. Nucl. Sci. Technol., Suppl. 3, 86 (2002). [20] R. Loudon, The Quantum Theorie of Light (Oxford University Press, Oxford, 1983). [21] P. Pyykko¨ , Chem. Rev. 88, 563 (1988). [22] J. P. Desclaux, At. Data Nucl. Data Tables 12, 311 (1973). 163002-4
© Copyright 2026 ExpyDoc