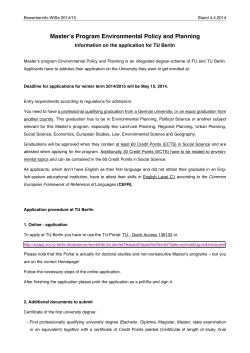
Limits of Control
Challenges to Spatiotemporal Analysis of Sub-State War
Christian Ickler
SFB-Governance Working Paper Series • No. 66 • November 2014
DFG Sonderforschungsbereich 700 Governance in Räumen begrenzter Staatlichkeit - Neue Formen des Regierens?
DFG Collaborative Research Center (SFB) 700 Governance in Areas of Limited Statehood - New Modes of Governance?
SFB-Governance Working Paper Series
Edited by the Collaborative Research Center (SFB) 700 “Governance In Areas of Limited Statehood - New Modes of Governance?”
The SFB-Governance Working Paper Series serves to disseminate the research results of work in progress prior to publication
to encourage the exchange of ideas and academic debate. Inclusion of a paper in the Working Paper Series should not limit
publication in any other venue. Copyright remains with the authors.
Copyright for this issue: Christian Ickler
Editorial assistance and production: Julian Schreiber, Amy Patton
All SFB-Governance Working Papers can be downloaded free of charge from www.sfb-governance.de/en/publikationen or
ordered in print via e-mail to [email protected].
Christian Ickler 2014: Limits of Control. Challenges to Spatiotemporal Analysis of Sub-State War, SFB-Governance Working
Paper Series, No. 66, Collaborative Research Center (SFB) 700, Berlin, November 2014.
ISSN 1864-1024 (Internet)
ISSN 1863-6896 (Print)
This publication has been funded by the German Research Foundation (DFG).
DFG Collaborative Research Center (SFB) 700
Freie Universität Berlin
Alfried-Krupp-Haus Berlin
Binger Straße 40
14197 Berlin
Germany
Phone: +49-30-838 58502
Fax: +49-30-838 58540
E-mail: [email protected]
Web: www.sfb-governance.de/en
SFB-Governance Working Paper Series • No. 66 • November 2014 | 3
Limits of Control: Challenges to Spatiotemporal Analysis of Sub-State War
Christian Ickler
Abstract:
Territorial control by violent (non-)state actors (VNSA) in sub-state war features prominently
in many fundamental concepts in conflict studies. Though there have been attempts to
measure this phenomenon or at least delimit it from a spatiotemporal perspective, these
have so far been based either primarily on qualitative expert assessments or rely on dyadic
event data to determine contested areas. In this methodological research paper, I present
three approaches that can be used to estimate actor presence on basis of spatiotemporal
approximation. In doing so, I focus on challenges and obstacles that can be encountered
when measuring territorial control via the proxy of territorial contestation. Spatiotemporally
disaggregated violent incidence data is used to analyze a small subsample of countries in subSaharan Africa in order to determine various ways of visualizing territorial contest. Further
points of discussion include the impact of data aggregation, the availability of context data
and analytical methods used for these evaluations.
Zusammenfassung:
Territoriale Gewaltkontrolle durch (nicht-)staatliche Gewaltakteure ist Gegenstand einer
großen Zahl grundlegender Konzepte der Konfliktforschung. Es existieren bereits erste
Ansätze dieses Phänomen zu messen und raumzeitlich einzugrenzen, jedoch beruhen diese
Messungen bislang entweder auf qualitativen Einschätzungen von Experten oder – im Zuge
der zunehmenden Verfügbarkeit raumzeitlich desaggregierter Daten von Gewaltereignissen
– der Bestimmung umkämpfter Areale auf Grundlage bewaffneter Auseinandersetzungen. Im
vorliegenden Papier werden drei Ansätze zur näherungsweisen Bestimmung der Präsenz von
Gewaltakteuren vorgestellt. Dabei wird auftretenden Hindernissen und Herausforderungen
der Messung territorialer Gebietskontrolle durch den Einsatz von Informationen über den
territorialen Wettbewerb begegnet. Hierzu werden raumzeitlich desaggregierte Ereignisdaten
ausgewählter Untersuchungsländer in Sub-Sahara Afrika exemplarisch genutzt, um die
Möglichkeiten der Visualisierung territorialen Wettbewerbs unter Gewaltakteuren und dem
Einfluss der Auflösung der Daten nachzugehen. Darüber hinaus wird die Verfügbarkeit von
gleichfalls raumzeitlich desaggregierten Kontextdaten und entsprechenden Analyseverfahren
diskutiert.
Limits of Control: Challenges to Spatiotemporal Analysis of Sub-State War | 4
Table of Content
1. Introduction
5
2. The Contestation of Territorial Control
8
3. Exploring the Contestation of Control
10
4. Limits of Disaggregation
15
5. Explanative Spatiotemporal Analysis
20
6. Concluding Remarks
22
7. Literature
24
SFB-Governance Working Paper Series • No. 66 • November 2014 | 5
1. Introduction
In Somalia, a decades-long civil war between multiple factions has claimed countless casualties
and caused a great deal of internal displacement. A second look, however, suggests that the
violence1 is not spreading throughout the entire country, but has been concentrated in locations
of presumably higher (strategic) “value” such as large agglomerations, the coastline, and the
border region. The lower Shebelle region and Mogadishu, the former capital, have seen the
largest share of violence (see Fig. 1, next page).
Though there are a multitude of plausible reasons for this variance, most conflict studies base
their explanations on the level of contestation between armed groups and that of territorial
control. From a spatial-geographic perspective, the theoretical interpretations of these two
aspects can be summarized as follows: The higher the level of territorial control, the lower the
level of contestation towards the center of control (e. g. Buhaug 2010; Hultman 2008; Kalyvas
2006). Thus Somalia serves as a good example of variations not only in violence, but also
contestation and territorial control.
1 Violence is defined as the intentional use of material, physical force on a person by an individual or
collective, which ultimately leads to the death of that person. Thus only lethal incidences have been
taken into account. This definition excludes structural (Galtung 1969) and cultural/symbolic violence
(Bourdieu/Passeron 1973; Galtung 1990). For psychological (e. g. deprivation), sexual, verbal and
emotional violence, see Gudehus/Christ (2013). The scope of violent incidences ranges from criminal
to armed clashes, and is used as proxy indicator of the local characteristics of war.
Limits of Control: Challenges to Spatiotemporal Analysis of Sub-State War | 6
Figure 1: Violence in Somalia 1990-2010 based on EDACS (Event Data on Armed Conflict
and Security) (Chojnacki et al. 2012b). 2
Despite its key significance, there is currently no available information on the level of control.
Figure 1 – a visualization based on spatial disaggregated conflict event data – shows only hotspots
2 Violence in Somalia is concentrated in the central and southern provinces, the coastal region and
especially close to the capital Mogadishu. Violence tends to occur in proximity to urban areas.
Rudiments of a “quasi” inter-state war (Menkhaus 2006) have erupted in the northern region between
the quasi-states Puntland and Somaliland, which Figure 1 highlights as a “disputed area”. This should
not, however, be misinterpreted or give the false impression that most parts of Somalia were not
“disputed”.
SFB-Governance Working Paper Series • No. 66 • November 2014 | 7
of violence. Nevertheless, it is difficult to draw conclusions about territorial control from point
data that, if anything, marks the contestation of control.
This paper begins with a brief overview of why this issue is of interest in conflict studies and
a discussion of the prevalent arguments based on explanatory approaches to investigating this
topic.3 This is followed by a discussion of various ways to measure territorial contest between
VNSAs by making spatiotemporal actor presence visible on a sub-state level. I also discuss
whether this information can be used to gain insight into armed actors’ dominance in space
over time. Third, I turn to the disaggregation of context data, because the available level of
geographical and temporal resolution of contextual data provides the accuracy of quantitative
analysis linking violent incidences to their structural background. Finally, I test the data on
basis of a spatiotemporal regression analysis and provide an outlook of future challenges.
This paper comes with a number of austerities that will be named in the following. First, the
conducted analysis does not claim to be profound, nor can the findings be generalized. This
second limitation is rooted in the small number of countries that serve as case studies in this
analysis, namely Somalia and Sierra Leone. These countries were selected because armed nonstate actors play a significant role in the conflict dynamics and data is readily available.4 Moreover,
Somalia – in contrast to Sierra Leone – represents a case with a complex actor constellation that
is not overlaid by “strong” state actors. Thus these two countries offer different conflict settings,
with each respectively fitting into different methodological approaches. The second restriction
to the scope of this paper comes from focusing exclusively on violent non-state actors (VNSA)5
in sub-state war6 and the limited range of contextual causal variables used, due to the fact that
the presented results are intended only as examples of the basic principles.
The following pages trace and summarize the conceptual background of territorial control
and contestation between armed groups. These assumptions are then contrasted with possible
methodological approaches to approximately measure territorial control proxied by territorial
contest. Finally, these measurements are evaluated with regard to applicability by concentrating
on available structural data and the analytical tools at hand. In closing, this work-in-progress
paper discusses future challenges.
3 Territorial control and contestation are investigated, for instance, in Political Geography or by the
International Relations (e. g. Huth 1998). Within territorial control lies a tied coupling of statehood
and sovereignty (Paasi 2003: 113pp.) it is generally utilized to bind space and power together (Agnew
2000). Its significance is therefore also recognized on the sub-state level (McColl 1969).
4 The analyses are based on the Event Data on Armed Conflict and Security (EDACS) dataset.
5 The term violent non-state actors (VNSA) refers to persons, organizations or armed groups that
use violence against the monopoly of the state or other non-state actors in an effort to fulfill their
objectives. Their motives can be materialistic, political, ideological, religious, or a mixture of these
motivations (Chojnacki 2004). Examples of VNSA include mercenaries, rebels or warlords.
6 For the definition of sub-state war, I follow Chojnacki (2004: 203). It can thus be understood as an
organized, persistent form of collective violence on an inner- or sub-state level between state and
nonstate actors within or beyond the administrative borders of a nation-state.
Limits of Control: Challenges to Spatiotemporal Analysis of Sub-State War | 8
2. The Contestation of Territorial Control
“War is not all the terror all the time, all over the place” (Korf et al. 2010: 386). In light of this
characteristic of war, the core question of geographically disaggregated conflict research can
be framed as follows: What causes the variance of violence – of persistent hotspots of violence
on the one hand and the temporal absence of violence on the other? One possible cause of this
variance can be the extent of territorial control by violent (non-)state actors (VNSA).7
A major aim of armed actors, whether state or non-state, is territorial control.8 For many VNSAs,
successfully gaining territorial control is a crucial step in achieving their aims, as territorial
control implies control over resources, infrastructure, locations of political- or socio-geographic
importance, et cetera. At the same time, armed actors are heavily dependent on the cooperation
and control of the civilian population. Controlling deserted space is only of interest if the area
harbors resources or has some other strategic or symbolic “value”. Nevertheless, civilians are
key to successful warfare and war economy. Control of the population can be used to legitimize
leadership claims and gain political power (e. g. Elwert 1997; Kongsgård 2010).
All of these factors also vary depending on the relative/perceived “value” of a territory and
thus the level of territoriality put forward by the armed actors. The actor’s military capacity,
actor constellation and conflict dynamics can raise or lower that relative “value” over time. As
a consequence, the level of violence – mutual or one-sided violence against civilians – varies
distinctly. Assuming the territory is of some strategic “value”, territorial control is a central part
of many theoretical assumptions in conflict studies, though these mostly concentrate on the
inherent, strategic function of violence.
Nonetheless, conflict dynamics and the strategic “value” of a location are not apparent in all
circumstances. In instances of one-sided violence against the civilian population, the strategic
“value” of a location is no longer the major explanation for violence at that specific place. In
such cases, diverse ethnic/ethno-linguistic affiliations,9 socio-economic interdependencies and
the political objective held by armed groups (or their need for legitimacy) can become more
relevant.
Conflict studies have identified a set of at least four distinct (possibly concurrent) strategic
drivers of territorial control on a sub-state level: the interaction between armed groups and
the civilian population (ranging from control to ethnic cleansing and vengeance), competitive
resource allocation (to extract, produce, and mobilize assets), procuring a military advantage
7 Other relevant predictors – including the effect of terrain, state actors, external constraints, different
distribution of target resources et cetera – go beyond the scope of this working paper and have been
intentionally left out.
8 Exceptions to this include terrorists and criminal organizations, which do not depend primarily on
territorial control (though they may welcome it), such as, for instance, the militant Islamist group
Ansar Dine in northern Mali in 2012 (BBC 2013).
9 The transition from civil war violence to ethnic conflict does, however, become blurred at this point
(see Kaufman 1996).
SFB-Governance Working Paper Series • No. 66 • November 2014 | 9
(over specific locations and infrastructure), and objectives related to legitimization (regarding
secession, concessions, or the symbolic nature of the territory). These functions are interwoven
and, to a certain extent, derive from the first driver, as different forms of interaction are the basis
for resource allocation, military confrontation within populated areas, and the legitimization of
one’s own rule.
Explanations for the strategic use of one-sided violence against the civilian population focus
on different forms of interaction between armed actors, their opponents and civilians. Despite
the link between these forms of interaction, there should be a clear differentiation between
(indirect) armed contestation and terrorizing the local population. The aim to control and, if
necessary, to punish perceived infractions by the population depends on the VNSA’s ability
to project power within geographic zones of (temporal) territorial control (Boulding 1962;
Buhaug 2010; Kalyvas 2006) or to selectively target population which is assumed to support the
adversary (Balcells 2010; Kalyvas 2006). Wood (2010: 604), on the other hand, asserts that armed
groups abstain from targeting civilians if they are able to provide security and control territory.
Another strategic, interaction function of one-sided violence concentrates on killing civilians
as a means of communication between armed groups. Defeat in battle (Ziemke 2008) or the loss
of territory can be compensated by raising costs for governments (or local armed actors) or by
targeting civilians and thereby undermining the population’s support and trust towards the
opponent (Hultman 2007: 210).
Controlling civilians can also be a way of extracting resources (Azam/Hoeffler 2002). The “value”
of a territory determines whether or not armed actors are willing to invest in its occupation and
defense. The defensive strength and further deployment of troops lowers the potential desire
of other armed actors to attack the territory. This investment in measures of deterrence could,
however, tempt adversaries to attack elsewhere (Powell 2008: 1). The nature of the territory and
resources at hand are decisive for the intensity of violence that can be expected (Ross 2004).
In contrast to remote, rural areas or areas of low (strategic) “value”. small geographic areas of
relatively high “value” can lead to an intensified competition between the armed actors fighting
to gain the territorial control (Skaperdas 2002: 438). Examples include, for instance, urban
agglomerations, which inherently have a high population density and thus a higher GDP per
capita. This is associated with local conflict escalation, while the economically-driven goal to
increase market shares motivates armed groups to redouble their organizational capacities and
to invest in territorial control. This second process is systematically linked to a decrease in onesided violence and the defeat of potential rivals (Branovic/Chojnacki 2011).10
Besides the aforementioned interaction/control function and allocative/exploitive drivers –
which can overlap if the purpose of the resource allocation is not limited to raiding and looting
– territorial control is of course also important when it comes to gaining military leverage.
It is essential that armed actors have a safe haven and a base for preparing planned/ongoing
10 Additional factors include many more aspects such as the lootability of resources (see e. g. Humphreys
2005) and the specific actor constellation. These should be taken into consideration when evaluating
the “value” of a specific location and determining the nature of the inherent conflict dynamics.
Limits of Control: Challenges to Spatiotemporal Analysis of Sub-State War | 10
operations. Armed actors’ perception of the (actual) conflict situation is also significant, as
territorial setbacks (Hultman 2007) or the proximity of the armed actors’ headquarters (Buhaug
2010) and other strategically important sites (e. g. infrastructure, administrative centers, …) can
stir local conflict escalation.
Finally, territorial control is the basis upon which armed actors gain legitimacy and acceptance
by third parties; this can be the primary goal in secessionist conflicts, at least initially. All of these
strategic functions (and perhaps others not mentioned here) are interlinked with territorial
contest and control by armed actors. Factors that (in-)directly affect the armed actors and thus
their ability to consolidate their local regime are manifold. The complexity of these driving
factors is not discussed in this paper. For more details, see Bakke et al. (2012), Branovic and
Chojnacki (2011), Cunningham et al. (2012), Fjelde and Hultman (2013), Fjelde and Nilsson (2012),
Kalyvas (2006), Mampilly (2011), Pearlman and Cunningham (2012).
3. Exploring the Contestation of Control
Displaying territorial control is first of all tied to the analyst’s ability to display territorial
contest, which delimits the outer boundary of controlled areas. This option has recently become
a possibility with the proliferation of reliable, spatially and temporally disaggregated event
data on violent incidences in the context of intra-state war. There is, however, a distinction
between displaying territorial control and delimitative proxy territorial contest. It takes another
conceptual leap, and sometimes a lot of imagination, to gain an approximate measure of
territorial control, if any.
Some datasets, like the Armed Conflict Location & Event Data Project (ACLED) (Raleigh et
al. 2010) or the Social, Political and Economic Event Database (SPEED) Project (Nardulli et al.
2011) also code non-lethal violence or even information concerning the location and timing
of rebel base establishment or the capturing of a town. But this additional information comes
with a slight caveat, namely the sometimes deteriorated data quality and biases due to the
lack of reliable, consistent news coverage of non-lethal events, usually on account of their low
newsworthiness (for a discussion see e. g. Barranco/Wisler 1999; Chojnacki et al. 2012b; Eck
2012; Öberg/Sollenberg 2011).
The Event Data on Armed Conflict and Security (EDACS) coding criterion controls for many
inconsistencies and sources of bias, which can lead to fake trends and propagating errors (see
Chojnacki et al. 2012b) as does the UCDP Georeferencing and Event Dataset (UCDP-GED)
(Melander/Sundberg 2011). This paper uses EDACS data, as the small number of case countries
is irrelevant. Both the data quality and consistency of the EDACS dataset and its country sample
are well-suited to testing the methodological approaches outlined in this paper.
EDACS is comprised of seven countries (among them Burundi, the Democratic Republic of
the Congo, Liberia, the Republic of Congo, Rwanda, Sierra Leone and Somalia) from 1990 to
2010. Two countries in the EDACS sample (namely Somalia and Sierra Leone) are particularly
SFB-Governance Working Paper Series • No. 66 • November 2014 | 11
pertinent here for several reasons: First, violence is persistently carried out between multiple
factions. Second – and this is especially true for Somalia – the governmental forces do not
preponderate the conflict dynamics. Their impact on local conflict dynamics is comparatively
marginal relative to the non-state contest. In other countries, regional patterns tend to be
superimposed by the state, which often serves as point of reference for competing armed actors.
EDACS differentiates between different types of violence, ranging from mutual violence to
several kinds of one-sided violence. An EDACS event is defined as a “violent incident at a specific
location and a specific time with at least one fatality resulting from the direct use of armed
force” (Chojnacki et al. 2012a: 3).11 The focus is on the reliability and accuracy of the coded event
data, which is why every violent event is coded by two different coders. The coded information
is based on reliable international news sources such as BBC Monitoring, the New York Times
and others. The following section briefly describes several approaches that might help with the
task of identifying territorial control, as soon as they are evaluated and automated.
First, armed conflict can be thought of as space-time-clusters. In addition, dominance by one or
several armed actors within these clusters can be regarded as a form of temporary control. The
sequential succession of the dyadic violent incidences between two armed actors can be used to
identify the dominant actors. These show which actor was attacked by assorted opponents and
was therefore most likely present in that cluster in the time window between the events.12 The
left side of Figure 2 shows fuzzy spatial clusters13 of violent events; the right panel shows violent
events that belong to the same temporal clusters. Combined, these events can be grouped
as spatial-temporal clusters. This cluster approach can be particularly helpful in detecting
diffusional processes and identifying regions that are notably of high (strategic) value (see e. g.
Buhaug/Gleditsch 2008; O’Loughlin et al. 2010; Schutte/Weidmann 2011).
11The EDACS “dataset contains detailed information on 1) dates, intensity and type of military action,
2) actors and targets and 3) the geographic location” of violent incidences (Chojnacki et al. 2012a: 3).
For further details on the EDACS coding process, see Chojnacki et al. (2012b) and the project website
www.conflict-data.org.
12Alternatives to this stepwise clustering approach include, for instance, scan statistics (Kulldorff/
Information Management Services Inc. 2009) or spatiotemporal hotspots in ArcGIS 10.X (ESRI 2011),
though results are rather meager due to the fact that space-time cluster radiuses are heavily skewed by
geographic outliers and cluster construction cannot be easily automated, especially with the help of
SaTScan.
13Clustering is generally based on membership to a specific group of entities with similar attributes,
in this case event coordinates and event dates. The closeness of events in time and space is assumed
to be random. This is called complete spatiotemporal randomness (CSTR). Deviations from this
random distribution indicate clustering. The interpretation that can be drawn from this “closeness”
is that events that are closer in time or space have more in common than events that are further away
from each other (Tobler 1970), and can therefore be grouped. C-means fuzzy clustering (Bezdek 1981),
the method used here, is an unsupervised divisive clustering method. Once the analyst chooses the
number of clusters, an algorithm determines the most likely cluster centers and evaluates the distance
of each object to each center. It is an extension of K-means clustering (MacQueen 1967). “Fuzzy” refers
to the fact that it does not assign events to a definite group, but uses weights of relative membership
for each event.
Limits of Control: Challenges to Spatiotemporal Analysis of Sub-State War | 12
Figure 2: Spatial (left) and temporal (right) clusters in Somalia 1990-2009 (based on EDACS
event data).
Figure 3 shows two options for visualizing territoriality. On the left, you see the operating range
of the major armed actors in central Somalia in the years 2008 to 2009. The operating range
is based on the first, standard deviation of the geographic range where violent events with one
of the major armed actors take place. It represents an equivalent to the gravitational field of
actor-specific actions within the time window under study. The right map shows dyadic conflict
polygons for an analog space-time window. They are similar to the UCDP conflict sites (Croicu/
Sundberg 2012).14
Figure 3: Operational range and dyadic conflict setting of major armed actors in south
central Somalia 2008-2009 (based on EDACS event data). 15
14The UCDP conflict sites (Croicu/Sundberg 2012) also differentiate geographic areas, which are formed
on basis of dyadic violence between armed actors.
15In both maps, it becomes obvious that at that time, al-Shabaab militias dominated the lower Shebelle
region and the area around Mogadishu. Shortly after this time frame, they allied with Hizb al-Islam,
whose operational range matches that of al-Shabaab.
SFB-Governance Working Paper Series • No. 66 • November 2014 | 13
Both visualizations show which areas are highly contested. In the map on the left, the
overlapping of operational ranges gives us a hint of who contested who. The same is true for
the overlapping of the conflict polygons in the map on the right. They also show which actor
was dominant and persistently active in a region and how the frontlines between opponents
change over time. These maps allow us to draw conclusions about the actors’ military capacity
and mobility (e. g. Boulding 1962; Buhaug 2010; Buhaug/Gates 2002; Gent 2011; O’Loughlin et
al. 2010). Yet these two approaches only allow us to measure territorial contestation. They do
not provide information about territorial control as pacification or alliance building between
formerly fighting actors, or the withdrawal of one side for various reasons. Furthermore, this
approach is only applicable in complex actor constellations with more than two actors.
In complex actor constellations, statements about actor specific presence can become blurred
or even indistinguishable depending on the bustle of the course of the conflict. In dyadic or less
complex actor constellations, it is easier to draw conclusions about the direction of operations,
and a more precise attribution of actions by actors is easier to come by. In light of this, we turn
to a better-suited sample, the less complex case of Sierra Leone, where it was primarily the
Revolutionary United Front (RUF) fighting the government.
The third solution presented here provides a more actor-specific spatiotemporal visualization
of contestation. It is based on creating cone-sections that mirror the spatiotemporal trending
of dyads. The cone-sections can help identify the small but distinct spatial sections, which
– provided the geocoding of the event data is accurate – are presumably under control by a
specific armed actor shortly before the event takes place. This distinguishes it from the type of
information provided by UCDP conflict sites, which only show multiple overlapping areas of
dyadic contest (cf. right map in Fig. 3).
Figure 4: Illustration of the “cone-cutting-technique”.
Limits of Control: Challenges to Spatiotemporal Analysis of Sub-State War | 14
Figure 4 illustrates how the cones are generated. The “cone-cutting technique” builds on buffers16
placed around dyadic violent events that are attributed to specific dyads between armed actors.
These events are labeled t1 to t4, numbered according to their chronological order. The buffers
are split using stationary lines that are drawn perpendicular to a trend line (central arrow) of
the specific dyad and split again on basis of the connected way the dyad successively takes
through space (dashed lines).17 Using this method, sections of the cones can be attributed for the
time-window between two events to a certain armed actor. One-sided violent events committed
by one of the actors within the range of the buffers can help adjust its radius and check for
inconsistencies.18
Figure 5: Cones of dyadic trending in the eastern part of Sierra Leone exemplified for the
dyad: Revolutionary United Front (RUF) versus the government of Sierra Leone in 1995
(based on EDACS event data).
16The size of the buffers is based primarily on the geo-precision of the EDACS data, which in many
cases is around 25 km, due to the accuracy of the gazetteer data (NGA 2011) employed in the process of
geocoding (see Chojnacki et al. 2012a). Another argument for adjusting the buffer can be made based
upon e. g. the military capacity and local transport infrastructure, allowing for multi-local operations
and the time necessary to deploy troops.
17The plane angle of the cone-sections is constructed on the one hand via the chronological movement
of the dyad in space, and on the other hand narrowed down by the overall trending of the armed
contest.
18EDACS data codes the “active” side in an event, provided respective information is available and
reliable. But this is not always the case, which is why this additional information can only be used as
an accessory.
SFB-Governance Working Paper Series • No. 66 • November 2014 | 15
Figure 5 shows the resulting cone sections, with the example here illustrating the dyad
Revolutionary United Front (RUF) versus the government of Sierra Leone. Combined with
additional data on one-sided violence, one sees that the RUF is committing mostly one-sided
violence near and within the areas attributed to them. It becomes obvious how the dyad is
moving southwards over time, concentrating around the district capital of Bo. This trend
coincides with and is followed by crucial developments in the Sierra Leone Civil War. South
African mercenaries and Executive Outcomes (EO) entered the war after the RUF seized control
over resource-rich areas in the south west of Sierra Leone in the beginning of 1995 (Hsiao et al.
2002). Combined forces of mercenaries, Kamajor militia and government forces drove back the
RUF, recapturing RUF strongholds such as Bo. This ultimately led to the defeat of the RUF and
the signing of the Abidjan Peace Accord in 1996 (Korniotis 2007).
The construction of dyadic trending cones has yet to be automated and thus remains a time
and labor-intensive endeavor. Though the level of empirically-saturated research findings
has been rather meager to date, there are a number of imaginable applications for these actor
specific-insights on movement-based presence. Again, reflections concerning the impact of the
diffusion of violence and the military capacity (see above) seem to be the most prominent link
to existing research here. Beyond that, qualitative reports on armed actors can be empirically
boosted by this information. Although disaggregated conflict event data is helpful in showing
the use of deadly force and allows us to measure contest, it sheds little light on actual territorial
control. In order to gain further insight, we would need additional information that would
allow us to classify these measurements.
4. Limits of Disaggregation
Approximate information about dyadic local onset, i.e. the where and when of actors contesting
each other’s territorial control, is of limited use. Additional context information is needed to
better understand these exploratory findings (e. g. data on the civilian population, the location
of lootable resources, or the economic prosperity of an area). This would, for example, allow us
to identify prosperous areas with no fighting and use this as a proxy for pacification in areas
presumably controlled by one party. Yet the available context data is rather rough or missing
altogether, which brings us to our next step: looking at possible ways to gain spatiotemporally
disaggregated context data.
The problem is twofold: first, creating sufficient data for analysis, and second integrating the
data without introducing measurement errors or biases. Before we come to the data-generating
methods (especially as a way of coping with missing data) we will discuss caveats and problems
associated with data aggregation in general. The question of whether or not the variance of the
phenomena under study is linked to the data-generating process or the level of aggregation is
not entirely new. Although ecology and geography have dealt with this particular problem of
Limits of Control: Challenges to Spatiotemporal Analysis of Sub-State War | 16
a so-called ecological fallacy19 for decades (Lennon 2000), no best practice solutions have been
found – only advice as to what not to do.
One basic problem is how spatiotemporal data in general can be joined and aggregated20
without changing the resolution and attributes of the phenomena. Taking the monthly average
of the fatality count in order to proxy the conflict intensity will obscure the actual intensity of
war on a daily basis. A hundred casualties on one day equal 25 casualties on four days, which
no longer reflects the reality. In a different spatial domain (e. g. when transferring point event
data into raster-cells or administrative units) the inherent geo-information can be drastically
reduced and as a consequence topological relations become distorted or even lost altogether.
Gotway and Young note:
“changing the support of a variable […] creates a new variable [which] is related
to the original, but has different statistical and spatial properties” and “how the
spatial variation in one variable associated with a given support relates to that
of the other variable with a different support is the change of support problem”
(Gotway/Young 2002: 634).
This unintended change to the basis of the analysis is too often done without acknowledging
the consequences and propagating biases, which can make meaningful interpretation of results
virtually impossible. Common “solutions” to this problem include choosing the smallest
common factor or (simply) pooling data without taking the differences in the level of support
into account.
Event data is especially susceptible to a large range of biases. These include description and
selection bias (Earl et al. 2004: 67), plus problems of event localization, temporal inaccuracy, and
actor differentiation (see Chojnacki et al. 2012b). One example is urban bias (Kalyvas 2004) due
to the higher precision of city-level data, but also the well-known, difficult-to-avoid problem
of the higher likelihood of international media coverage of events near urban agglomerations.
Urban bias can be deceptive, leading to the erroneous assumption that violence is concentrated
in cities while remote, peripheral areas are completely calm and relatively unaffected by war.
Using the approximate measures of territorial contestation described above raises the question
as to whether these are valid and valuable units of analysis. There are two major problems here:
the first is endogeneity – when using these data-driven units of analysis. A second problem that
arises has to do with the arbitrariness of the unit of analysis, leading to incongruity with most
19This is mainly caused by misleading impressions based on spatially homogenous data. See also the
Modifiable Areal Unit Problem (MAUP) (Lennon 2000; Wu/Hobbs 2007: 117pp.). The core of this scaling
problem is the discrepancy between level of analysis and actual real-world occurrence (Madelin et al.
2009: 647).
20Every type of aggregation is always also a transformation. In most cases, this is a smoothing filtering
function (Madelin et al. 2009: 647, 654).
SFB-Governance Working Paper Series • No. 66 • November 2014 | 17
kinds of available context data. These measures prove to be helpful, however, for exploratory
spatial data analysis (ESDA).21
After covering problems of data aggregation and the issue of choosing the “right” unit of
analysis, we turn to contextual data and its level of spatiotemporal coverage. Although highly
disaggregated (sometimes biased) conflict event data is readily available, context data is not.
Despite the enhanced availability of high-resolution remote sensing data in recent years, there
is still one major obstacle when it comes to the contextualization of conflict event data. There
is no data available due to differing data resolution and missing retrospective data (such as data
from the 1990s, for example).
The discrepancy between various levels of spatial and temporal support is even more pronounced
when comparing data of social and political phenomena, which are normally based on macrodata (e. g. data on statehood, governance indicators, and so forth) with geographic variables
on spatial entities at the micro-level (e. g. altitude, precipitation, or population density), as the
latter has a much higher resolution.22
Spatial interpolation and temporal imputation can allow us to overcome this problem,
facilitating a more fine-grained spatiotemporal resolution for analysis based on the smallest
common factor. In the following, I will illustrate how to gain the necessary spatiotemporal
support. The spatial interpolation can be performed using Geographic Information Systems
such as ArcGIS (ESRI 2011) or statistical programming languages as R (R Development Core
Team 2011). While some degree of aggregation seems unavoidable, I am using raster cells per
month as unit of analysis. In this example, the raster cells are sized 25 square kilometers.
For temporal imputation, I use the R-package AMELIA II (Honaker et al. 2011). Below you will
find an example of temporally (Fig. 6) and spatially (Fig. 7) interpolated GDP/capita data. GDP/
capita data reflects the economic development on a state or regional level, and thus can be
used as a proxy for the absence of one-sided and mutual violence – a necessary condition for
economic growth.
21Another option for retrieving a maximum amount of information consists in merging the event vector
points with random points. The downside of this approach is that it comes with an enormous increase
in data points. This is particularly true in a spatiotemporal analytical framework, where the increase
amplifies the need for computing capacity and boosts an already surmounting zero-excess, skewing
the statistical distribution and contradicting statistical assumptions.
22As mentioned, besides this variation of data resolution between different types of contextual datasets,
there is an inherent variation in the accuracy of information on violent incidents. The reason for this
is that some events can only be localized in an approximate way, as they last several days or take place
throughout an entire region (Chojnacki et al. 2012b).
Limits of Control: Challenges to Spatiotemporal Analysis of Sub-State War | 18
Figure 6: Interpolated times series of G-Econ data for Somalia (1990-2010).
Like the aforementioned demographic data, the majority of (socio-)economic data is spatially
invariant or aggregated temporally. Thus the Gross Cell Product (GCP) taken from the G-Econ
dataset23 (Nordhaus 2008) is an exception in that it is spatiotemporally disaggregated and can
be used for the integration of economic factors in likewise disaggregated analysis.24 G-Econ
is based on estimates of economic performance in billion U.S. dollars for raster cells, each
covering one time one decimal degree for the years 1990, 1995 and 2000, and for many countries
the year 2005 as well.25
The value of the GCP equals the “gross value added in a specific geographical
region; gross value added is defined as total production of market goods and
services less purchases from other businesses […] GCP also equals the incomes of
factors of production located within the region” (Nordhaus et al. 2006: 6).
Temporal gaps aside, the geographic resolution of G-Econ does not correspond to the raster
utilized in this paper. In order to cope with this lack of spatial precision, the centroids have
23Beyond that, G-Econ comprises also geographic, socio-economic and demographic variables (http://
gecon.yale.edu/). Substantial inconsistencies are indexed in G-Econ via a quality-variable (Nordhaus et
al. 2006).
24An alternative to G-Econ is Night Light Emission Data (NGDC 2011). But on close inspection – especially
in the DR Congo – the data contains only a fraction of the human settlements in the region (possibly
due to the forest canopy) and is therefore only of supplemental use.
25Missing values for the years 2005 and 2010 are linearly extrapolated by the difference between the values
of the periods of 1995-2000 and 2000-2005 (e. g.: (GCP2000 - GCP1995) + GCP2000). The extrapolation
has been conducted in consistency with plausibility checks on the results.
SFB-Governance Working Paper Series • No. 66 • November 2014 | 19
been interpolated with the help of Empirical Bayesian kriging.26 As a result, the data is spatially
joined with the raster used here and the mean value calculated for each raster cell respectively
(Fig. 7).
Figure 7: Spatially interpolated G-Econ data for Sierra Leone and Liberia for 2005.
Another example of where this technique can be implemented is population density data.
Besides a multitude of other variables, population density is often used as a variable for
contextualizing violent events in conflict science, as it provides information on the population
at risk in an area.27 For the population data, I have done the same as described above for the
G-Econ data. Yet more work has to be done to introduce a more realistic representation of
the spatial distribution of the phenomena, and population density is a good example for that.
Population density has to be recalculated not on basis of the area of the raster cells, but on the
perimeter of settlements (Linard et al. 2012) and roads (CIESIN et al. 2012). This would disregard
empty space and calculate only population density for actual inhabited space. After generating
and appropriately adjusting spatially and temporally disaggregated context data, the problem
26Empirical Bayesian kriging (EBK) differs from other kriging methods in that it does not use “weighted
least squares”. Parameterization is carried out automatically with “restricted maximum likelihood”
(REML) by splitting the data points in neighbor groups and subsequently simulating the values.
The error of estimation of the semivariogram is included in the calculation, thus avoiding an
underestimation of the standard errors (ESRI 2011). The EBK calculation is done using ArcGIS 10.1,
including eight neighboring sectors and performing a lognormal transformation, 100 iterations for
optimization and checking for outliers resulting in small standard errors in cross-validation. The
G-Econ interpolation has been done for a 5 km- or 0,045° decimal degree raster.
27The gridded population of the world, version 3 (GPWv3) from the Center for the International Earth
Science Information Network (CIESIN) at Columbia University provides a five-year increment,
worldwide coverage and up to five-times-five kilometer geographic resolution (CIESIN 2011). The
data gathering and estimation techniques used (and consequently the quality of data provided by
public authorities or international organizations) can be affected immensely in civil war areas.
Strong fluctuations of the population density due to refugee movement and temporary, spontaneous
campsites can distort official numbers even more.
Limits of Control: Challenges to Spatiotemporal Analysis of Sub-State War | 20
remains: data concerning violent incidences cannot be projected in a comparable way. The
following example of an explanative spatiotemporal analysis will illustrate this problem.
5. Explanative Spatiotemporal Analysis
The analysis of spatiotemporally disaggregated conflict event data – even when combined
with disaggregated context data – comes with yet another problem, namely an (unavoidable)
zero-excess within the count data of violent incidences. Because of this, spatial Tobit models
(Wilhelm/Godinho de Matos 2013) or models following a negative binomial distribution (e. g.
Croissant 2010) are an appropriate choice. However, in a spatiotemporal setup, this circumstance
requires procedures that have yet to be fully incorporated into statistical software packages and
thus are not addressed in this paper.28
The spatiotemporal approach also requires the specification of a sensibly-chosen spatial
neighborhood and time frame that is assumed to have an effect on the analyzed observations.
One must define what is regarded as geographic proximity or neighborhood (see Getis 2009)
and what is considered a short or long-term effect (see Shellman 2004). For the sake of simplicity,
this paper uses binary contiguity weight matrices. But again, this choice must be considered
carefully and can distinctly alter results and their interpretive range, which resembles the
impact of the level of aggregation (cf. section 4).
The following shows a regression analysis testing whether one-sided violence is influenced
by the number of violent non-state actors (NOVNSA); covaries with the fighting intensity,
proxied by the number of mutual fighting events (FIGHT) and military deaths divided by the
number of events (ESCALFIG). Interpolated data is used as contextual background, namely the
average Gross Cell Product (AVG_GCP) and the average population density (POP_DENS). The
dependent variable in this setup is one-sided violence against the civilian population (ONE).29
The regression is performed on basis of a spatial fixed and a spatial random effects lag model
(Millo/Piras 2012) as exemplified in the case of Somalia.30 The variables are lagged to avoid
simultaneous causality; the square root of the context variables is taken (due to their skew
distribution) and outliers have been removed.
28For instance, Bayesian MCMC methods could be used for that (Hadfield 2010).
29Endogeneity should not be a problem here, because (a) inter-group violence (incidents) is used
to establish violent group presence and activity in a given spatiotemporal context; this is used as
independent variable and (b) the dependent variable is a special category of violent incidents, i. e.
violence by armed groups against the (unarmed) population and this is likely different from (a). Using
mutual violence in one region as dependent variable could, however, cause endogeneity, given the
linkage between an increase in the number of armed actors in one region and the probability of their
contestation.
30To analyze the linkage between conflict intensity, contest and context, hypothesis can be tested as the
following: the number of armed actors is expected to decrease in short-term, as one-sided violence
against the civilian population is used to consolidate territorial control and regional dominance. Onesided violence is expected to decrease in the long run, however, along with the number of actors. The
latter assumption reflects the growing organizational capacities of armed actors, but also their need
for more productive resource allocation and support by the civilians under control (cf. section 2).
SFB-Governance Working Paper Series • No. 66 • November 2014 | 21
Table 1: Results of spatial panel fixed and random effects lag models (Millo/Piras 2012).
Variable
SPFE-Lag SPRE-Lag
0.002**
(-0.001)
(INTERCEPT)
NOVNSA_LAG
-0.027*** -0.042***
(-0.002)
(-0.002)
FIGHT_LAG
0.062***
(-0.001)
0.105***
-0.001
ESCALFIG_LAG
0.005***
(-0.001)
0.004***
(-0.001)
SQRT(POP_DENS)
-0.03*
(-0.013)
-0.001
(-0.001)
-0.019**
0.017**
(-0.007)
(-0.006)
0.123***
0.0948***
(-0.022)
(0.022)
Log-Likelihood
-
41982.72
N
54014
54014
SQRT(AVG_GCP)
Lambda
Signif. codes: 0 ‘***’ 0.001 ‘**’ 0.01 ‘*’ 0.05; n, the number of individuals, T, the number of time
observations, N, the total number of observations (by month: n = 226, T = 239, N = 54014).
As results show, the number of armed actors and the conflict intensity measurements are highly
significant; the average GCP is still important, while the population density has only a marginal
significant impact in the fixed effects model (see Tab. 1). A higher number of VNSAs reduces
the probability of one-sided violence in Somalia, while more intense fighting increases the
victimization risk for civilians. The coefficient of lambda – representing the spatially lagged
dependent variable – indicates a prominent level of autocorrelation within the dependent
variable. The zero-excess in the dependent count variable could, however, induce a substantial
downward bias on the standard errors and distort results. Even if this is a suboptimal solution –
due to the immanent degree of autocorrelation – a negative binomial model could be calculated
comparatively (e. g. Croissant 2010).
While this exemplary spatiotemporal regression analysis shows that violence against the civilian
population depends overall on the number of armed non-state actors, it would be guesswork
to infer the inherent logic/functionality of violence and the effect of territorial control on basis
of these results. Gaining a profound answer as to whether the variance of violence is rooted in
the data used or if it is in fact conflict inherent needs further investigation, and the non-normal
statistical distribution of event data needs to be accounted for.
Limits of Control: Challenges to Spatiotemporal Analysis of Sub-State War | 22
6. Concluding Remarks
The variance of violence can partially be a function of the extent of control, the effect of which
is tested here via the proxy of the level of contestation between armed actors. Nevertheless,
it would be premature to say (on basis of this working paper) that the manifold problems
surrounding the measurement of armed actors’ territorial control by making spatiotemporal
actor presence visible are close to being solved. All the same, information on the actor specific
level of military capacity, the diffusion of conflict, the (strategic) “value” of a location, or a distinct
actor constellation can open up the black box of territoriality of armed actors on a sub-state
level (at least slightly).
The possible pathways to measure and attribute territorial control via the proxy of territorial
contestation presented here go to some extent beyond what has been done so far quantitatively
and also beyond the anecdotal evidence of field experts or other qualitative sources. The
produced statistics can, however, be complementary to the existing procedures used to
delimit and evaluate local/regional VNSAs presence. If contextualized, however, information
regarding the probability of armed actors being present at some place within a distinct period
of time, between two events or within a temporal cluster, could prove very valuable. One major
problem that all approaches share is the lack of contextual background needed to draw sensible
conclusions.
This can be the first of many steps that should be taken – but “if our theories are disaggregated,
then our empirical analyses and research designs should reflect this” (Cederman/Gleditsch
2009: 490). Spatial and temporal aggregation (Shellman 2004) or disaggregation (Cederman/
Gleditsch 2009: 492; Rød et al. 2010) must match our research questions, the phenomena we
are looking at and the data at hand. Choosing “downscaling” and the highest possible degree
of disaggregation is not always sufficient, nor is it always appropriate. What’s more, this datadriven attempt to retrieve every bit of information can obscure underlying processes for which
a higher level of aggregation may be more adequate. (Dis-)aggregation is an option, but it should
be used in a sensible way and relate to the overall research question.
A combined perspective on territorial contestation and the disaggregation of context data would
benefit the analysis of patterns of violence via delimitating contested areas and increasing the
level of contextual detail. Though it remains difficult to tell whether the stage of approximation
will be overcome and robust prediction will be available. There can be little doubt that the
optimal solution – one that is not as labor intensive and time consuming as those presented
here – has yet to be found.
The profound usage of remote-sensing data for mapping slash-and-burn practices and crop
plantations (e. g. ESDIS 2012) – which could tell us whether there are spontaneous campsites of
displaced refugees or whether an armed actor gave the signal that it is safe to return because
other armed actors no longer pose a threat and the civilians can harvest what they sowed (Lidow
2010) – will be especially useful in the coming years. There have also been advances with regard
SFB-Governance Working Paper Series • No. 66 • November 2014 | 23
to natural language processing and the coding of non-lethal events from a vast array of news
outlets (cp. Ickler/Wiesel 2012). The next steps would be near real-time event data gathering (van
der Windt/Humphreys 2012) and combination with regard to remote sensing data.
Limits of Control: Challenges to Spatiotemporal Analysis of Sub-State War | 24
7. Literature
Agnew, John 2000: Territoriality/Territory, in: Johnston, Ronald (Ed.): The Dictionary of Human
Geography, Oxford, 823-824.
Azam, Jean-Paul/Hoeffler, Anke 2002: Violence Against Civilians in Civil Wars: Looting or Terror?,
in: Journal of Peace Research 39: 4, 461-485.
Bakke, Kristin M./Cunningham, Kathleen Gallagher/Seymour, Lee J. M. 2012: A Plague of Initials:
Fragmentation, Cohesion, and Infighting in Civil Wars, in: Perspectives on Politics 10:
2, 265-283.
Balcells, Laia 2010: Rivalry and Revenge: Violence Against Civilians in Conventional Civil Wars,
in: International Studies Quarterly 54: 2, 291-313.
Barranco, José/Wisler, Dominique 1999: Validity and Systematicity of Newspaper Data in Event
Analysis, in: European Sociological Review 15: 3, 301-322.
BBC, British Broadcasting Corporation 2013: Mali’s Ansar Dine militants blacklisted by US.
Bezdek, James C. 1981: Pattern Recognition with Fuzzy Objective Function Algorithms, New York.
Boulding, Kenneth Ewart 1962: Conflict and Defense. A General Theory, New York.
Bourdieu, Pierre/Passeron, Jean Claude 1973: Grundlagen einer Theorie der symbolischen Gewalt,
Frankfurt am Main.
Branovic, Željko/Chojnacki, Sven 2011: The Logic of Security Markets: Security Governance in
Failed States, in: Security Dialogue 42: 6, 553-569.
Buhaug, Halvard 2010: Dude, Where’s My Conflict? LSG, Relative Strength, and the Location of
Civil War, in: Conflict Management and Peace Science 27: 2, 107-128.
Buhaug, Halvard/Gates, Scott 2002: The Geography of Civil War, in: Journal of Peace Research 39:
4, 417-433.
Buhaug, Halvard/Gleditsch, Kristian Skrede 2008: Contagion or Confusion? Why Conflicts Cluster
in Space, in: International Studies Quarterly 52: 2, 215-233.
Cederman, Lars-Erik/Gleditsch, Kristian Skrede 2009: Introduction to Special Issue on “Disaggregating
Civil War”, in: Journal of Conflict Resolution 53: 4, 487-495.
Chojnacki, Sven 2004: Neue Kriege oder substaatliche Kriege? Gewaltakteure und Gewaltmärkte:
Wandel der Kriegsformen?, in: Der Bürger im Staat 54: 4, 197-204.
Chojnacki, Sven/Ickler, Christian/Schoenes, Katharina/Spies, Michael/Wildemann, Tim 2012a: EDACS
Codebook, in: www.conflict-data.org; 06-05-2013.
Chojnacki, Sven/Ickler, Christian/Spies, Michael/Wiesel, John 2012b: Event Data on Armed Conflict
and Security: New Perspectives, Old Challenges, and Some Solutions, in: International
Interactions 38: 4, 382-401.
CIESIN, Center for International Earth Science Information Network 2011: Gridded Population of the
World (GPW).
CIESIN, Center for International Earth Science Information Network/ITOS, Information Technology
Outreach Services/ISCGM, International Steering Committee for Global Map 2012: Global
Roads Open Access Data Set, Version 1 (gROADSv1) (preliminary release). Palisades, NY.
Croicu, Mihai Catalin/Sundberg, Ralph 2012: UCDP GED Conflict Polygons Dataset Codebook
version 1.1-2011, Uppsala.
Croissant, Yves 2010: pglm: Panel Generalized Linear Model.
SFB-Governance Working Paper Series • No. 66 • November 2014 | 25
Cunningham, Kathleen Gallagher/Bakke, Kristin M./Seymour, Lee J. M. 2012: Shirts Today, Skins
Tomorrow: Dual Contests and the Effects of Fragmentation in Self-Determination
Disputes, in: Journal of Conflict Resolution 56: 1, 67-93.
Earl, Jennifer/Martin, Andrew/McCarthy, John D./Soule, Sarah A. 2004: The Use of Newspaper Data in
the Study of Collective Action, in: Annual Review of Sociology 30: 1, 65-80.
Eck, Kristine 2012: In Data We Trust? A Comparison of UCDP GED and ACLED Conflict Events
Datasets, in: Cooperation and Conflict 47: 1, 124-141.
Elwert, Georg 1997: Gewaltmärkte - Beobachtungen zur Zweckrationalität der Gewalt, in: Kölner
Zeitschrift für Soziologie und Sozialpsychologie 37: 1997, 86-101.
ESDIS, NASA/GSFC Earth Science Data Information System (ESDIS) 2012: Active Fire Data.
ESRI 2011: ArcGIS Desktop: Release 10, Redlands, CA.
Fjelde, Hanne/Hultman, Lisa 2013: Weakening the Enemy: A Disaggregated Study of Violence
against Civilians in Africa, in: Journal of Conflict Resolution.
Fjelde, Hanne/Nilsson, Desirée 2012: Rebels against Rebels: Explaining Violence Between Rebel
Groups, in: Journal of Conflict Resolution 56: 4, 604-628.
Galtung, Johan 1969: Violence, Peace, and Peace Research, in: Journal of Peace Research 6: 3, 167191.
Galtung, Johan 1990: Cultural Violence, in: Journal of Peace Research 273: 3, 291-305.
Gent, Stephen 2011: Relative Rebel Strength and Power Sharing in Intrastate Conflicts, in:
International Interactions 37: 2, 215-228.
Getis, Arthur 2009: Spatial Weights Matrices, in: Geographical Analysis 41: 4, 404-410.
Gotway, Carol A./Young, Linda J. 2002: Combining Incompatible Spatial Data, in: Journal of the
American Statistical Association 97: 458, 632-648.
Gudehus, Christian/Christ, Michaela 2013: Gewalt: Ein interdisziplinäres Handbuch.
Hadfield, Jarrod 2010: MCMC methods for Multi-response Generalised Linear Mixed Models:
The MCMCglmm R Package, in: Journal of Statistical Software 33: 2, 1-22.
Honaker, James/King, Gary/Blackwell, Matthew 2011: Amelia II: A Program for Missing Data, in:
Journal of Statistical Software 45: 7, 1-47.
Hsiao, Cheng/Pesaran, M. Hashem/Tahmiscioglu, A. Kamil 2002: Maximum likelihood estimation
of fixed effects dynamic panel data models covering short time periods, in: Journal of
Econometrics 109: 1, 107-150.
Hultman, Lisa 2007: Battle Losses and Rebel Violence: Raising the Costs for Fighting, in:
Terrorism and Political Violence 19: 2, 205-222.
Hultman, Lisa 2008: Targeting the Unarmed: Strategic Rebel Violence in Civil War (Uppsala
University: Dissertation), Uppsala, Sweden.
Humphreys, Macartan 2005: Natural Resources, Conflict, and Conflict Resolution, in: Journal of
Conflict Resolution 49: 4, 508-537.
Huth, Paul K. 1998: Standing your ground territorial disputes and international conflict, Ann
Arbor.
Ickler, Christian/Wiesel, John 2012: New Method, Different War? Evaluating Supervised Machine
Learning by Coding Armed Conflict (SFB-Governance Working Paper Series, September
2012), Berlin.
Kalyvas, Stathis N. 2004: The Urban Bias in Research on Civil Wars, in: Security Studies 13: 3, 1-31.
SFB-Governance Working Paper Series • No. 66 • November 2014 | 26
Kalyvas, Stathis N. 2006: The Logic of Violence in Civil War, Cambridge and New York.
Kaufman, Stuart J. 1996: An ‘International’ Theory of Inter-Ethnic War, in: Review of International
Studies 22: 2, 149-171.
Kongsgård, Håvard Wahl 2010: Geography Matters, but People Are the Key; The Location of Viet
Cong Initiated Incidents, (GROW-Net Workshop, Peace Research Institute Oslo, 201006-18).
Korf, Benedikt/Engeler, M./Hagmann, Tobias 2010: The Geography of Warscape, in: Third World
Quarterly 31: 3, 385-399.
Korniotis, George M. 2007: Estimating Panel Models with Internal and External Habit Formation
(Working Paper Series), Miami, in: http://ssrn.com/abstract=986726; 2014-10-09.
Kulldorff, Martin/Information Management Services Inc. 2009: SaTScanTM. Software for the spatial
and space-time scan statistics, Boston, MA.
Lennon, Jack J. 2000: Red-shifts and red herrings in geographical ecology, in: Ecography 23: 1,
101-113.
Lidow, Nicholai Hart 2010: Rebel Governance and Civilian Abuse: Comparing Liberia’s Rebels
Using Satellite Data, (American Political Science Association (APSA) Conference,
Washington, DC, 2-5 September).
Linard, Catherine/Gilbert, Marius/Snow, Robert W./Noor, Abdisalan M./Tatem, Andrew J. 2012:
Population Distribution, Settlement Patterns and Accessibility across Africa in 2010, in:
PLOS ONE 7: 2, e31743.
MacQueen, James B. 1967: Some Methods for Classification and Analysis of Multivariate
Observations, (5th Berkeley Symposium on Mathematical Statistics and Probability,
Statistical Laboratory of the University of California, Berkeley, June 21-July 18).
Madelin, Malika/Grasland, Claude/Mathian, Hélène/Sanders, Léna/Vincent, Jean-Marc 2009: Das
“MAUP”: Modifiable Areal Unit - Problem oder Fortschritt?, in: Informationen zur
Raumentwicklung 10: 11, 645-660.
Mampilly, Zachariah Cherian 2011: Rebel Rulers: Insurgent Governance and Civilian Life during
War, Ithaca, N.Y.
McColl, Robert W. 1969: The Insurgent State: Territorial Bases of Revolution, in: Annals of the
Association of American Geographers 59: 4, 613-631.
Melander, Erik/Sundberg, Ralph 2011: Climate Change, Environmental Stress, and Violent Conflict:
Tests introducing the UCDP Georeferenced Event Dataset, (Annual meeting of th
International Studies Association, Quebec, Canada).
Menkhaus, Kenneth John 2006: Governance without Government in Somalia: Spoilers, State
Building, and the Politics of Coping, in: International Security 31: 3, 74-106.
Millo, Giovanni/Piras, Gianfranco 2012: splm: Spatial Panel Data Models in R, in: Journal of
Statistical Software 47: 1, 1-38.
Nardulli, Peter F./Leetaru, Kalev H./Hayes, Matthew J. 2011: Event Data, Civil Unrest and the Social,
Political and Economic Event Database (SPEED) Project: Post World War II Trends in
Political Protests and Violence, (Annual meeting of the International Studies Association,
Quebec, Canada).
NGA 2011: GEOnet Names Server (GNS).
NGDC, National Geophysical Data Center 2011: Global DMSP-OLS Nighttime Lights Time Series
1992 - 2009.
SFB-Governance Working Paper Series • No. 66 • November 2014 | 27
Nordhaus, Willam D. 2008: New metrics for environmental economics: Gridded economic data,
in: The Integrated Assessment Journal 8: 1, 73-84.
Nordhaus, William D./Azam, Qazi/Corderi, David/Hood, Kyle/Makarova Victor, Nadejda/Mohammed,
Mukhtar/Miltner, Alexandra/Weiss, Jyldyz 2006: The G-Econ Database on Gridded Output:
Methods and Data (May 12), New Haven, CT, in: http://gecon.yale.edu/sites/default/files/
gecon_data_20051206.pdf.
O’Loughlin, John/Witmer, Frank D. W./Linke, Andrew M. 2010: The Afghanistan-Pakistan Wars,
2008–2009: Micro-geographies, Conflict Diffusion, and Clusters of Violence, in: Eurasian
Geography and Economics 51: 4, 437–471.
Öberg, Magnus/Sollenberg, Margareta 2011: Gathering Conflict Information Using News Resources,
in: Hoglund, Kristine/Öberg, Magnus (Eds.): Understanding Peace Research: Methods
and Challenges, Abingdon, 47-73.
Paasi, Anssi 2003: Territory, in: Agnew, John A./Mitchell, Katharyne/Toal, Gerard (Eds.): A
Companion to Political Geography, Malden, MA, 109-123.
Pearlman, Wendy/Cunningham, Kathleen Gallagher 2012: Nonstate Actors, Fragmentation, and
Conflict Processes, in: Journal of Conflict Resolution 56: 1, 3-15.
Powell, Robert 2008: Deterring and Defending Against Strategic Attackers: Deciding How Much
to Spend and on What, Berkeley, CA, in: http://rpowell.berkeley.edu/Home%20Page%20
Images/DandDApril08.pdf.
R Development Core Team 2011: R: A language and environment for statistical computing, Vienna.
Raleigh, Clionadh/Linke, Andrew/Hegre, Håvard/Karlsen, Joakim 2010: Introducing ACLED: An
Armed Conflict Location and Event Dataset, in: Journal of Peace Research 47: 5, 651-660.
Rød, Jan Ketil/Buhaug, Halvard/Gleditsch, Kristian Skrede 2010: Are the Details Devilish? Scaling
Effects in Disaggregated Civil War Studies), Oslo, unpublished manuscript.
Ross, Michael Lewin 2004: What Do We Know About Natural Resources and Civil War?, in: Journal
of Peace Research 41: 3, 337-356.
Schutte, Sebastian/Weidmann, Nils B. 2011: Diffusion Patterns of Violence in Civil Wars, in: Political
Geography 30: 3, 143-152.
Shellman, Stephen M. 2004: Time Series Intervals and Statistical Inference: The Effects of Temporal
Aggregation on Event Data Analysis, in: Political Analysis 12: 1, 97-104.
Skaperdas, Stergios 2002: Warlord Competition, in: Journal of Peace Research 39: 4, 435-446.
Tobler, Waldo R. 1970: A Computer Movie Simulating Urban Growth in the Detroit Region, in:
Economic Geography 46: 2, 234-240.
van der Windt, Peter/Humphreys, Macartan 2012: Crowdseeding Conflict Data: An Application
of an SMS-based Data System to Estimate the Conflict Effects of Development Aid
(September 27), New York, NY, in: http://cu-csds.org/wp-content/uploads/2009/10/
pwmh_crowdseedingconflictdata.pdf.
Wilhelm, Stefan/Godinho de Matos, Miguel 2013: spatialprobit: Spatial Probit Models.
Wood, Reed M. 2010: Rebel Capability and Strategic Violence against Civilians, in: Journal of
Peace Research 47: 5, 601-614.
Wu, Jianguo/Hobbs, Richard J. 2007: Key Topics in Landscape Ecology, Cambridge.
Ziemke, Jennifer 2008: From Battles to Massacres (3rd Annual Harvard-Yale-MIT Graduate
Student Conference on Order, Conflict and Violence, New Haven, CT, April 18-19).
SFB-Governance Working Paper Series • No. 66 • November 2014 | 28
Previously published Working Papers from the SFB-Governance Working Paper Series
Hönke, Jana/Börzel, Tanja A. 2013: Restraint of Statehood and the Quality of Governance by Multinational
Companies in Sub-Saharan Africa, No. 65, Berlin, December 2013
Daxner, Michael/Schrade, Urs 2013: Higher Education in Afghanistan: Governance at Stake, No. 63, Berlin, June
2013
Krieger, Heike 2013: A Turn to Non-State Actors: Inducing Compliance with International Humanitarian Law in
War-Torn Areas of Limited Statehood, No. 62, Berlin, June 2013
Kocak, Deniz 2013: Security sector reconstruction in a post-conflict country: Lessons from Timor-Leste, No. 61,
Berlin, October 2013
Kode, Johannes 2013: On the Social Conditions of Governance: Social Capital and Governance in Areas of Limited
Statehood, No. 60, Berlin, September 2013
Börzel, Tanja A./Van Hüllen, Vera 2014: External State-Building and Why Norms Matter - The European Union’s
Fight against Corruption in the Southern Caucasus, No. 59, Berlin, Januaryy 2014
Kötter, Matthias 2013: Wie viel Recht steckt in Good Governance? - Eine Betrachtung aus juristischer Perspektive,
No. 58, Berlin, September 2013
Wrase, Michael 2013: Wie wirkt Recht? – Überlegungen zur Rechtswirkungsforschung unter den Bedingungen
konsolidierter und begrenzter Staatlichkeit, No. 57, Berlin, June 2013
Van Hüllen, Vera/Börzel, Tanja A. 2013: The EU’s Governance Transfer: From External Promotion to Internal
Protection?, No. 56, Berlin, June 2013
Chojnacki, Sven/Engels, Bettina 2013: Material Determinism and Beyond: Spatial Categories in the Study of
Violent Conflict, No. 55, Berlin, June 2013
Elliesie, Hatem 2014: Binnenpluralität des Islamischen Rechts - Diversität religiöser Normativität rechtsdogmatisch
und -methodisch betrachtet, No. 54, Berlin, April 2014
Jetschke, Anja 2013: Governance Transfer by the Association of Southeast Asian Nations (ASEAN). A B2 Case
Study Report, No. 50, Berlin, December 2013
Lohaus, Mathis 2013: Governance Transfer by the Organization of American States (OAS) - A B2 Case Study
Report, No. 49, Berlin, December 2013
SFB-Governance Working Paper Series • No. 66 • November 2014 | 29
van der Vleuten, Anna/Hulse, Merran 2013: Governance Transfer by the Southern African Development
Community (SADC) - A B2 Case Study Report, No. 48, Berlin, December 2013
Hartmann, Christof 2013: Governance Transfer by the Economic Community of West African States (ECOWAS)
- A B2 Case Study Report, No. 47, Berlin, December 2013
Duina, Francesco 2013: Governance Transfer in the North American Free Trade Agreement (NAFTA) - A B2 Case
Study Report, No. 46, Berlin, December 2013
Bothe, Lukas/Grundmann, Kai 2013: Legitimitätsressourcen im Übergang von antiker zu mittelalterlicher
Staatlichkeit. Zwei Perspektiven auf postimperiale Governance, No. 44, Berlin, June 2013
Koehler, Jan/Böhnke, Jan/Zürcher, Christoph 2013: Assessing the Impact of Development Cooperation in
Northeast Afghanistan, in: SFB-Governance Working Paper Series 43.
Börzel, Tanja A./Van Hüllen, Vera/Lohaus, Mathis 2013: Governance Transfer by Regional Organizations:
Following a Global Script?, No. 42, Berlin, January 2013
Goikhman, Izabella/Herrmann, Barbara 2012: The Governance Discourse in China, No. 41, Berlin, November
2012
Willms, Jan 2012: Justice Through Armed Groups‘ Governance – An Oxymoron?, No. 40, Berlin, October 2012
Ickler, Christian/Wiesel, John 2012: New Method, Different War? Evaluating Supervised Machine Learning by
Coding Armed Conflict, No. 39, Berlin, September 2012
Livingston, Steven/Walter-Drop, Gregor 2012: Information and Communication Technologies in Areas of
Limited Statehood, No. 38, Berlin, September 2012
Schüren, Verena 2012: Two TRIPs to Innovation: Pharmaceutical Innovation Systems in India and Brazil, No. 37,
Berlin, June 2012
Draude, Anke/Risse, Thomas/Schmelzle, Cord 2012: Grundbegriffe der Governanceforschung. Ein Beitrag aus
dem Teilprojekt A1 (2. überarbeitete Auflage), No. 36, Berlin, June 2012
Eimer, Thomas R. 2012: When Modern Science Meets Traditional Knowledge: A Multi-Level Process of Adaptation
and Resistance, No. 35, Berlin, June 2012
Eimer, Thomas R. 2012: When Modern Science Meets Traditional Knowledge: A Multi-Level Process of Adaptation
and Resistance, No. 35, Berlin, June 2012
Limits of Control: Challenges to Spatiotemporal Analysis of Sub-State War | 30
Kötter, Matthias 2012: Non-State Justice Institutions: A Matter of Fact and a Matter of Legislation, No. 34, Berlin,
June 2012
Koehler, Jan 2012: Social Order Within and Beyond the Shadow of Hierarchy. Governance Patterns in Afghanistan,
No. 33, Berlin, June 2012
Risse, Thomas 2012: Governance Configurations in Areas of Limited Statehood: Actors, Modes, Institutions, and
Resources, No. 32, Berlin, April 2012
Hönke, Jana/Thomas, Esther 2012: Governance for Whom? Capturing the Inclusiveness and Unintended Effects
of Governance, No. 31, Berlin, Mai 2012
Rinke, Stefan/Contreras Saiz, Mónika/Hölck, Lasse 2012: Appropriation and Resistance Mechanisms in (Post-)
Colonial Constellations of Actors. The Latin American Frontiers in the 18th and 19th Century, No. 30,
Berlin, June 2012
Börzel, Tanja A. 2012: How Much Statehood Does it Take - and What For?, No. 29, Berlin, March 2012
Jacob, Daniel/Ladwig, Bernd/Oldenbourg, Andreas 2012: Human Rights Obligations of Non-State Actors in
Areas of Limited Statehood, No. 27, Berlin, January 2012
Schmelzle, Cord 2011: Evaluating Governance: Effectiveness and Legitimacy in Areas of Limited Statehood, No.
26, Berlin, November 2011
Börzel, Tanja A./Hönke, Jana 2011: From Compliance to Practice. Mining Companies and the Voluntary Principles
on Security and Human Rights in the Democratic Republic of Congo, No. 25, Berlin, October 2011
Draude, Anke/Neuweiler, Sonja 2010: Die Herausforderung lokaler Vielfalt jenseits der westlichen Welt, No. 24,
Berlin, Mai 2010
Börzel, Tanja A. 2010: Governance with/out Government. False Promises or Flawed Premises?, No. 23, Berlin,
March 2010
Schneckener, Ulrich 2009: Spoilers or Governance Actors? Engaging Armed Non-State Groups in Areas of
Limited Statehood, No. 21, Berlin, October 2009
All SFB-Governance Working Papers can be downloaded free of charge from www.sfb-governance.de/en/
publikationen or ordered in print via e-mail to [email protected]
The Author
Christian Ickler is a geographer with a special interest
in geographical conflict science. His focus lies on
spatiotemporal dynamics of violence in civil war and
their implications.
Contact: [email protected].
Research Framework
Partner Organizations
Governance has become a central theme in social science
Host University:
Freie Universität Berlin
research. The Collaborative Research Center (SFB) 700
Governance in Areas of Limited Statehood investigates
governance in areas of limited statehood, i.e. developing
countries, failing and failed states, as well as, in historical
University of Potsdam
perspective, different types of colonies. How and under what
conditions can governance deliver legitimate authority,
security, and welfare, and what problems are likely to emerge?
German Institute for International and
Security Affairs (SWP)
Operating since 2006 and financed by the German Research
Foundation (DFG), the Research Center involves the Freie
Berlin Social Science Center (WZB)
Universität Berlin, the University of Potsdam, the German
Institute for International and Security Affairs (SWP),
the
Social Science Research Center Berlin (WZB) and the German
Institute for Global and Area Studies (GIGA).
German Institute for Global and
Area Studies (GIGA)
Stiftung Wissenschaft und Politik
German Institute for International and Security Affairs
© Copyright 2026 ExpyDoc