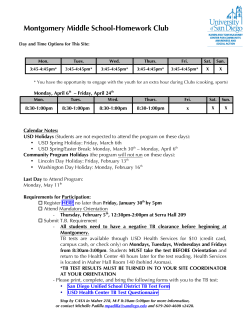
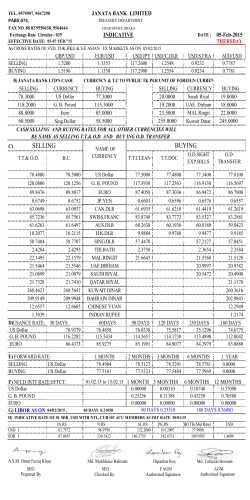
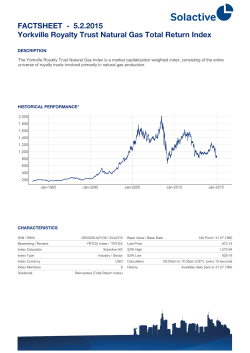
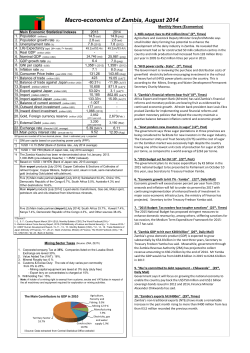
fx strategy The views expressed in this publication are made on the basis of a 2-4 week outlook and may differ from our longer term views and forecasts from the Global Research function fx | 14 April 2014 USD oversold, rebound likely Contents The USD fell sharply against major currencies as FOMC minutes sought to emphasise interest rate hikes were not imminent. USD oversold, rebound likely 1 EUR/USD 2 The recent pullback in the USD is an opportunity, in our view, to increase exposure to the USD, particularly against the EUR where recent ECB comments signalled concern on the strong currency. USD/JPY 3 AUD/USD 4 USD/SGD 5 EUR/USD GBP/USD 6 XAU/USD 7 SUPPLEMENTARY PAIRS 8 We turn bearish on the EUR/USD pair (from neutral earlier) as the foundation of the current uptrend looks increasingly vulnerable. USD/JPY Interest Rate Differentials 10 FX Implied Volatility 10 Disclosure Appendix 12 We remain bullish on the USD/JPY pair as it currently trades near multi-week supports. AUD/USD We remain neutral on the AUD/USD pair as the current rally is likely to run into strong resistance, in our view. USD/SGD We remain bullish on the USD/SGD pair and expect it to rebound due to oversold conditions. Weekly performance of pairs 4 April 2014 to 11 April 2014 EUR/USD USD/JPY GBP/USD AUD/USD USD/SGD We remain bearish on the GBP/USD pair as it appears vulnerable to a decline in momentum, in our view. XAU/USD We remain bearish on the XAU/USD pair as the current rebound is likely to face resistance near 1350, in our view. 1.31 -1.62 1.13 -0.81 GBP/USD 0.95 XAU/USD 1.14 -2.50 -1.50 -0.50 0.50 1.50 2.50 % Source: Bloomberg, Standard Chartered Pairs Outlook (2-4 wk) EUR/USD USD/JPY AUD/USD USD/SGD GBP/USD XAU/USD USD/CNH* USD/ZAR* NZD/USD* USD/CHF* USD/SEK* USD/CAD* Bearish Bullish Neutral Bullish Bearish Bearish Neutral Bullish Neutral Bullish Bullish Bullish Steve Brice Chief Investment Strategist Rob Aspin, CFA Head, Equity Investment Strategy Manpreet Gill Head, FICC Investment Strategy Adi Monappa, CFA Head, Asset Allocation Audrey Goh, CFA Investment Strategist Victor Teo, CFA Investment Strategist Tariq Ali, CFA Investment Strategist Secondary Sup Primary Sup Spot Primary Res Secondary Res 1.360 100.00 0.910 1.234 1.625 1,200 6.172 10.350 0.834 0.855 6.350 1.080 1.374 101.30 0.930 1.245 1.650 1,270 6.192 10.402 0.848 0.867 6.438 1.092 1.385 101.59 0.940 1.251 1.674 1,327 6.214 10.523 0.867 0.877 6.544 1.098 1.398 103.20 0.950 1.256 1.685 1,350 6.230 10.670 0.880 0.897 6.623 1.108 1.406 104.50 0.968 1.262 1.700 1,400 6.244 11.780 0.900 0.908 6.690 1.120 *SUPPLEMENTARY PAIRS - Going forward, we will maintain the EUR, JPY, AUD, SGD, GBP and XAU outlook while adding just key technical levels for the supplementary pairs This commentary reflects the views of the Wealth Management Group of Standard Chartered Bank. This is not a research report and has not been produced by a research unit. Important disclosures can be found in the Disclosures Appendix. 1 fx strategy | 14 April 2014 Key technical indicators and forecast* EUR/USD We turn bearish on the EUR/USD pair (from neutral earlier) as the foundation of the current uptrend looks increasingly vulnerable. Technical Indicator Action RSI (14) Buy Oscillator (5,10) Neutral Performance MACD (12,26,9) Buy ADX (14) Buy Momentum (14) Neutral The EUR/USD was up (1.31%) over the previous week after ECB policymakers’ comments signalled reluctance to add easing measures to address worryingly slow inflation. Separately, German inflation held steady. The latest Fed minutes also sought to play down concerns of imminent Fed rate hikes. Technical Analysis Major technical indicators, on balance, are neutral to bullish. However, we turn bearish on the EUR/USD pair (from neutral earlier). Although the pair has been in an uptrend since the start of the year, taking support along the 100 DMA, the pace of the rise has been relatively feeble. Against the backdrop of ECB Governor Draghi’s latest comments (where he stated “strengthening of the exchange rate requires further monetary stimulus”), the pair seems set for a downturn, in our view. A fall below key moving averages would further support our view. We would review our outlook if it moves above 1.398. Europe – Industrial production (14 April), ZEW economic sentiment survey, trade balance (15 April), consumer price inflation (16 April) and current account (17 April) are the key economic releases for the week. US – Retail sales (14 April), consumer price inflation, Fed Chairperson speaks at the Financial Markets Conference, NAHB housing market index (15 April), housing report, industrial production (16 April), initial jobless claims and the Fed beige book (17 April) are the key releases this week. Level Importance Secondary Resistance 1.406 High Primary Resistance 1.398 Medium Spot 1.385 – Primary Support 1.374 Medium Secondary Support 1.360 High Forecast Key Signposts Key Levels Consensus Q2 2014 1.36 Q3 2014 1.33 Q4 2014 1.30 Q5 2015 1.30 * Please see Appendix on Pg 11 for explanation on technical Source: Bloomberg, Standard Chartered EUR/USD may face downward pressure following Draghi’s comments Technical Analysis Chart: EUR/USD (Daily) 1.41 1.398 1.39 1.37 1.374 EUR/USD 1.35 1.33 1.31 1.29 1.27 50 dma 1.3764 1.25 1.23 Feb-13 Apr-13 EUR/USD Jun-13 Aug-13 50 dma Oct-13 100 dma 1.3709 Dec-13 100 dma 200 dma 1.3554 Feb-14 Apr-14 200 dma Source: Bloomberg, Standard Chartered This reflects the views of the Wealth Management Group 2 fx strategy | 14 April 2014 Key technical indicators and forecast* USD/JPY Technical Indicator Action We remain bullish on the USD/JPY pair as it currently trades near multi-week supports. RSI (14) Neutral Oscillator (5,10) Neutral Performance MACD (12,26,9) Neutral ADX (14) Buy Momentum (14) Neutral USD/JPY ended down (-1.62%) over the previous week as the BOJ left policy unchanged and indicated the recent sales tax increase was unlikely to have a significant impact on the economy. Increased risk aversion in developed equity markets further supported the JPY. Key Levels Technical Analysis Major technical indicators, on balance, are neutral to bullish. We are bullish on the USD/JPY pair. The downside risk in the form of BOJ inaction materialised last week, leading to a sharp drop. However, despite this disappointment, the pair closed just above the multi–week horizontal support line of 101.30. We believe the pair can rebound from here given it is trading closer to the lower end of an expanding triangle pattern. We would review our outlook if the pair falls below 100. Level Importance Secondary Resistance 104.50 Low Primary Resistance 103.20 Medium Spot 101.59 – Primary Support 101.30 High Secondary Support 100.00 High Forecast Consensus Key Signposts Q2 2014 105.0 Q3 2014 107.0 Q4 2014 109.5 Q1 2015 110.0 Industrial production, BOJ Governor Kuroda’s speech (16 April), foreign stocks and bond buying, consumer confidence index (17 April) and the tertiary industry index (18 April) are key economic releases for the week. * Please see Appendix on Pg 11 for explanation on technical Source: Bloomberg, Standard Chartered USD/JPY downside looks capped Technical Analysis Chart: USD/JPY (Daily) 110 106 103.20 USD/JPY 102 101.30 98 50 dma 102.34 94 90 Feb-13 Apr-13 USD/JPY Jun-13 Aug-13 50 dma Oct-13 100 dma 102.95 Dec-13 100 dma 200 dma 100.81 Feb-14 Apr-14 200 dma Source: Bloomberg, Standard Chartered This reflects the views of the Wealth Management Group 3 fx strategy | 14 April 2014 Key technical indicators and forecast* AUD/USD Technical Indicator Action We remain neutral on the AUD/USD pair as the current rally is likely to run into strong resistance, in our view. RSI (14) Overbought Oscillator (5,10) Neutral Performance MACD (12,26,9) Neutral ADX (14) Buy Momentum (14) Buy AUD/USD was up (1.13 %) over the previous week in sync with a rebound in iron ore prices and expectations of a Chinese stimulus. Australian employment also beat expectations, but China’s exports decelerated sharply. Technical Analysis Key Levels Level Importance Major technical indicators, on balance, are neutral to bullish. Secondary Resistance 0.968 High We remain neutral on the AUD/USD pair. Its recent strong rally has almost achieved the target of 0.95 implied by the inverse head-and-shoulders pattern we highlighted last week. The daily chart momentum indicator also looks stretched, though the weekly indicator still has some room on the upside. The 0.95 level is likely to be a critical resistance level considering this converges with the likely target of the head-and-shoulders pattern, the Fibonacci retracement level and short-term overbought conditions. Primary Resistance 0.950 High Spot 0.940 – Primary Support 0.930 Medium Secondary Support 0.910 Medium We would review our outlook if the pair moves above 0.95 or falls below 0.93. Q2 2014 0.88 Q3 2014 0.88 Q4 2014 0.87 Q1 2015 0.88 Forecast Key Signposts Australia – RBA minutes of the April meeting (14 April), Westpac consumer sentiment, home loans (9 April) and the employment report (10 April). Consensus * Please see Appendix on Pg 11 for explanation on technical Source: Bloomberg, Standard Chartered China – Foreign direct investment (14 April), consumer price inflation and GDP (6 April) are the key economic data due for release this week. AUD/USD is retracing some of its earlier losses Technical Analysis Chart: AUD/USD (Daily) 1.11 50 dma 0.9095 1.06 100 dma 0.9011 200 dma 0.9145 AUD/USD 1.01 0.950 0.96 0.91 0.86 Feb-13 0.930 Apr-13 AUD/USD Jun-13 Aug-13 50 dma Oct-13 Dec-13 100 dma Feb-14 Apr-14 200 dma Source: Bloomberg, Standard Chartered This reflects the views of the Wealth Management Group 4 fx strategy | 14 April 2014 Key technical indicators and forecast* USD/SGD We remain bullish on the USD/SGD pair and expect it to rebound due to oversold conditions. Technical Indicator Action RSI (14) Oversold Oscillator (5,10) Neutral Performance MACD (12,26,9) Sell ADX (14) Sell Momentum (14) Oversold USD/SGD was down (-0.81%) over the previous week as risk appetite helped most major Asian currencies rebound. Technical Analysis Major technical indicators are divergent. We remain bullish on the USD/SGD pair. It surprisingly dropped sharply from last week’s primary support level of 1.26 and settled along a crucial medium-term trendline connecting the December 2012 lows. We expect the significantly oversold nature of the market to trigger a rebound this week. We would review our outlook if the pair falls further below 1.243. Key Levels Level Importance Secondary Resistance 1.262 Medium Primary Resistance 1.256 Low Spot 1.251 – Primary Support 1.245 High Secondary Support 1.234 Medium Key Signposts GDP (14 April) and retail sales (15 April) are economic data to be watched this week. Forecast Consensus Q2 2014 1.27 Q3 2014 1.28 Q4 2014 1.28 Q1 2015 1.28 * Please see Appendix on Pg 11 for explanation on technical Source: Bloomberg, Standard Chartered USD/SGD has gradually weakened Technical Analysis Chart: USD/SGD (Daily) 1.30 50 dma 1.2642 1.29 100 dma 1.2648 200 dma 1.2615 1.28 USD/SGD 1.27 1.26 1.256 1.25 1.24 1.245 1.23 1.22 1.21 Feb-13 Apr-13 USD/SGD Jun-13 Aug-13 50 dma Oct-13 Dec-13 100 dma Feb-14 Apr-14 200 dma Source: Bloomberg, Standard Chartered This reflects the views of the Wealth Management Group 5 fx strategy | 14 April 2014 Key technical indicators and forecast* GBP/USD We remain bearish on the GBP/USD pair as it appears vulnerable to a decline in momentum, in our view. Technical Indicator Action RSI (14) Neutral Oscillator (5,10) Sell Performance MACD (12,26,9) Buy ADX (14) Neutral Momentum (14) Sell GBP/USD was up (0.95%) over the previous week as the BOE maintained policy rates and left the QE asset purchase programme unchanged. Technical Analysis Major technical indicators are neutral-to-bearish, on balance. Key Levels Level Importance We remain bearish on the GBP/USD pair. It rebounded mainly due to USD weakness, which has pushed it back up again to a high of 1.68. Though the pair has maintained an upward trajectory, it remains vulnerable to a decline in momentum and a pending retracement, in our view. Secondary Resistance 1.700 Medium Primary Resistance 1.685 Medium Spot 1.674 – Primary Support 1.650 Medium Secondary Support 1.625 High We would review our outlook if the pair moves above 1.685. Key Signposts Consumer price inflation (8 April) and the jobless claims report (16 April) are the main releases this week. Forecast Consensus Q2 2014 1.65 Q3 2014 1.65 Q4 2014 1.63 Q1 2015 1.65 * Please see Appendix on Pg 11 for explanation on technical Source: Bloomberg, Standard Chartered GBP/USD has had a sizeable upmove Technical Analysis Chart: GBP/USD (Daily) 1.70 1.685 1.68 1.66 1.650 1.64 GBP/USD 1.62 1.60 1.58 1.56 1.54 50 dma 1.6615 1.52 100 dma 1.6516 200 dma 1.614 1.50 1.48 Feb-13 Apr-13 GBP/USD Jun-13 Aug-13 50 dma Oct-13 Dec-13 100 dma Feb-14 Apr-14 200 dma Source: Bloomberg, Standard Chartered This reflects the views of the Wealth Management Group 6 fx strategy | 14 April 2014 Key technical indicators and forecast* XAU/USD We remain bearish on the XAU/USD pair as the current rebound is likely to face resistance near 1350, in our view. Technical Indicator Action RSI (14) Neutral Oscillator (5,10) Sell Performance MACD (12,26,9) Sell ADX (14) Neutral Momentum (14) Buy XAU/USD was up (1.14%) over the previous week as tensions in Ukraine resurfaced and the Fed FOMC minutes softened the US Dollar. Technical Analysis Major technical indicators, on balance, are neutral to bearish. Key Levels Level Importance We remain bearish on the XAU/USD pair. There are multiple strong resistances around 1,350 which are likely to restrict the current rebound, in our view. We expect prices to soften gradually as the broader price action appears negative. Secondary Resistance 1,400 High Primary Resistance 1,350 Medium Spot 1,327 – Primary Support 1,270 Medium Secondary Support 1,200 High We would review our outlook if the pair rallies above 1,350. Key Signposts This short-term view should be viewed within the context of our longer-term Underweight view on gold. Continued tapering of Fed asset purchases and rising opportunity costs provided by equity market resilience and higher yields are likely to continue working against gold, in our view. Forecast Global central bank purchases, retail demand and geo-political tensions pose risks to our view. Consensus Q2 2014 1,222.5 Q3 2014 1,200.0 Q4 2014 1,220.0 Q1 2015 1,198.0 * Please see Appendix on Pg 11 for explanation on technical Source: Bloomberg, Standard Chartered Gold has tapered from 1,400 levels Technical Analysis Chart: XAU/USD (Daily) 1,800 50 dma 1326.08 1,700 100 dma 1317.33 200 dma 1275.9 XAU/USD 1,600 1,500 1,400 1,350 1,300 1,270 1,200 1,100 Feb-13 Apr-13 XAU/USD Jun-13 Aug-13 50 dma Oct-13 Dec-13 100 dma Feb-14 Apr-14 200 dma Source: Bloomberg, Standard Chartered This reflects the views of the Wealth Management Group 7 fx strategy | 14 April 2014 SUPPLEMENTARY PAIRS *SUPPLEMENTARY PAIRS – Going forward, we will maintain the EUR, JPY, AUD, SGD, GBP and XAU outlook while adding just key technical levels for the supplementary pairs We remain neutral on the USD/CNH Technical Analysis: USD/CNH 6.40 50 dma 6.1328 6.35 6.30 200 dma 6.101 6.23 6.25 USD/CNH 100 dma 6.0941 6.20 6.192 6.15 6.10 6.05 6.00 5.95 Feb-13 Apr-13 Jun-13 USD/CNH Aug-13 Oct-13 50 dma Dec-13 Feb-14 100 dma Apr-14 200 dma Source: Bloomberg, Standard Chartered We remain bullish on the USD/ZAR Technical Analysis: USD/ZAR 11.8 11.4 11.0 10.670 USD/ZAR 10.6 10.2 10.402 9.8 9.4 9.0 50 dma 10.7725 8.6 100 dma 10.6896 200 dma 10.3485 8.2 7.8 Feb-13 Apr-13 Jun-13 USD/ZAR Aug-13 Oct-13 50 dma Dec-13 Feb-14 100 dma Apr-14 200 dma Source: Bloomberg, Standard Chartered We remain neutral on the NZD/USD Technical Analysis: NZD/USD 0.89 0.880 0.87 0.848 NZD/USD 0.85 0.83 0.81 0.79 50 dma 0.847 0.77 0.75 0.73 Feb-12 Jun-12 NZD/USD Oct-12 100 dma 0.8353 Jan-13 50 dma 200 dma 0.8241 May-13 Sep-13 100 dma Dec-13 Apr-14 200 dma Source: Bloomberg, Standard Chartered This reflects the views of the Wealth Management Group 8 fx strategy | 14 April 2014 We remain bullish on the USD/CHF Technical Analysis: USD/CHF 1.01 50 dma 0.8859 0.99 100 dma 0.8926 200 dma 0.9066 0.97 USD/CHF 0.95 0.93 0.91 0.89 0.897 0.87 0.85 Jun-12 0.867 Sep-12 Dec-12 Mar-13 USD/CHF Jun-13 50 dma Oct-13 Jan-14 100 dma Apr-14 200 dma Source: Bloomberg, Standard Chartered We turn bullish on the USD/SEK (from neutral earlier) Technical Analysis: USD/SEK 7.2 7.1 50 dma 6.4609 7.0 100 dma 6.4883 200 dma 6.5006 USD/SEK 6.9 6.8 6.7 6.623 6.6 6.5 6.4 6.438 6.3 6.2 Jun-12 Sep-12 USD/SEK Dec-12 Mar-13 50 dma Jun-13 Oct-13 100 dma Jan-14 200 dma Apr-14 Source: Bloomberg, Standard Chartered We remain bullish on the USD/CAD Technical Analysis: USD/CAD 1.14 1.12 1.108 1.10 1.092 USD/CAD 1.08 50 dma 1.1059 1.06 1.04 100 dma 1.0919 200 dma 1.0653 1.02 1.00 0.98 0.96 Jan-12 May-12 USD/CAD Sep-12 Jan-13 50 dma May-13 Aug-13 100 dma Dec-13 Apr-14 200 dma Source: Bloomberg, Standard Chartered This reflects the views of the Wealth Management Group 9 fx strategy | 14 April 2014 FX Implied Volatility Measures the yield of holding the foreign currency relative to the base currency An appropriate indicator used to gauge future expectations of price movements based on FX options market pricing EUR/USD EUR/USD 2.0 1.6 19 1.5 1.5 17 1.4 1.0 1.3 0.5 1.2 0.0 EUR/USD % Interest Rate Differentials Jan-10 Jun-11 Nov-12 Difference between EUR and USD 2 yr swap 5 Jan-11 1.5 115 25 105 20 95 1.0 85 0.5 Jan-10 Jun-11 Nov-12 Difference between USD and JPY 2 yr swap USD/JPY % 2.0 75 Apr-14 Jun-13 Apr-14 Jun-13 Apr-14 Jun-13 Apr-14 Jun-13 Apr-14 Jun-13 Apr-14 15 10 5 Jan-11 Oct-11 USD/JPY (RHS) Aug-12 2W Implied Volatility AUD/USD AUD/USD 6 1.2 5 1.1 25 21 0.9 3 0.8 2 0.7 1 AUD/USD 1.0 4 % Aug-12 2W Implied Volatility USD/JPY 2.5 Jan-10 Jun-11 Nov-12 17 13 9 0.6 Difference between AUD and USD 2 yr swap 0.5 Apr-14 5 Jan-11 Oct-11 AUD/USD (RHS) Aug-12 2W Implied Volatility USD/SGD USD/SGD 1.5 17 1.65 1.45 0.5 1.35 0.0 USD/SGD 1.55 1.0 % Oct-11 EUR/USD (RHS) 3.0 0 Aug-08 11 7 1.0 Apr-14 USD/JPY 0.0 Aug-08 13 9 1.1 -0.5 Aug-08 15 12 7 1.25 -0.5 Aug-08 Jan-10 Jun-11 Nov-12 Difference between USD and SGD 2 yr swap 1.15 Apr-14 2 Jan-11 Oct-11 USD/SGD (RHS) Aug-12 2W Implied Volatility GBP/USD GBP/USD 2.5 1.4 14 12 2.0 % 1.5 1.8 1.0 0.5 0.0 Aug-08 2.0 Jan-10 Jun-11 Difference between GBP and USD 2 yr swap Nov-12 Apr-14 GBP/USD 1.6 10 8 6 4 Jan-11 Oct-11 GBP/USD (RHS) Aug-12 2W Implied Volatility Source: Bloomberg, Standard Chartered This reflects the views of the Wealth Management Group 10 fx strategy | 14 April 2014 TECHNICAL INDICATORS – EXPLANATORY APPENDIX RSI (Relative Strength Index) – The RSI indicators can be used to describe the speed at which prices move over a given time period. An RSI above 70 can indicate a currency pair is overbought while an RSI below 30 can indicate the pair is oversold. Stochastic Oscillator – The Stochastic Oscillator compares where a security's price closed relative to its trading range over a given time period. The security or index is generally considered oversold when the Oscillator falls to 20%, while a reading of 80% is considered overbought. MACD (The Moving Average Convergence/Divergence) – This indicator shows the relationship between two moving averages of prices. A bearish signal is provided when the main moving average line drops below the second moving average line, and vice versa. ADX (Average Directional Index) – This indicator quantifies a trend's strength regardless of whether it is up or down. An index rising above zero provides a bullish signal while an index falling below zero provides a bearish signal. Momentum Indicator – The momentum of a security is the ratio of today's price compared to the price at a given point in the past. If the security's price is higher today, the momentum indicator will be considered strong. If the security's price is lower today, the momentum Indicator will be weak. This reflects the views of the Wealth Management Group 11 fx strategy | 14 April 2014 Disclosure Appendix This document is not research material and it has not been prepared in accordance with legal requirements designed to promote the independence of investment research and is not subject to any prohibition on dealing ahead of the dissemination of investment research. This document does not necessarily represent the views of every function within the Standard Chartered Bank, particularly those of the Global Research function. Standard Chartered Bank is incorporated in England with limited liability by Royal Charter 1853 Reference Number ZC18. The Principal Office of the Company is situated in England at 1 Basinghall Avenue, London, EC2V 5DD Standard Chartered Bank is authorised by the Prudential Regulation Authority and regulated by the Financial Conduct Authority and Prudential Regulation Authority. In Dubai International Financial Centre (“DIFC”), the attached material is circulated by Standard Chartered Bank DIFC on behalf of the product and/or Issuer. Standard Chartered Bank DIFC is regulated by the Dubai Financial Services Authority (DFSA) and is authorised to provide financial products and services to persons who meet the qualifying criteria of a Professional Client under the DFSA rules. The protection and compensation rights that may generally be available to retail customers in the DIFC or other jurisdictions will not be afforded to Professional Clients in the DIFC. Banking activities may be carried out internationally by different Standard Chartered Bank branches, subsidiaries and affiliates (collectively “SCB”) according to local regulatory requirements. With respect to any jurisdiction in which there is a SCB entity, this document is distributed in such jurisdiction by, and is attributable to, such local SCB entity. Recipients in any jurisdiction should contact the local SCB entity in relation to any matters arising from, or in connection with, this document. Not all products and services are provided by all SCB entities. This document is being distributed for general information only and it does not constitute an offer, recommendation, solicitation to enter into any transaction or adopt any hedging, trading or investment strategy, in relation to any securities or other financial instruments. This document is for general evaluation only, it does not take into account the specific investment objectives, financial situation, particular needs of any particular person or class of persons and it has not been prepared for any particular person or class of persons. Opinions, projections and estimates are solely those of SCB at the date of this document and subject to change without notice. Past performance is not indicative of future results and no representation or warranty is made regarding future performance. Any forecast contained herein as to likely future movements in rates or prices or likely future events or occurrences constitutes an opinion only and is not indicative of actual future movements in rates or prices or actual future events or occurrences (as the case may be). This document has not and will not be registered as a prospectus in any jurisdiction and it is not authorised by any regulatory authority under any regulations. SCB makes no representation or warranty of any kind, express, implied or statutory regarding, but not limited to, the accuracy of this document or the completeness of any information contained or referred to in this document. This document is distributed on the express understanding that, whilst the information in it is believed to be reliable, it has not been independently verified by us. SCB accepts no liability and will not be liable for any loss or damage arising directly or indirectly (including special, incidental or consequential loss or damage) from your use of this document, howsoever arising, and including any loss, damage or expense arising from, but not limited to, any defect, error, imperfection, fault, mistake or inaccuracy with this document, its contents or associated services, or due to any unavailability of the document or any part thereof or any contents. SCB, and/or a connected company, may at any time, to the extent permitted by applicable law and/or regulation, be long or short any securities, currencies or financial instruments referred to on this document or have a material interest in any such securities or related investment, or may be the only market maker in relation to such investments, or provide, or have provided advice, investment banking or other services, to issuers of such investments. Accordingly, SCB, its affiliates and/or subsidiaries may have a conflict of interest that could affect the objectivity of this document. This document must not be forwarded or otherwise made available to any other person without the express written consent of SCB. Copyright: Standard Chartered Bank 2014. Copyright in all materials, text, articles and information contained herein is the property of, and may only be reproduced with permission of an authorised signatory of, Standard Chartered Bank. Copyright in materials created by third parties and the rights under copyright of such parties are hereby acknowledged. Copyright in all other materials not belonging to third parties and copyright in these materials as a compilation vests and shall remain at all times copyright of Standard Chartered Bank and should not be reproduced or used except for business purposes on behalf of Standard Chartered Bank or save with the express prior written consent of an authorised signatory of Standard Chartered Bank. All rights reserved. © Standard Chartered Bank 2014. THIS IS NOT A RESEARCH REPORT AND HAS NOT BEEN PRODUCED BY A RESEARCH UNIT. 12
© Copyright 2026 ExpyDoc