Expy
Doc
Explore Categories
Log in
Create new account
No category
印刷用_FD2017 3_3Q (IFRS開示対応).xlsx
Download
Report
印刷用画面を開く
New Year`s Holiday Closing Notice
HUISA EXECUTIVE COMMITTEE 2016/2017
アンサーセンター アンサーネット 12 月 29 日(木) 通常営業(9 時~20 時
英語コミュニケーションI (初級C)
2016年度大学院試験 出題形式の変更
印刷[PDFダウンロード]
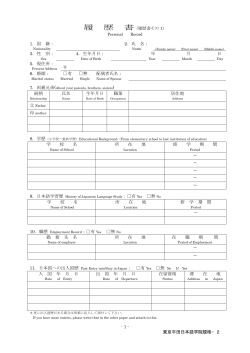
- 1 - 東京平田日本語学院規格−2 履 歴 書(履歴書その 1) 1.国 籍: 2
川嶋章司記念スカラーシップ基金
面 接 調 書 ・ 質 問 票
© Copyright 2026 ExpyDoc
About ExpyDoc
DMCA / GDPR
Report


![印刷[PDFダウンロード]](http://s3.expydoc.com/store/data/011268748_1-0103dffe6120816ebcdf84d93bd3598a-250x500.png)