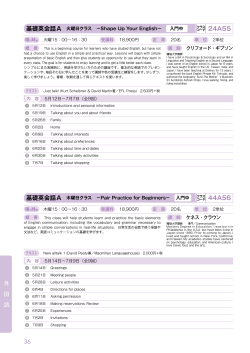
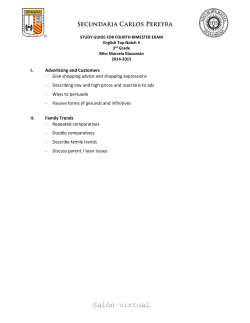
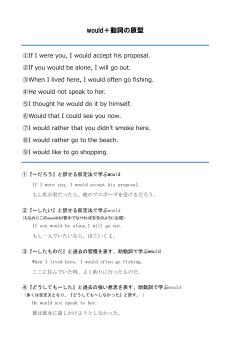
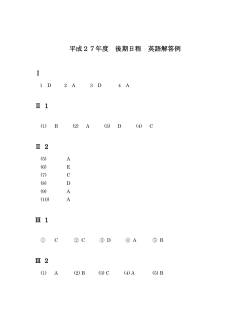
MasterCard Media Monitoring & Analysis Shopping and Retail Social Media Study Social Media Insights for WRC 2015 July 2014 – June 2015 Prepared for: MasterCard Europe Date: September 2nd, 2015 Shopping and Retail Study | About the Study MasterCard, in partnership with PRIME Research, created a study designed to identify trends surrounding shopping and retail conversations on social media, focused on the payments industry. The study examines conversations with a focus on six aspects: Safety & Security, Customer Service, Acceptance & Declines, Costs & Fees, Rewards & Benefits, and Convenience. The study stretches across 61 markets in North and South America, Europe, Africa, Asia and the Pacific Rim, and The Middle East. Social media conversations include content on MasterCard, Visa, American Express, PayPal, China Union Pay, in addition to open-ended payment industry conversations, such as conversations on Apple Pay. The social networks included are Twitter, Weibo, Facebook (until April 30th, 2015), Facebook Pages, Forums, Weibo, Instagram, YouTube. Shopping and Retail Study | Key Findings There is more discussion of Emerging Products (62%) than Core Products (38%) for the topic of Shopping and Retail on social networks in the timeframe studied. However, tonality for the two are very similar, with Emerging Payments positive tonality only 1% greater than Core Payments positive tonality. Rewards and Benefits is the most vociferously discussed aspect related to all Shopping and Retail conversations on social media, with 93% positive tonality on the topic. Additionally, the aspect generated a minimum of 25% of all conversations for the five retail sectors measured (Food, Entertainment, Travel, Fashion, Consumer Technology). As issuers, processers and merchants push for further adoption of emerging payments in particular, Rewards & Benefits are leveraged across these platforms for consumer engagement. Safety & Security has the highest percentage of negative tonality for any aspect regarding all Shopping and Retail conversations, but is the second least discussed of all the aspects. As Emerging Payment technology becomes more ubiquitous, consumer focus is less toward past worries of how safe it may be, but instead toward how to get the most from what’s on offer. This supports the findings from the 3rd annual Mobile Payments Study that consumers are now asking, What’s Next? Contactless Payments (81%) are discussed far more than Digital Emerging Payments (19%), but Contactless Payments conversations are more opinionated. This sharp difference in tonality could be as a result of user experience of Contactless Payments being crystallised by the public setting during usage – when it works and when it doesn’t, it’s more of an event as users swipe cards to, for example, effortlessly travel, or have issues, causing queues at turnstiles. For Digital Emerging Payments, positive tonality is significantly high for the aspect of Convenience (77%), and negative tonality only represents 1% of all coverage on the topic. However for Contactless payments, negative tonality reached 14%. There is some concern from consumers that the increasingly frictionless nature of payments (and in particular contactless) enables impulsive shopping, so people will “buy more useless junk.” Of all aspects measured for Shopping and Retail conversations, MasterCard leads Share of Voice on Safety & Security, Costs & Fees, and Convenience. Visa leads on the aspect of Innovation, helped by a tie-in with NFL players demoing Apple Pay at the NFL shop at the Superbowl. AmEx leads on Rewards & Benefits conversation, helped by numerous rewards that the company offers to consumers. In a comparison of tonality for MasterPass versus Visa’s equivalent Digital Wallet products, MasterCard beats Visa with more favourable tonality for five of six aspects measured. Visa only beats MasterCard on Customer Service, while the two tie on Rewards & Benefits tonality. MasterPass positive tonality is aided by the launch of Qkr!, with the app described by different consumers as “very simple, intuitive, smooth, frictionless, and fast.” Shopping and Retail Study | Contents Page • Industry trends for retail and shopping conversation: Aspects Emerging Payments and Core products Retail Sectors • Industry trends for Emerging Payments in retail and shopping conversation: Digital Wallets and In-App Payments (Online shopping) Contactless Payments (Physical shopping) • Competitive performance for retail and shopping conversation: Benchmark Aspects Overall Benchmark for Contactless (Aspects and Geography) MasterPass vs. V.Me / Visa Checkout Shopping and Retail Study | Industry | Aspects Rewards and Benefits is the most vociferously discussed aspect related to Shopping and Retail conversations on social media, with 93% positive tonality on the topic. As issuers, processers and merchants push for further adoption of emerging payments in particular, Rewards & Benefits are leveraged across these platforms, with consumers engaging in discussions on this. MasterCard used Priceless Surprises to push consumer adoption of Apple Pay and to offer Entertainment presales and unique opportunities, to name but a few. Visa offered discounts through partners, such as the Flipkart Mobile App in India, and American Express also pushed presales for entertainment events as a Reward opportunity. Safety & Security has the highest percentage of negative tonality, but is the least discussed of all the aspects. As emerging payment technology becomes more ubiquitous, consumers focus was less toward past worries of how safe it may be, but instead toward how to get the most from the service, as shown by leadership in the Rewards & Benefits aspect. This supports the results of the 3rd annual Mobile Payments Study, that indicates there has been a change in both the tone and focus towards emerging payments to “what’s next?” Criticism on Safety & Security aspects came partly from consumer complaints that legitimate payments were being blocked due to fraud prevention. Acceptance & Declines is the second most discussed aspect, a result of the growing consumer use of emerging payments. Consumers extensively discuss where they can and cannot use newer forms of payment, keen for retailers to integrate new payment systems. Positive Neutral Shares Reach Safety & Security 64% 24% 12% 6.5k 1.4k 18.4m Customer Service 62% 29% 9% 7.8k 139 83.1m 3% 14.9k 578 126.8m 3% 5.5k 1.1k 21.1m 6% 0% 25.9k 2.0k 339.2m 6.9k 371 69.8m Acceptance & Declines 75% Costs & Fees 23% 42% 56% Rewards & Benefits 93% Convenience 71% 0% Universe MasterCard, Competitor & Industry Conversations Posts Negative Markets Global 23% 50% Period 01.07.2014 – 30.06.2015 6% 100% Media types [Twitter | Facebook | Facebook Pages | YouTube | Instagram | Google+ | Weibo | Boards ] Measurement Volume | Sentiment | Reach Shopping and Retail Study | Industry | Emerging vs. Core On the topic of Shopping and Retail, there is more discussion of Emerging Payments (62%) than Core Products (38%). However, tonality for the two are very similar, with Emerging Payments positive tonality only 1% greater than Core Products positive tonality. As Emerging Payments offer new payment experiences, consumers are more inclined to turn to social media to share their experiences as they try products like Qkr! or Apple Pay for the first time, hence the higher volume of conversation. But, as is shown by the tone comparison, the user experience and sentiment toward core and emerging products remains almost identical, based on the timeframe measured. 6% 6% 22% 21% Emerging Tone Core Tone 72% 62% Emerging 38% Core 73% Emerging vs. Core SoV Universe MasterCard, Competitor & Industry Conversations Markets Global Period 01.07.2014 – 30.06.2015 Media types [Twitter | Facebook | Facebook Pages | YouTube | Instagram | Google+ | Weibo | Boards ] Measurement Volume | Sentiment Shopping and Retail Study | Industry | Retail Sectors Rewards & Benefits is the leading aspect of Shopping and Retail conversations for two of five sectors measured, and maintained at least a 25% share in all sectors. Entertainment is the sector where Rewards & Benefits was most discussed, aided by MasterCard’s Priceless Surprises campaign, offering consumers rewards such as pre-sale access, discounts on entertainment, Priceless Gigs, and entertainment rewards when shopping with its products. Of all the sectors measured, Travel is responsible for the highest share of coverage for Convenience. MasterCard’s Global Masabi partnership provides consumers with greater convenience, with mobile ticketing for transit. Consumers also enjoy the fact that they can travel without necessarily needing to take their wallet on every trip, as they can use mobile payments instead. Within Fashion Shopping and Retail payment conversations, consumers spoke most about the aspect of Acceptance & Declines. Conversation largely focused on Acceptance, rather than Declines, as can be expected from the high favourable tone for not only the Fashion sector, but for the other sectors monitored as well. Conversation on Acceptance within fashion generally comes from consumers sharing news of retailers accepting new methods of payment, such as wider NFC acceptance and mobile payment capabilities. Convenience Safety & Security Travel 16% Food 12% Entertainment 9% Fashion 7% Consumer Technology 4% 4% 6% 11% 0% Universe MasterCard, Competitor & Industry Conversations 4% Customer Service 9% 12% 29% 50% Markets Global Period 01.07.2014 – 30.06.2015 92% 94% 41% 10% Favourable tone 94% 34% 19% 15% Rewards & Benefits 26% 31% 37% 11% Costs & Fees 38% 16% 6% 10% 7% 10% 10% Acceptance & Declines 93% 36% 25% Share of aspect coverage [volume] 94% 100% Media types [Twitter | Facebook | Facebook Pages | YouTube | Instagram | Google+ | Weibo | Boards ] Measurement Volume | Sentiment Shopping and Retail Study | Industry | Favourable Tone by Sectors and Regions MEA has the equal highest favourable tone on the topic of travel. MasterCard MEA offer a chance to win cashback when using a card when travelling for retail use, causing sharing amongst consumers. Travel packages are available as Rewards & Benefits to consumers when shopping with various products, also causing consumer sharing on social media. AP had the highest favourable tone in three of five sectors measured. For food, consumers discuss and share available discounts when using emerging technology such as contactless. For Travel, consumers note how taking a credit card abroad makes shopping easier and more convenient. LAC had the highest favourable tone on Entertainment conversations, helped by theatre discounts from MasterCard in Colombia, Qkr! launch in Chile enabling consumers to buy food without leaving their seat, and consumers discussing various presales that are available from various different card issuers. LAC also has the highest favourable tone for the Consumer Technology sector, helped by Microsoft’s decision to accept Bitcoins for app payments and computer games. Travel Food Entertainment Fashion Consumer Technology AP 97% 99% 96% 99% 92% LAC 93% 96% 97% 96% 96% N. America 86% 93% 94% 96% 90% Europe 86% 94% 95% 95% 90% MEA 97% 94% 92% 95% 94% *Values shown are favourable tone Universe MasterCard, Competitor & Industry Conversations Markets Global Period 01.07.2014 – 30.06.2015 Media types [Twitter | Facebook | Facebook Pages | YouTube | Instagram | Google+ | Weibo | Boards ] Measurement Volume | Sentiment Shopping and Retail Study | Industry | Aspects Coverage by Region Rewards & Benefits aspect was responsible for 60% of Shopping & Retail conversation in MEA. Launch of MasterCard competition to win tickets to the Rugby World Cup generated sharing of content on social media. Other payment providers offers also widely shared in the region, such as Visa offering buy one get one free on cinema tickets. MEA consumers also keen for rollout of Apple Pay, and to use it to buy pins on Pinterest. In LAC, Acceptance & Declines takes the highest share of any regions, with 40% of coverage for the aspects included. Extensive consumer conversations on the news that Microsoft will accept Bitcoin for mobile, apps and Xbox shopping. Europe has the greatest share of Costs & Fees coverage compared to the other sectors, with 19% for the aspects included. Users discuss fees of using certain ATM’s to withdraw cash for shopping, of confusion over possible fees from overdrafts when shopping, and consumers frustrated with fees attached to gift cards, particularly with AmEx. Convenience Safety & Security AP 9% LAC 8% N. America 8% Europe 5% 4% 9% 4% 10% 7% 22% Markets Global 24% 60% 50% Period 01.07.2014 – 30.06.2015 15% 47% 19% 7% 0% Universe MasterCard, Competitor & Industry Conversations 7% 12% 16% Rewards & Benefits 40% 40% 19% 12% Costs & Fees 9% 8% 11% 6% Acceptance & Declines 28% 22% 13% MEA Customer Service Share of aspect coverage [volume] 100% Media types [Twitter | Facebook | Facebook Pages | YouTube | Instagram | Google+ | Weibo | Boards ] Measurement Volume Shopping and Retail Study | Industry | Most Positive Aspects by Markets Safety & Security Positive Conversations [%] Convenience Positive Conversations [%] Spain Australia Nigeria USA India France Australia Germany Mexico UK 0% 10% 20% 30% 40% 50% 60% Rewards & Benefits Positive Conversations [%] 0% Japan Japan Canada Australia Netherlands Germany India UK USA 10% Universe MasterCard, Competitor & Industry Conversations 20% 30% Markets Global 40% 50% 20% 30% 40% 50% 60% Acceptance & Declines Positive Conversations [%] USA 0% 10% 60% Period 01.07.2014 – 30.06.2015 0% 20% 40% 60% Media types [Twitter | Facebook | Facebook Pages | YouTube | Instagram | Google+ | Weibo | Boards ] 80% 100% Measurement Volume | Sentiment Shopping and Retail Study | Contents Page • Industry trends for retail and shopping conversation: Aspects Emerging Payments and Core products Retail Sectors • Industry trends for Emerging Payments in retail and shopping conversation: Digital Wallets and In-App Payments (Online shopping) Contactless Payments (Physical shopping) • Competitive performance for retail and shopping conversation: Benchmark Aspects Overall Benchmark for Contactless (Aspects and Geography) MasterPass vs. V.Me / Visa Checkout Shopping and Retail Study | Industry | Digital vs. Contactless Payments Contactless Payments are responsible for a much greater volume of conversation than Digital Payments (Mobile Wallets, In-App Payments) on social media. Contactless Payments also created more opinionated coverage compared to Digital Wallets, with a higher percentage of both positive and negative conversations. Higher volume of conversations around Contactless could be caused by higher adoption & usage, in comparison to Digital Payments. 5% 8% 30% 37% Contactless Digital 65% 81% Contactless 19% Digital 55% Digital versus Contactless SoV Universe MasterCard, Competitor & Industry Conversations Markets Global Period 01.07.2014 – 30.06.2015 Media types [Twitter | Facebook | Facebook Pages | YouTube | Instagram | Google+ | Weibo | Boards ] Measurement Volume | Sentiment Shopping and Retail Study | Industry | Digital Wallets & In-App Payments | Aspects Convenience was the most positively discussed aspect surrounding Shopping and Retail conversations for Digital Wallets & In-App Payments. The Digital Wallets market is predicted to reach over 1 billion users by 2020, with consumers stating their belief that shoppers will use them when it’s convenient. Another user commented that Apple Pay is “awesome (…) because the security and ease of use is the reward he wants, not hackable retail reward E-Wallets.” Rewards & Benefits is responsible for the highest volume in Digital Wallets & In-App Payments. A WSJ article entitled “The Next Step for the Mobile Wallet (…) Loyalty Programs” drove sharing and discussion of the topic on social media. iOS9 supporting retail loyalty cards also generated conversation, with comparisons between Apple Pay (with loyalty program opportunities) and other digital wallets (such as Google Wallet) that do not offer such opportunities. Safety & Security conversations were the most critical for Digital Wallets & In-App Payments conversations on Shopping & Retail, with 9% negative. Critical content was generated largely by consumers sharing fraud news stories, and only a very minor amount of consumers actually shared stories of being targeted by fraud themselves. For example, a BBC news article on Digital Wallet fraud was shared by several users on Facebook. Positive Safety & Security Neutral 53% Customer Service 21% 61% Costs & Fees 35% 71% Rewards & Benefits 49% 75% 0% Markets Global Shares Reach 9% 316 27 1.7m 8% 413 12 599.6k 325 23 1.4m 1% 799 1 773k 1% 1.5k 28 6.7m 3% 791 28 1.5m 4% 28% 50% Convenience Universe MasterCard, Competitor & Industry Conversations 38% 71% Acceptance & Declines Posts Negative 22% 50% Period 01.07.2014 – 30.06.2015 100% Media types [Twitter | Facebook | Facebook Pages | YouTube | Instagram | Google+ | Weibo | Boards ] Measurement Volume | Sentiment | Reach Shopping and Retail Study | Industry | Digital Wallets & In-App Payments | Geographies Europe had the highest percentage of positive tonality, as well as the highest percentage of negative tonality on Digital Wallets & In-App Payments Shopping and Retail conversations. There was excitement amongst consumers for the launch of Apple Pay, and users asking their social circles to recommend interesting apps where they can use inapp purchases with Google Wallet. The launch of Qkr! in the UK allowed users to pay In-App for meals at Wagamamas, with a further rollout of the product to come. The highest volume of conversation came from North America, aided significantly by the launch of Apple Pay in the U.S. in October 2014. As noted on slide 20, Rewards & Benefits and Customer Service are two of the aspects that drive conversation most significantly surrounding Apple Pay. Merchants such as Neimann Marcus adding MasterPass and Visa Checkout gave consumers further e-commerce opportunities to use such products, generating conversations. Consumers also expressed desire for wearables to come with Digital Wallet functionality. In the AP region, Chinese consumers on Weibo were happy that Google Wallet had added the option to pay with PayPal. Another consumer in Indonesia noted the ease of use of Google Wallet for buying paid apps in the Google PlayStore via mobile. Explosion in the adoption of India’s Top Mobile Wallet App Paytm, which hit 25 million users, also drove conversation. Positive Posts Shares Reach Negative AP 18% 77% 6% 859 262 5.2m LAC 17% 77% 5% 253 47 1.5m 4% 7.6k 733 34.2m 7% 908 287 5.2m 7% 145 39 450.7k N. America 12% Europe 84% 27% MEA 66% 22% 0% Universe MasterCard, Competitor & Industry Conversations Neutral 72% 50% Markets Global Period 01.07.2014 – 30.06.2015 100% Media types [Twitter | Facebook | Facebook Pages | YouTube | Instagram | Google+ | Weibo | Boards ] Measurement Volume | Sentiment | Reach Shopping and Retail Study | Industry | Contactless | Aspects Costs & Fees had the highest percentage of positive tonality. From the consumer’s perspective, fees that merchants take on as a result of accepting Apple Pay and credit card payments do not cause them concern. Some consumers spoke witheringly of ‘CurrenC’, the retail industry’s attempt to create a contactless product (that uses QR) – it is seen as a way for retailers to get around the processing fees they currently pay for accepting cards - and Apple Pay. One consumer noted: “So some major retailers refuse to use ApplePay in order to avoid paying the usual credit card fees, opting instead for a less secure and more cumbersome system called CurrenC. Fine. When I shop at Rite Aid, Best Buy, Walmart, etc. I'll just use my credit card.” Convenience is one of the most discussed aspects of contactless conversation, with 14% negative tonality. There was some concern from consumers that the increasingly frictionless nature of payments (particularly contactless) enables impulsive shopping, so people will “buy more useless junk.” Additionally, there was high sharing by consumers of a news story on broken NFC terminals and the lack of retail support that is ‘stifling’ Apple Pay usage. Rewards & Benefits was one of the most vociferously discussed aspects regarding Shopping & Retail conversation on Contactless payments, with high positive tonality. MasterCard’s two Fare Free Friday’s, offering free Tube travel in London for two separate Friday’s in November 2014 generated conversation amongst consumers. Consumers also expressed eagerness for further acceptance of NFC payments so they can receive more rewards by using them more frequently. Positive Safety & Security Neutral Negative 45% Customer Service 55% Acceptance & Declines 7% 48% 31% 37% 14% 56% 7% Posts Shares Reach 467 12 3.0m 505 29 17.9m 346 37 3.2m Costs & Fees 65% 32% 3% 1.5k 72 11.4m Rewards & Benefits 63% 35% 2% 2.5k 758 14.5m 1.6k 153 29.0m Convenience 52% 0% Universe MasterCard, Competitor & Industry Conversations Markets Global 33% 50% Period 01.07.2014 – 30.06.2015 14% 100% Media types [Twitter | Facebook | Facebook Pages | YouTube | Instagram | Google+ | Weibo | Boards ] Measurement Volume | Sentiment | Reach Shopping and Retail Study | Industry | Contactless | Geographies MEA had the highest positive tonality on the Contactless topic. Apple Pay generated significant positivity, despite the product not launching in the market yet, with consumers sharing news on increasing acceptance of the product. Consumers expressing excitement about receiving contactless products from Visa and MasterCard as it makes it “easier for them to shop.” There is some consumer concern that Contactless will make payments too frictionless, causing impulsive and ‘compulsive’ shopping. Much of this content is present in North America, contributing to the 10% negative tonality for the region. However, positive conversations make up 26% of coverage for the region. Loyalty between different Contactless offerings in the region is mixed – some users say they use what is best for them at the time, while others express more brand loyalty to particular products. For example, consumers noting that Samsung Pay will be “compatible with ALL Visa and MasterCard machines. Apple will require merchants to buy new terminals” highlights some consumers’ preference is based on acceptance, and not necessarily based on brand. In Europe, some negativity comes from frustrated consumers talking about selected (and mostly independent) merchants “dumping” contactless payments due to “high charges, unreliable equipment, and contactless that only works occasionally.” Positive conversations were generated as a result of excitement for Apple Pay coming to the UK, and the success of Fare Free Friday in the UK. Positive AP Neutral 21% LAC 73% 17% N. America 76% 26% Europe 64% 30% MEA Universe MasterCard, Competitor & Industry Conversations 61% 40% 0% 51% 50% Markets Global Posts Shares Reach 6% 5.1k 1.5k 166.7m 7% 1.7k 550 25.9m 10% 16.5k 4.4k 231.1m 9% 5.3k 2k 79.0m 9% 745 256 12.2m Negative Period 01.07.2014 – 30.06.2015 100% Media types [Twitter | Facebook | Facebook Pages | YouTube | Instagram | Google+ | Weibo | Boards ] Measurement Volume | Sentiment | Reach Shopping and Retail| Contents Page • Industry trends for retail and shopping conversation: Aspects Emerging Payments and Core products Retail Sectors • Industry trends for Emerging Payments in retail and shopping conversation: Digital Wallets and In-App Payments (Online shopping) Contactless Payments (Physical shopping) • Competitive performance for retail and shopping conversation: Benchmark Aspects Overall Benchmark for Contactless (Aspects and Geography) MasterPass vs. V.Me / Visa Checkout Shopping and Retail Study | Benchmark | Aspects MasterCard drove the majority of Costs & Fees coverage in shopping and retail conversations, with news-sharing of processing fees being capped on debit and credit cards. Additionally, consumers in Australia expressed frustration with PayPass charges, commenting on ALDI Australia charging to use PayPass and surcharges to use PayPass when buying tickets for a cricket game. However, MasterCard’s favourable tone on Costs & Fees Shopping and Retail conversations was 1 percentage point better than the industry. MasterCard led the conversation surrounding Safety & Security, helped by conversations surrounding implementation of tokenisation making mobile commerce apps safer, and posts on Weibo about MasterCard’s ‘smart debit card’ that offers various convenience and safety features. On the topic of Innovation in Shopping and Retail, Visa led the Share of Voice with 53%, helped by Visa & Apple Pay consumer conversation about how to use the product, consumers tweeting about using it to pay for meals, and users tweeting about Visa Checkout. American Express generated the highest volume of conversation on the topic of Rewards and Benefits for the period covered. AmEx offered many rewards for consumers to obtain. This helped generate conversation on social networks, in particular with consumers talking about travel benefits. MA Visa AmEx Safety & Security 31% 23% Customer Service Acceptance & Declines 9% 44% 32% 27% 27% 41% 0% Markets Global Industry Favourable Tone 97% 96% 4% 95% 96% 8% 2% 90% 92% 6% 94% 97% 12% 2% 96% 95% 4%3% 97% 98% 6%1% 97% 97% 12% 2% 12% 33% 29% Costs & Fees Convenience 8% 39% 28% Rewards & Benefits 15% 53% 18% MA Favourable Tone CUP 41% Innovation Universe MasterCard & Competitor Coverage PayPal 28% 15% 34% 38% 50% Period 01.07.2014 – 30.06.2015 13% 100% Media types [Twitter | Facebook | Facebook Pages | YouTube | Instagram | Google+ | Weibo | Boards ] Measurement Volume | Sentiment Shopping and Retail Study | Benchmark | Contactless | Aspects MasterCard led Acceptance and Declines Share of Voice on the topic of Shopping and Retail, with favourable tone 3% lower that the industry average. Critical tone from consumers was primarily due to a lack of acceptance of PayPass. There was also some consumer criticism of retailers who use the contactless functionality of cards without asking consumers. High volume of favourable tonality came from Russia, where consumers commented on Acceptance of PayPass for Travel. MasterCard’s mandate that every European merchant will accept Contactless by 2020 also generated conversation. Rewards & Benefits conversation on Shopping and Retail Contactless conversations is led by Visa. In the U.S., the Phoenix Suns basketball team provided consumers with rewards for using Apple Pay. In Malaysia, Maybank offered the opportunity to win shopping vouchers and Visa payWave cashback (generating 400+ Retweets). On the topic of Innovation, MasterCard’s favourable tone is 6% better than that of the industry. Consumers celebrated products like PayPass making Opener Festival in Poland cashless, pushed retailers and sectors (such as Girl Guide Cookies) to innovate (so they can use PayPass), and those consumers working in retail expressed hopes for further adoption (“Dear every customer now and in the future: paypass will not kill you but your attitude might #retail”). MA Visa AmEx Safety & Security 31% 31% Customer Service 37% 33% Acceptance & Declines 38% Rewards & Benefits 23% Convenience 30% Markets Global Industry Favourable Tone 1% 97% 100% 2% 96% 90% 11% 1% 93% 90% 94% 97% 1% 97% 96% 9% 1% 98% 99% 11% 2% 98% 98% 18% 22% 25% 24% 34% 6% 3% 11% 14% 13% 57% 42% 0% 7% 9% 57% Costs & Fees MA Favourable Tone CUP 43% Innovation Universe MasterCard & Competitor Coverage PayPal 10% 37% 50% Period 01.07.2014 – 30.06.2015 8% 100% Media types [Twitter | Facebook | Facebook Pages | YouTube | Instagram | Google+ | Weibo | Boards ] Measurement Volume | Sentiment Shopping and Retail Study | Benchmark | Contactless| Geographies MasterCard held a significant Share of Voice lead on contactless conversations in LAC and MEA in particular, and held a 7% lead over Visa in Europe for the timeframe measured. In Europe, FareFreeFriday in London allowed consumers to travel for free when paying with Contactless on two separate Fridays in November 2014. In LAC, PayPass Maestro went live in 2014 in Colombia, generating conversation. In MEA, consumers shared merchant posts on using contactless payments for travel, and were curious about the security of PayPass payments. Visa dominated Shopping and Retail Contactless conversations in North America. This was significantly aided by Visa using four NFL stars to demo Apple Pay & Visa functionality at the NFL Shop at the Super Bowl. Players tweets also generated a high level of engagement. Visa also had the highest Share of Voice in the AP region with extensive PayWave discussion on the HongKongCard.com forum related to when signatures may be required. In Australia, a prosecution where a consumer used a PayWave card to go on a spending spree generated conversation. There was also a significant level of conversation over Security, with consumer anger when shop assistants try to grab PayWave cards as only the consumers need to hold the cards when paying contactlessly (assuming the payment terminal is accessible). MA AP AmEx 34% LAC PayPal 21% Europe 2% 5% 13% 18% 63% 41% MEA 0% 34% 11% Period 01.07.2014 – 30.06.2015 5% 17% 8% 27% 50% Markets Global 9% 11% 59% Industry Favourable Tone 97% 95% 100% 96% 94% 92% 94% 91% 95% 93% CUP 50% 59% N. America Universe MasterCard & Competitor Coverage Visa MA Favourable Tone 3% 11% 100% Media types [Twitter | Facebook | Facebook Pages | YouTube | Instagram | Google+ | Weibo | Boards ] Measurement Volume | Sentiment Shopping and Retail | Benchmark | MasterPass vs. V.Me / Visa Checkout MasterPass led V.Me / Visa Checkout Safety & Security in favourable tonality, with Visa’s mobile products associated with 5% more negative coverage on the topic than MasterCard’s. A high amount of news sharing from issuers and merchants on social media, noting MasterPass as a fast, safe and secure payment gateway for online shopping. Visa also saw critical conversations from social media on Safety & Security due to consumers complaining to merchants about poor integration of Visa Checkout (“Postcode bug and payment method validation break it entirely”), and long approval wait times (“When my credit card fraud protection works against me.”). MasterPass outperformed V.Me / Visa Checkout by two percentage points on the aspect of Convenience. Criticism towards Visa came from users tweeting at merchants telling them they think Apple Pay is easier to use than Visa Checkout. The launch of Qkr! With MasterPass boosted favourable tone, with the app described by different consumers as “very simple, intuitive, smooth, frictionless, and fast.” V.Me / Visa Checkout favourable tonality on Customer Service outperformed MasterPass by 5%, although both were under 90%. MasterPass customer service came under criticism from several users, while Visa’s Customer Service created less critical coverage over the timeframe covered. Favourable Tone 99% Safety & Security 94% 99% 98% Innovation 83% Customer Service 88% 98% Acceptance & Declines Visa 98% Costs & Fees 93% 99% 99% Rewards & Benefits 98% Convenience 96% 80% Universe MasterPass, V.Me & Visa Checkout Coverage MA 95% Markets Global 90% Period 01.07.2014 – 30.06.2015 100% Media types [Twitter | Facebook | Facebook Pages | YouTube | Instagram | Google+ | Weibo | Boards ] Measurement Volume | Sentiment | PRIME Contact | Offices and Team Leads PRIME RESEARCH CENTER NORTH AMERICA Ann Arbor, USA PRIME USA New York, USA PRIME RESEARCH CENTER EUROPE Mainz, Germany PRIME UK Oxford, Great Britain PRIME SWITZERLAND Zurich, Switzerland PRIME RESEARCH CENTER ASIA Shanghai, China PRIME INDIA New Delhi, India PRIME SOUTH AMERICA Montevideo, Uruguay PRIME BRAZIL Sao Paulo, Brazil PRIME RESEARCH CENTRE U.K. 58, St. Aldates | Oxford, OX1 1ST | UK Chi-Chi Millaway| Project Director | Global Operations Dave Reynolds | Project Manager Phone: +1.212.981.1172 Email: [email protected] Phone: 01865 324 910 Email: [email protected]
© Copyright 2026 ExpyDoc