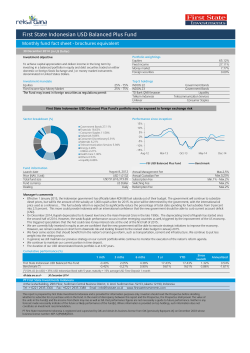
Quarterly Commodity Outlook ABN AMRO Group Economics Commodity Research July 2014 Overcapacity dampens commodity price expectations We remain positive on the global economy going forward. We see headwinds fading for the emerging markets and expect general investor sentiment to remain constructive. This will mainly support cyclical commodities with a relatively tight demand and supply balance, especially if this is not already reflected in prices. While we maintain a positive outlook on base metals, we anticipate lower oil and precious metals prices. We expect ample oil supply and a lower risk premium to push oil prices down. In addition, we foresee the Fed becoming more hawkish. This will lead to an upward adjustment in interest rates for 2015, which could have a substantial negative impact on precious metals and oil prices. Meanwhile, agriculturals and soft commodities may feel the impact of a potential El Niño, but the chances of a strong EL Niño have diminished. 3-month view WTI Brent Nat. gas (HH) Nat. gas (TTF) Energy: Fears of shortages in well-supplied markets long-term view Although geopolitical tensions dominated the energy markets in recent months, the overall impact on energy prices was very limited. In fact, oil prices are trading below pre-Iraq-crisis levels and European gas prices dropped more than forty per cent despite tensions between Russia and Ukraine. However, futures prices show a different picture, reflecting market concerns about the future of the oil and gas supply. Seasonal winter demand could hurt the well-filled gas stocks, while future production disruptions could pose a threat to required future oil production. Precious metals: Lower investor demand to hurt prices Gold Silver Platinum Palladium Precious metals have performed strongly year-to-date but this is unlikely to continue. The cocktail of higher US rates, no substantial inflation fears and a stronger US dollar in an environment of positive sentiment will prove negative for gold and silver. Platinum and palladium should be less negatively affected as long as the prospects for industrial demand and car sales remain good. However, it is likely that a gold selloff will have a more substantial negative impact on both platinum and palladium due to large investor overhang in these precious metals. Base metals: Robust sentiment is supporting prices Aluminium Copper Nickel Zinc Alongside the pick-up in the global economy, conditions in most metals markets are pointing up. Concerns over the Qingdao probe have slowly subsided and investor jitters decreased further once solid macro-economic figures on the Chinese and US economies were released in early July. Going forward, the Chinese government is expected to implement more stimulus measures in order to meet its growth objective. This will have a positive impact on global base metals markets. As a result, base metals have re-emerged among the favourite picks of investors. The two jewels in the base metals complex are currently aluminium and zinc. Ferrous metals: Weak price environment on overcapacity Steel (HRC) Iron ore Coking coal Wheat Corn Soybeans Sugar Arabica Coffee Cocoa The weak price environment lingers on in most ferrous metals markets due to overcapacity. The global HRC steel price has lost 3% since the start of 2014, while prices for steelmaking raw materials have experienced double-digit declines. There is currently more than sufficient iron ore in the market to service demand, and oversupply is weighing heavily on prices. In coking coal, supply is outpacing underlying demand, which is causing price weakness. Only further mine closures and (significant) capacity cuts could trigger a recovery in the current low-price environment. Agriculturals: Weather related events set the tone Markets drew up the balance sheet of the ultimate impact of the extreme drought in Brazil and the copious rain/snow in the United States at the start of the year. As a result, coffee and corn prices stabilised. Meanwhile, prices declined for wheat and other grains in the slipstream after the stabilisation of the political tensions between Ukraine and Russia. The focus is now shifting towards the possible effects of other weather-related events, such as the drier-than-normal Indian monsoon and the potential of an El Niño weather phenomenon. Although many markets are oversupplied, prices continue to rise due to technical and speculative buying. decrease by 11% or more decrease betw een 5% and 10% price movement betw een -4% and +4% increase betw een 5% and 10% increase by 11% or more - Short term: our three month outlook versus spot rate on July 22nd. - Long term: 2016 average forecast price versus 2014 forecast price. 2 Quarterly Commodity Outlook | 25 July 2014 ABN AMRO Group Economics ABN AMRO forecasts ABN AMRO Commodity Price Forecasts Spot rate 22 July Average price Q22014 3m 6m 12m (end of Oct) (end of Jan) (end of Jul ’15) 2014 2015 2016 (yr avg) (yr avg) (yr avg) 106.74 109.68 105 105 95 105 100 95 104.59 103.39 100 95 90 100 95 90 3.80 4.59 4.50 4.50 4.75 4.50 4.75 5.00 16.30 19.25 21 21 18 21 19 17 1,305.75 1,290.00 1,200 1,100 900 1,250 925 950 20.81 19.61 18.0 16.5 18.0 19.0 18.0 22 1,487.00 1,446.90 1,400 1,300 1,400 1,425 1,400 1,600 872.00 815.24 800 750 800 800 775 800 1,800.46 2,050 1,930 1,975 1,825 2,050 2,200 Energy: - Brent (USD/barrel) - WTI (USD/barrel) - Gas HH (USD/mmBtu) - Gas TTF (EUR/MWh) Precious metals: - Gold (USD/oz) - Silver (USD/oz) - Platinum (USD/oz) - Palladium (USD/oz) Base metals: - Aluminium (USD/t) 2,024.75 0.92 (USD/lb) - Copper (USD/t) 7,037.50 (USD/t) 3.08 19,027.00 18,466.06 8.63 8.38 (USD/lb) - Zinc 2,360.25 (USD/t) 6,794.45 3.19 (USD/lb) - Nickel 0.82 1.07 (USD/lb) 2,071.25 0.93 7,140 3.24 18,300 8.30 2,230 0.94 1.01 0.88 7,230 0.93 7,300 3.24 19,000 7,050 3.28 18,900 8.39 2,200 0.83 1.02 7,200 3.20 17,500 8.57 2,275 0.93 1.03 7,200 3.27 18,000 7.94 2,150 0.99 3.27 19,000 8.17 2,250 0.98 8.62 2,400 1.02 1.09 Ferrous metals: - Steel (global) (HRC; USD/t) - Iron ore (fines, USD/t) - Coking coal (USD/t) 578.28 592.20 570 560 575 570 565 575 95.36 103.28 97 100 100 104 98 95 105.00 113.23 107 115 120 118 123 129 548.75 663.31 525 525 - 550 - - 368.25 480.75 375 375 - 400 - - 1,184.00 1,468.05 1,150 1,050 - 1,200 - - 18.67 17.99 19.00 19.00 - 18.00 - - 172.10 187.93 180 170 - 175 - - 3,108.00 3,008.15 3,100 3,200 - 3,025 - - Agricultural: - Wheat (USDc/bu) - Corn (USDc/bu) - Soybean (USDc/bu) - Sugar (USDc/lb) - Arabica coffee (USDc/lb) - Cocoa (USD/t) 3 Quarterly Commodity Outlook | 25 July 2014 ABN AMRO Group Economics Table of contents Macro-economic 4 Commodity top down 5 Energy 6 Precious metals 8 Base metals 10 Ferrous metals 12 Agriculturals 14 Macroeconomic indicators 18 Historic commodity prices 19 Contributors 21 Disclaimer 22 Quarterly Commodity Outlook | 25 July 2014 ABN AMRO Group Economics Macro-economics Marijke Zewuster, tel. +31 (0)20 383 05 18 Stronger, more convincing growth ahead • Growth in the US will accelerate from the second quarter • Emerging Markets will benefit from stronger growth in the advanced economies • Downside risks are abating Manufacturing PMI surveys (index) 65 60 55 50 45 40 35 30 06 07 08 09 US 10 11 12 Eurozone 13 14 China Source: Thomson Reuters Datastream Asia: export growth gaining momentum %, yoy 4 10 8 6 More benign outlook Previous impediments to demand are easing and risks to the global economy related to China’s transition and the Fed’s exit from unprecedented stimulus appear to be abating. Still, we have revised down our world GDP forecast for this year, but this is largely a backward-looking revision. It relates to a very weak first quarter in the US, which was partly due to bad weather. Growth from the second quarter onward is likely to be impressive, which is reflected in our elevated average annual economic growth forecast for next year. Positive sentiment has also gained ground in Asia, as firmer demand in the advanced economies is leaving its mark on emerging market exports. Fears of a hard landing in China have receded. The rollout of policy measures to reduce the impact is starting to pay off and the fine-tuning of policies will likely continue as the reform path is still long. We have kept our 2014/15 growth forecast unchanged at 7.5% and 7%, respectively. Emerging Asia remains the fastest growing emerging region (6.1%), followed at a respectable distance by Latin America (1.9%) and emerging Europe (1.6%). 4 Source: ABN AMRO Group Economics Downward risks decreasing, but not gone Downward risks may have fallen in recent months, but they remain clearly present. If the Fed exit from monetary stimulus turns out to be more abrupt than we expect and bond yields in advanced economies rise sharply, this could trigger a fresh round of capital outflows in emerging markets. Another risk stems from the strong debt build-up in several emerging markets, including China. A potential flare-up of (geo)political unrest is another risk (Ukraine, Iraq). A different type of risk stems from the formation of a possible strong El Niño. In the past, a strong El Niño (1982/83 and 1997/98) coincided with episodes of debt crisis in commodity-exporting emerging countries, but stronger economic fundamentals now seem to have clearly diminished this risk. And the impact of a possible El Niño on global economic growth also appears to be limited. Still, for certain countries it could pose a downward risk. According to a recent study from the University of Cambridge and the IMF, an El Niño event leads to a temporary reduction in economic activity in countries like Australia, Chile, Indonesia, India, Japan, New Zealand and South Africa. It could also lead to temporary higher (food price) inflation and increased social unrest. Upside risks to our forecast: Downside risks to our forecast: • • 2 0 -2 -4 -6 China S-Korea First quarter 2014 India Taiwan Second quarter 2014 Source: Thomson Reuters Datastream ABN AMRO GDP forecasts (% yoy) 2011 • • 2012 2013 2014 2015 China: 9.3 7.7 7.7 7.5 7.0 US 1.8 2.8 1.9 1.8 3.8 Eurozone 1.6 -0.6 -0.4 1.3 1.8 World 4.0 3.0 2.9 3.2 3.8 EM Asia 7.4 6.1 6.1 6.1 6.0 EM Europe 4.8 2.1 1.7 1.6 2.7 Latin America 4.6 2.8 2.4 1.9 3.0 Fed keeps rates on hold longer than anticipated Stronger-than-forecast Chinese economic performance Stronger return of confidence • • Increased risk aversion due to abrupt Fed exit Weaker-than-expected Chinese economic growth Geo-political tensions 5 Quarterly Commodity Outlook | 25 July 2014 ABN AMRO Group Economics Commodity top down Georgette Boele, tel. +31 (0)20 629 77 89 Diversity among commodities • CRB index gave back gains on lower oil, grains and soft commodity prices • Divergence in commodities continues: positive on base metals but negative on oil and precious metals • El Niño could impact agricultural and grain crops Divergence among commodities continues… The CRB index was up around 11.8% from the start of the year until 25 June. The main contributor to the rally in Q2 was higher oil prices. However, the oil price rally came to a halt in June, dragging down the index, which has given back more than 4% of its gains since end-June. What is more, the sell-off in soft commodity and grain prices also had a substantial negative impact on the overall index. Lower oil, grain and soft commodity prices have more than offset the rise in base metals and precious metals. For example, base metals and the more cyclical precious metals received strong support on the outlook for a stronger US and global economy. On the other hand, gold prices have moved higher on safe haven buying and inflation fear demand. Performance individual commodities Q1 vs Q2 20.1% Nickel 10.6% Zinc 9.1% Palladium 6.3% Aluminium Copper 5.9% Sugar 5.7% Platinum 5.6% Silver 5.6% Cocoa 5.1% Oil-WTI 4.4% Oil-Brent 4.4% Gold 3.1% Nat. Gas (HH) -0.9% Global steel (HRC) -1.6% -4.5% Coking coal -5.0% Coffee -9.3% Soybeans Wheat Corn -15.2% -17.1% Iron ore -19.6% Nat. Gas (TTF) -20.3% -60% -40% -20% commodity performance Q2 0% 20% 40% 60% commodity performance Q1 Source: Thomson Reuters Datastream Commodity indices 2010 2011 2012 2013 22 July 2014 332.80 305.30 295.01 280.17 297.35 3,896 3,627 3,700 3,534 3,590 CRB: - index RICI: - index Source: Bloomberg Upside risks to our forecast: • • • Stronger global economic growth Supply disruptions Adverse weather conditions …and is likely to abate As highlighted on the macro page, we remain positive on the global economy going forward. We see headwinds fading for the emerging markets and expect general investor sentiment to remain constructive. This will mainly support cyclical commodities with a relatively tight demand and supply balance, especially if this is not already reflected in prices. We remain positive on base metals. In contrast, we anticipate lower oil and precious metal prices. In the case of oil prices, ample supply and a lower risk premium will push prices down in our view. In addition, we expect the Fed to become more hawkish, leading to an upward adjustment in interest rates for 2015, which could have a substantial negative impact on certain commodity prices. One example is precious metals, which we judge will be the most negatively affected. In addition, oil prices could also feel the pinch. Base metals will likely prove to be more resilient as they are more leveraged to the Chinese economy. Meanwhile, agriculturals and soft commodities may well feel the impact of El Niño. This could damage corn, coffee and sugar crops while supporting soybean crops in South America. Australia’s wheat crop could be impacted by drought. Moreover, if El Niño occurs, it could bring dry weather to India, threatening sugar and cotton crops. Lower income from agriculture would result in less money being available for auspicious ceremonies and weddings. As a result, demand for gold could drop unless inflation fears sharply increase. Downside risks to our forecast: • • • Weaker economic growth More aggressive rate hikes by the Fed Sharp deterioration in investor sentiment. Quarterly Commodity Outlook | 25 July 2014 ABN AMRO Group Economics Energy: Brent, WTI, Henry Hub, TTF Hans van Cleef, tel. +31 20 343 46 79 Fears of shortages in well-supplied markets • Geopolitical tensions have increased worries, but the overall impact on energy prices was limited • Tensions are only reflected in oil and gas spot markets… • … as uncertainty about impact of low-investment environment keeps future prices lifted Price index oil 2014 115 index (1 Jan 2014 = 100) 110 105 100 95 90 Jan Feb Mar Apr Oil: WTI May Jun Oil: Brent Jul May Jul Source: Thomson Reuters Datastream Price index gas 2014 index (1 Jan 2014 = 100) 200 150 100 50 0 Jan Feb Mar Apr Gas: Henry Hub Jun Gas: TTF Source: Thomson Reuters Datastream World oil supply and demand 93 91 89 87 mb/d 6 85 83 2008 Source: IEA 2009 2010 Demand 2011 2012 2013 Supply 2014 Geopolitics: increased tensions, limited impact In recent months, geopolitical tensions have dominated energy markets. As ISIS (the Islamic State in Iraq and Syria) took control of a large area in north-west Iraq, market anxieties increased. Nevertheless, Iraq was able to keep its oil production and exports up and running as the largest oil fields are situated in the south. The fact that ISIS was not able, or willing, to expand its area of control helped ease oil investors’ concerns somewhat. Therefore, despite increased uncertainties concerning the secondlargest OPEC oil producer, the impact on oil prices was relatively limited. The main reason was that ISIS was not attacking major oil fields in southern Iraq, as well as the fact that the international community – particularly SaudiArabia – guaranteed the global oil supply. After Libya announced the restart of two important oil terminals, prices declined even further. As a result, the earlier rise of the risk premium disappeared. The most important driver for the gas markets was the geopolitical strain between Russia and Ukraine. After the annexation of Crimea and the increased tensions along the Russia/Ukraine border, investors became more and more worried about the continuation of gas deliveries from Russia to Europe. As talks continue regarding the issue of Ukraine’s gas payments to Russia, hopes are high that a proper solution can be found before the winter season starts and gas demand increases. The impact of geopolitical tensions on European gas prices was very limited. In fact, well-filled inventories and weak seasonal demand resulted in an almost 50% drop in the TTF gas futures price (1st contract). Futures show a different picture One similarity between oil and (European) gas longer-term futures is that the price development differs from the movements in the spot, or near-term (first futures contract) price. For comparison purposes, we will take the December 2016 contracts. While oil spot prices dropped to pre-Iraq crisis levels, the December 2016 price only nudged slightly lower. As a result, the spread between the first and the December 2016 contract narrowed to USD 7/bbl, from the USD 12/bbl average spread during the first half of 2014. This implies that the market could still be nervous about the future oil supply. Not so strange if one considers that Iraq was penciled in for roughly 40% of the future supply growth after 2016. Iraq had the ambition of tripling its oil output over the next few years. However, the present crisis may impact the investment needed to raise, or even maintain, oil production and could therefore pose a Quarterly Commodity Outlook | 25 July 2014 ABN AMRO Group Economics Energy: Brent, WTI, Henry Hub, TTF Spread TTF gas and Brent oil 1st vs 30th contract futures 130 34 120 29 110 24 19 USD/bbl 90 80 Jan-13 14 Jul-13 Jan-14 Eur/Mwh 100 Jul-14 Brent oil 1st contract (lha) Brent oil 30th contract (lha) TTF 1st contract (rha) TTF 30th contract (rha) Source: Thomson Reuters Datastream ABN AMRO price forecast (Index) 250 forecast ABN AMRO 200 150 index (2005=100) 7 100 50 0 05 06 07 08 09 10 11 12 13 14 15 16 Oil: WTI Oil: Brent Gas: Henry Hub Gas: TTF Source: Thomson Reuters Datastream, ABN AMRO ABN AMRO price forecast table 3m 6m 12m (end of Oct) (end of Jan) (end of Jul ‘15) 105 105 100 2014 avg 2015 avg 95 105 100 95 90 100 95 4.50 4.50 4.75 4.50 4.75 21 21 18 21 19 Brent: - USD/barrel WTI: - USD/barrel Gas HH: - USD/mmBtu Gas TTF: - EUR/MWh Source: ABN AMRO Group Economics threat to the required level of production in the future. While longer-term future prices for oil found more support than spot prices, a similar price development, but with a completely different meaning, emerged for gas. While TTF spot prices (1st contract) sharply declined, the December 2016 contract traded within narrow ranges. The current large inventories will have a less significant impact on the supply/demand balance at the end of 2016. After all, gas demand is largely affected by weather conditions. With the seasonally stronger winter demand for 2014/2015 and 2015/2016 still far away, it is almost impossible to tell whether current large stocks will still be in place. This is the main reason that December 2016 prices for gas did not decline. The fact that long-term futures prices were not able to appreciate either, suggests that a protracted conflict between Russia and Ukraine, affecting Russian gas deliveries to Europe, is seen as unlikely. Gas: Differences between US Henry Hub and NL TTF US Henry Hub gas prices also unexpectedly eased during recent weeks. Cooler weather has slowed seasonal summer (air conditioning) demand, providing an opportunity for rebuilding inventories after the extremely harsh winter. Although US natural gas prices are still trading within a moderate rising uptrend, the lower band of this range could be tested in the coming weeks. While such a test cannot be excluded, we expect the rising uptrend to remain intact due to the increase in economic growth-driven demand. We maintain our view of a longerterm moderate decline in TTF prices based on a decoupling of oil prices. Nevertheless, since the – mainly speculative-driven – downward movement of the TTF price went so extremely fast, we expect a significant near-term upwards correction. Such a correction could emerge as soon as seasonal demand starts to pick up, resulting in a draw from gas inventories and profit-taking on recent speculative short positions. Since this only affects the near-term contracts, it will not have a significant impact on the competitive (dis)advantages between European and US (chemical) industry. Ample supply to meet rise in demand Until 2016, we still expect ample global supply to meet the rise in global demand for both oil and gas. Therefore, upside risks – which could have increased in the past months – will not have a significant supportive effect on prices in this forecast period. Whether these influences will be seen in the longer run strongly depends on future developments in demand (economic growth versus efficiency and changes in the energy mix) and supply (higher investment costs or lower investments in both the oil and gas industries, for instance as a possible result of geopolitical tensions, versus technological developments). Upside risks to our forecast: Downside risks to our forecast: • • • • Geopolitical risks escalate, resulting in supply disruptions Weather related events resulting in lower supply Faster-than-expected economic recovery boosts demand • • Geopolitical tensions diminish: lower risk premium USD rallies faster and more than expected Economic growth (demand) fails market expectations Quarterly Commodity Outlook | 25 July 2014 ABN AMRO Group Economics Precious metals: gold, silver, platinum, palladium Georgette Boele, tel. +31 20 629 77 89 Lower investor demand will hurt prices • Precious metals have shown a strong performance year-to-date, but this is unlikely to continue • Higher US dollar and US rates will have negative impact on precious metals • Tighter markets will dampen the downside in platinum and palladium Strong performance unlikely to continue Price index precious metals 2014 Palladium prices have shown the strongest performance 130 among the precious metals year-to-date, leaving all the 125 others (even platinum) far behind. Market conditions in index (1 Jan 2014 = 100) 120 palladium were substantially tighter compared to platinum 115 (see last graph below). Moreover, platinum has a higher 110 sensitivity to gold prices, which came at times under some 105 pressure, hurting platinum prices as well. So far this year, 100 gold prices have defied market expectations by moving 95 higher instead of lower. For starters, this was due to the 90 Jan Feb Mar Apr May Gold Platinum Jun Jul Silver Palladium fairly robust demand for gold in China at the start of the year. Moreover, geo-political uncertainty has helped gold as a traditional safe haven asset. In addition, dovish rhetoric by the US Federal Reserve continued and weaker Source: Thomson Reuters Datastream US economic data in Q1 hurt US dollar sentiment across the board, including versus gold. Gold demand categories 6,000 Sensitivity to the US dollar and US rates Gold generally has a strong negative relationship with the US dollar. Moreover, it has a tendency to fall under 4,000 pressure when US interest rates rise, US equity markets rally and investor sentiment remains constructive (low or 2,000 Mt lower VIX). Silver often trails gold behaviour in such an environment. Platinum is frequently negatively affected 0 when gold prices come under pressure, while palladium is the only precious metal that closely follows the global -2,000 05 06 07 Jewellery Bar & coins 08 09 10 Industrial 11 12 13 14 Official sector ETF + CTFC economic cycle and therefore has the closest link to base metals. Our base scenario is that the US economy will accelerate strongly, the US dollar will rally and investor sentiment Source: Thomson Reuters GFMS, ABN AMRO will remain positive despite the upward adjustment in expectations about the future path of Fed interest Supply, demand balance palladium rates. Financial markets are significantly underestimating the likely upside for US rates next year. 12,000 We therefore see upside for short rate expectations and the dollar in the coming months. The cocktail of higher US 9,000 rates, no substantial inflation fears and a higher US dollar 6,000 in an environment of positive sentiment will prove negative 3,000 for gold and silver. Platinum and palladium should be less Moz 8 negatively affected as long as the prospects for industrial 0 demand and car sales remain good. However, it is likely -3,000 that a sell-off in gold will have a more substantial negative impact on both platinum and palladium, because of large -6,000 2000 2002 2004 2006 2008 2010 2012 2014 f Supply Demand Source: Thomson Reuters GFMS, ABN AMRO Balance investor position overhang in these precious metals. Quarterly Commodity Outlook | 25 July 2014 ABN AMRO Group Economics Precious metals: gold, silver, platinum, palladium Weighted average total cash costs of gold 900 750 600 USD/ounce 450 300 150 0 2009 2010 2011 2012 2013 Weighted average cash costs Source: Bloomberg, ABN AMRO ABN AMRO price forecast (index) 800 forecast ABN AMRO 700 600 index (1999=100) 9 Tighter conditions for platinum and palladium… For five months, strikes at South African mining companies have seriously hurt mine output. The companies have compensated the short-fall in production by selling out of inventories. The strikes came to an end on 24 June and it will take approximately three months before production is restored to more normal levels. Expectations are that strikes this year have reduced global platinum production by more than 20% and global palladium production by 10%. This has significantly tightened market conditions, not least because global car sales and industrial demand have improved and investors continued to invest in these precious metals. As a result, it is likely that both the platinum and palladium markets will experience a supply shortage this year. However, in our prognoses for 2014 we have taken into account that investors will reduce their positions in both precious metals. This will ease market conditions. Platinum mining companies in South Africa are currently in a rationalisation phase to make operations profitable again. In 2013, total cash costs of the two biggest platinum and palladium mining companies were between USD 1,750 and 1,900 per ounce (for platinum). It is likely that the five-month strike has pushed these costs even higher. 500 …not so for gold 400 In 2013, the gold mine supply was abundant and we 300 expect this to continue through 2014. In general, the 200 current gold price remains attractive enough to continue 100 production. However, the total supply will be lower as we 0 anticipate a lower gold scrap supply. For 2015, we foresee 99 01 03 05 07 09 Gold Platinum 11 13 15 Silver Palladium similar developments on the supply side. But it is likely that the sharp drop in gold prices we expect for 2014 and 2015 (mainly because of lower investment demand) will prompt mining companies to close unprofitable mines. Therefore, Source: Thomson Reuters Datastream, ABN AMRO supply will fall further in 2016. But as we expect supply to outstrip total demand in 2014 and 2015, the pressure on prices will remain. For 2016, we foresee a price recovery, ABN AMRO price forecast table supported by lower mine supply and strong demand. 3m 6m 12m (end of Oct) (end of Jan) (end Jul of‘15) 1,200 1,100 900 2014 avg 2015 avg 1,250 925 total cash costs of mining companies that report financial Gold: - USD/oz 18.0 16.5 18.0 19.0 18.0 1,400 1,300 1,400 1,425 1,400 Platinum: - USD/oz Palladium: - USD/oz data. This group of companies accounts for roughly 55% of annual mine supply. The total cash cost is still far below Silver: - USD/oz The first graph on the left shows the weighted average of 800 750 800 800 775 the current gold price, which means there is room for gold prices to fall before mining companies sharply adjust production. As a result, it unlikely this will provide price support in 2014 and 2015. On the contrary, the prospect of lower gold prices could motivate mining companies to Source: ABN AMRO Group Economics hedge again, resulting in more gold coming to the market. Upside risks to our forecast: Downside risks to our forecast: • • • • Inflation fears trigger gold buying Fed on hold for longer, supporting precious metals Further supply disruption in platinum and palladium • • Risk aversion triggers investors to abandon positions Weaker global economy hurts platinum and palladium Larger-than-expected mine supply Quarterly Commodity Outlook | 25 July 2014 ABN AMRO Group Economics Base metals: aluminium, copper, nickel, zinc Casper Burgering, tel. +31 20 383 26 93 Robust sentiment supporting base metal prices • Investor jitters decreased on solid macro-economic figures from China and the US • Alongside the pick-up in major economies, conditions in most metals markets are improving • The two current jewels in the base metals complex are aluminium and zinc Prices in base metal markets rebound strongly Concerns over the Qingdao probe have slowly subsided and the jitters among investors decreased further once the solid macro-economic figures on the Chinese and US economy were released in early July. As a result, base metal prices increased. But other events also helped to lift prices. The Chinese government announced support measures in order to meet the growth objectives for this year. Metal markets indirectly benefitted from measures such as increased infrastructural spending, support for the property market and local governments. Chinese industrial activity visibly picked up speed. In Europe, industrial production surprised to the downside in May, which was a disappointment for metal markets. Sentiment in the US is positive amongst manufacturers and industrial activity has increased strongly during May by 4.3% yoy. The US industrial production is expected to expand strongly in H2. In addition, residential construction is exhibiting higher growth since the start of 2014, as housing starts have increased by 6% yoy. Investors’ newfound confidence in base metals markets resulted in strong price gains for aluminium and zinc since the start of July (up 4% and 6%, respectively). Prices for copper and nickel also appreciated, but at a slower pace (between 1-2% in the same period). Price index base metals 2014 160 index (1 Jan 2014 = 100) 150 140 130 120 110 100 90 80 Jan Feb Mar Aluminium Nickel Apr May Jun Copper Zinc Jul 08 14 Source: Thomson Reuters Datastream Base metals balance until 2016 5000 4000 3000 '000 tonnes 2000 1000 0 -1000 -2000 98 00 02 04 06 10 12 Aluminium balance Copper balance Nickel balance Zinc balance 16 Source: Metal Bulletin Base metals stocks in weeks of consumption until 2016 40 stocks in weeks of consumption 10 35 6 30 25 20 15 10 5 7 5 11 5 6 6 8 5 4 6 5 4 5 4 5 7 5 6 5 5 3 4 3 2 2 10 10 8 9 9 9 7 7 0 00 02 9 8 7 8 8 8 10 10 11 10 6 7 3 7 4 3 3 3 3 3 3 3 6 3 3 14 13 12 12 12 12 12 12 6 8 4 7 98 7 04 3 3 2 6 06 08 10 12 14 Aluminium stocks Copper stocks Nickel stocks Zinc stocks Source: Metal Bulletin 16 Fundamentally base metal markets are improving Alongside the pick-up in the economies of major metalconsuming regions (China, Europe, US), conditions in most metal markets are pointing up. From a fundamental perspective, conditions in base metals markets have recently improved. With a decrease in base metal refined output (for various reasons, such as permanent capacity shutdowns, maintenance programmes and other problems at production facilities) the outlook for supply has changed (from surplus to deficit). Given the expectation of (full-year) deficits in the period 2014-2016 for aluminium and copper, and generally balanced markets for nickel and zinc, the outlook for the total market balance improved. Total base metals stocks are already decreasing. And inventories of aluminium, copper and zinc at LME warehouses have fallen since last quarter. Aluminium stocks declined ‘mildly’ (by 6.5% since Q2), while stocks of copper and zinc dropped by much bigger numbers: 34.9% and 18.6%, respectively. Nickel stocks, however, increased by 9.9% in the same period. As a result, sentiment in the base metals markets is positive again, which has lifted prices. However, stocks measured in weeks of consumption will remain stable in the period 2014-2016, which will have a Quarterly Commodity Outlook | 25 July 2014 ABN AMRO Group Economics Base metals: aluminium, copper, nickel, zinc China base metal balance until 2016 '000 tonnes 2000 1000 0 -1000 -2000 -3000 -4000 -5000 98 00 02 04 06 08 10 12 14 Aluminium balance - China Copper balance - China Nickel balance - China Zinc balance - China 16 Source: Metal Bulletin ABN AMRO price forecast (index) 700 forecast ABN AMRO 600 500 400 index (1999=100) 11 dampening effect on prices in the forecast period. China is the driving force for metal markets Although from a global economic and fundamental perspective conditions have improved (and are expected to stay solid), much still depends on developments in China. The country accounts for almost 47% of the global base metals demand on average (EU: 17% on average, US 9% on average). The base metals balance for China will remain in negative territory until 2016 for most base metals, which indicates that import demand will probably stay high, as domestic consumption outpaces domestic supply. Demand from China continues to be a key element to monitor and shocks in the country’s metal markets (e.g. the Qingdao probe, the domestic bond default) generally have massive implications for base metal prices. Still, global base metal markets will also benefit from stimulus measures taken by the Chinese government. China has already implemented some stimulus measures and/or policies for the (indirect) benefit of metal-consuming sectors (such as strengthening of the real estate sector and housing). And going forward, the Chinese government is expected to implement more stimulus to meet its growth objective of 7.5% yoy in 2014. This will have a positive impact on base metals market globally. 300 200 100 0 99 01 03 05 Aluminium 07 09 Copper 11 13 15 Nickel Zinc Source: Thomson Reuters Datastream, ABN AMRO ABN AMRO price forecast (actual) 3m 6m 12m (end of Oct) (end of Jan) (end of Jul ‘15) 2,050 1,930 0.93 0.88 7,140 3.24 2014 avg 2015 avg 1,975 1,825 2,050 0.90 0.83 0.93 7,230 7,300 7,050 7,200 3.28 3.31 3.20 3.27 18,300 19,000 18,900 17,500 18,000 8.30 8.62 8.57 7.94 8.16 2,230 2,200 2,275 2,150 2,250 1.01 1.00 1.03 0.98 1.02 Aluminium: - USD/tonne - USD/lb Copper: - USD/tonne - USD/lb Nickel: - USD/tonne - USD/lb Zinc: - USD/tonne - USD/lb Source: ABN AMRO Group Economics Outlook for base metal prices remains positive Base metals are once again among the favourite picks of investors. But the two current jewels in the base metals complex are aluminium and zinc. Overcapacity in the aluminium sector in China is persistent (which will limit a significant price increase), but is expected to fade during 2015. Positive for sentiment is the continuing decrease in inventories. We expect that capacity cuts at high-cost and inefficient (highly polluting) production facilities will increase in the coming years. And prospects for aluminium demand will remain relatively good, with an increase in demand from the automotive sector. Zinc prices are expected to increase further, due to a decrease in production growth figures from existing mines and the prospect of mine closures, in combination with limited new large mining projects in the pipeline and suspended mining on start-up problem with greenfield projects. Demand is also expected to remain robust, with expected increases in output for global automotive, construction and manufacturing sector. In this perspective, we foresee that demand for copper will also remain solid. Chinese copper concentrates imports increased strongly on both a yearly and a monthly basis. Until June, imports of concentrates had already increased by 22% yoy. Therefore we foresee stronger prices for copper, although the pace of the increase is slow relative to other base metals. Meanwhile, the nickel price is currently in a wait-and-see mode. Participants are uncertain, due to the results of the presidential elections in Indonesia and possible softening of the export ban on nickel ore. Upside risks to our forecast: Downside risks to our forecast: • Geopolitical issues and governmental regulations • • Stronger-than-forecast Chinese economic performance Significant cutbacks in overcapacity (China) • • • Funds scaling back interest for base metals Weaker-than-expected growth in Chinese economy Limited producers discipline: oversupply in markets Quarterly Commodity Outlook | 25 July 2014 ABN AMRO Group Economics Ferrous metals: steel (global, HRC), iron ore, coking coal Casper Burgering, tel. +31 20 383 26 93 Weak price environment due to overcapacity • Global steel industry was unable to benefit from the economic optimism in Q2 • Weak iron ore prices increase the risk of default for (private) Chinese iron ore producers • Oversupply remains the biggest hurdle for the ferrous industry and will keep prices soft Price index ferrous metals 2014 110 100 index (1 Jan 2014 90 80 70 60 Jan Feb Mar Apr May Jun Global steel (HRC, avg.) Iron ore (fines) Prime coking coal (Australia) Jul Ferrous metals prices retreat The weak price environment lingers on. The global HRC steel price lost 3% since the start of 2014, while prices for steelmaking raw materials dropped by double digits. Iron ore lost almost 30%, while prices for coking coal weakened by more than 25%. As a result, margins improved for steel mills. But the state of the ferrous industry remains depressed (on overcapacity) and the sector was unable to sufficiently benefit from the economic optimism at the end of Q2 (marked by good data from both the Chinese and the US economies). Hopes are now up for stimulus measures in China. But with the upcoming seasonal slowdown, relatively weak demand levels and persistent supply additions in the ferrous sector, we do not expect significant improvements in market conditions in the short term. Source: Thomson Reuters Datastream Steel production & world trade 50% 40% 30% 20% % yoy 10% 0% -10% 2010 2011 2012 2013 2014 China steel production World steel production (ex. China) World trade US steel prices stable, global price weakness persists Globally, steel market sentiment is still depressed. While steel production increased until May, consumption contracted in many parts of the world. In China and Europe, the declines in HRC prices were relatively strong, namely 5% and 6%, respectively. In the US, HRC prices were fairly stable and concerns about dumping by foreign mills increased. The relatively high price in the US is attracting supplies from foreign mills, which are eager to export their oversupply at lower prices. In any case, the demand outlook for the steel industry is improving: property sales in China stabilised in May and June and home sales in the US are increasing further. In Europe, conditions are slowly but steadily improving. Still, we foresee limited price gains due to continued oversupply in the global steel industry. Source: Thomson Reuters Datastream, PCB, WSA Chinese imports iron ore & steel production 9000 8000 7000 6000 10,000 Mt 12 5000 4000 2010 2011 2012 2013 Chinese imports iron ore Chinese steel production Source: Thomson Reuters Datastream 2014 Iron ore oversupply weighs on prices Up to June, Chinese import demand for iron ore had increased by a significant 19% on a yearly basis. But even with this strong increase in demand by the world’s biggest iron ore consumer, price weakened. Iron ore prices fell sharply in the light of fraud investigations at the Qingdao port into the possibility that the same stocks of iron ore were pledged several times as collateral to get financing. In the end, the effect of the strong Chinese import demand growth probably softened an even stronger drop in iron ore prices. There is currently more than sufficient stock in the international market to service demand and this oversupply weighs heavily on prices. Weak iron ore prices also increase the risk of default for (private) Chinese iron ore producers, who are generally well positioned at the end of the iron ore cost curve. Iron ore production in China has Quarterly Commodity Outlook | 25 July 2014 ABN AMRO Group Economics Ferrous metals: steel (global, HRC), iron ore, coking coal Import coking coal per country 10000 8000 6000 4000 Mt 2000 0 03 04 05 06 07 08 09 10 11 12 13 14 Japan import S. Korea import Germany import China import Source: Thomson Reuters Datastream, Clarksons ABN AMRO price forecast (index) 300 forecast ABN AMRO 250 200 150 index (2006=100) 13 100 50 0 99 01 03 05 Steel 07 09 Iron ore 11 13 15 Coking coal Source: Thomson Reuters Datastream, ABN AMRO ABN AMRO price forecast (actual) 3m 6m 12m (end of Oct) (end of Jan) (end of Jul ‘15) 549 555 97 107 2014 avg 2015 avg 570 570 560 99 96 104 98 109 112 118 123 Steel (global, HRC): - USD/tonne Iron ore: - USD/tonne Coking coal: - USD/tonne Source: ABN AMRO Group Economics already slowed somewhat on the weaker iron ore prices. Given the fragile price environment, we expect that a portion of the high-cost supply in China will be forced to stop production this year. But the amount of cuts will most likely not be sufficient to balance the iron ore market. Stateowned mines (in most cases highly integrated with domestic, state-owned steel mills) will continue to operate, even when iron ore prices fall below their cost base. We therefore think that, given the ample supply and relatively high level of inventories (at ports, mills and mine sites), iron ore prices will soften further this year and next. In addition, there are still new iron ore mining projects in the pipeline, which will come on stream in the coming years. Sentiment is fragile in the coking coal market Steel production in China was up 4.9% yoy until May, but Chinese coking coal demand failed to show comparable growth figures. Chinese import demand for coking coal dropped by 17% yoy up to May. Physical coal demand was mainly serviced by existing inventories at ports. Meanwhile, buyers and traders are not very keen on buying too much material, as they expect prices to weaken further over the coming months. Traders would rather await firmer demand from end-users before placing additional coking coal bookings. At the moment, supply is outpacing underlying demand, which is causing weakness in coking coal prices. Only further mine closures, (significant) capacity cuts in the international coking coal markets, but also strong demand from the steel sector could turn the current low-price environment into one of recovery. So far, we have seen few indications of significant positive changes in market dynamics. On the bright side, however, the availability of coking coal in China is currently at a relatively low level due to the rundown in stocks. This could indicate a possible increase in buying activity for coking coal during Q2 to replenish stocks. Still, the question remains whether this fresh demand could restore balance. We don’t expect any significant increases in demand as buyers are still having trouble raising liquidity to source material. This is due to the more stringent conditions on bank lending in China. But the supply side is also adding to the problem. There is still a large group of producers with surprisingly little incentive to cut capacity. Instead, they are opting for an increase in productivity in order to decrease unit costs (and protect margins) while awaiting better times. Others have cut production and/or mothballed projects, or increased efficiency, which could start to have an effect during H2. However, all in all, we expect that demand for coking coal will remain relatively soft until 2015. Supply growth will outpace demand growth in this period, which means that oversupply will remain an issue. Two years from now, we expect that the market will be fairly balanced and that hence, the outlook for price is more favourable. Upside risks to our forecast: Downside risks to our forecast: • • • • Stronger-than-expected Chinese economic growth Severe supply disruptions due to unfavourable weather Stockpiling strategies by governments • • New mining capacity entering the market Weaker-than-expected Chinese economic growth Limited producer discipline, oversupply lingers on Quarterly Commodity Outlook | 25 July 2014 ABN AMRO Group Economics Agriculturals: wheat, corn, soybeans Frank Rijkers, tel. +31 (0)20 628 64 37 Always take the weather with you • Great weather conditions led to higher production projections for all grains • A severe El Niño seems less likely • Next months, average prices will reach lowest levels in five years Price index agriculturals 2014 150 index (1 Jan 2014 = 100) 140 130 120 110 100 90 Jan Feb Mar Wheat Apr May Corn Jun Jul Soybean Source: Thomson Reuters Datastream 720 250 690 200 660 MT MT Wheat production, consumption and stocks 150 630 100 600 50 570 540 0 07/08 production 09/10 11/12 consumption 13/14 carryover stocks (r.a) Source: IGC 1000 200 800 MT Corn production, consumption and stocks MT 14 150 600 100 400 50 200 0 0 07/08 production Source: IGC 09/10 11/12 consumption 13/14 carryover stocks (r.a) Grain prices collapsed in second quarter After a strong price increase of all grain prices from February to April, prices started to decline from mid-May. The price of wheat rose particularly strongly, increasing nearly 40% since the beginning of the year to its top price of 742 USDc/bushel in May. The reasons behind the strong price increases were the political tensions between Russia and Ukraine, which is a top-five wheat exporter, and bad weather in several important production areas in the US and Canada. Since the weather has changed and the production projections for this season are positive. The wheat prices have since mid-May dropped by more than 40% to the lowest price in a year: 520 USDc/bushel. The prices of corn and soybeans increased since the beginning of the year, between 15 and 20%. And for corn and soybeans, too, favourable production projections prompted a huge price decline from mid-May to a 12month low of 373 USD/bushel for corn and 1,267 USDc/bushel for soybeans Great prospects for crop production In its latest market report, the International Grain Council (IGC) lifted the output projection for all grains. For 2014/2015 it expects wheat production to reach 699 mt. This is a decrease of 1% compared to last season’s alltime high, but is still 21 mt above the five-year average of 678 mt. The elevated production forecasts are due to increases in Chinese, Indian and European projections. Wheat consumption is expected to remain at a level of 697 mt. The demand for feed wheat will likely continue to be capped by attractively-priced corn. Direct use for human food continues to drive most of the annual gain in world wheat demand. With supply and demand expected to be virtually balanced, world wheat stocks are forecast to show little upward change at the end of 2014/2015. The outlook for corn is also positive for the 2014/2015 season. Production is projected at 963 mt, 1% lower than last season’s record but 10% higher than the five-year average of 872 mt. Improved projections in the US and China, assuming good weather conditions, led to higher production forecasts. Consumption of corn is seen reaching a record high level of 950mt. An important reason for this is the expectation of increased feed and industrial consumption in light of the low prices. Demand for corn as human food will remain at the same level worldwide, with a slightly increase in sub-Saharan Africa. Global closing stocks at the end of 2014/2015 are projected to expand for the fourth year in a row, reaching 180 mt, which would be Quarterly Commodity Outlook | 25 July 2014 ABN AMRO Group Economics Agriculturals: wheat, corn, soybeans the highest figure since the late 1980s. MT 350 100 300 MT Soybeans production, consumption and stocks 80 250 200 60 150 40 100 20 50 0 0 07/08 09/10 production 11/12 13/14 consumption carryover stocks (r.a) Source: USDA ABN AMRO price forecast (index) 400 forecast ABN AMRO 350 300 250 200 index (1999=100) 15 150 100 50 According to the United States Department of Agriculture (USDA), the production outlook for soybeans for the 2014/2015 season is tentatively projected to expand by 6% year-on-year, to a record of 305mt. This is the result of increased plantings in the US and an even greater increase in Brazil, despite a decline in China and uncertainty concerning India (as a world top five producer) given the likelihood of an El Niño event. Soybeans consumption is also projected to rise to a record level of 286 mt, boosted by an increase in processing in China and the Americas. With a difference between production and consumption of 19 mt, the carryover stocks will rise for the fourth consecutive year to a level of 85 mt. Drivers in the coming months A possible El Niño will be one of the drivers in the coming months. The impact of El Niño depends on timing, duration and severity. Previous impacts of El Niño has been strongly on corn, with yield losses of 3% and wheat with losses of 1,5%. Meanwhile, an El Niño event historically had a positive effect on soybeans production, which has historically increased over 3% during such an event. However, as the odds of a strong El Niño have diminished, according to the latest projections, the impact on most grains will be minimal. 0 99 01 03 05 Wheat 07 09 Corn 11 13 15 Soybean Source: Thomson Reuters Datastream, ABN AMRO Aside from weather-related news, particularly the development of an El Niño event, there are other important drivers to watch. Speculative long positions could be liquidated on profit-taking especially if funds need cash to fight fires elsewhere. This could be seen in wheat and corn, but soybeans longs could also be cut back as a result of the large oversupply and stable demand. ABN AMRO price forecast 3m 6m 12m (end of Oct) (end of Jan) (end of Jul ‘15) 2014 avg 525 525 - 550 375 375 - 400 1,150 1,050 - 1,200 Wheat: - USDc/bu Corn: - USDc/bu Soybeans: - USDc/bu Source: ABN AMRO Group Economics A third driver is a possible Argentinian default which could have an impact on soybeans production and trade. Our view is that the negative impact would be minimal due to the dependence on export revenues of soybeans. Three-month price forecasts With the market expecting a further increase in production for wheat and corn due to the recent rise in USDA growth rate projections, prices will ease further over the next six months. For both wheat and corn, this will lead to the lowest average annual price in five years in our view. The price for wheat will reach a level of USDc 550/bushel, and the average corn price will decrease to a level of USDc 400/bushel. Meanwhile, the price of soybeans will ease slightly in the coming months. Favourable supply projections and a balance in demand will lead to the lowest average price level in four years, at USDc 1,200/bushel. Upside risks to our forecast: Downside risks to our forecast: • • • • Production risks due to adverse weather in production areas A sharper-than-expected increase in feed demand in Asia Geopolitical tensions in main production areas • • Decline in demand, due to lower growth in China Decrease in the use of biofuels More favourable weather conditions in production areas Quarterly Commodity Outlook | 25 July 2014 ABN AMRO Group Economics Agriculturals: sugar, coffee, cocoa Hans van Cleef, tel. +31 20 343 46 79 Softs marked by weather events • El Niño and Indian monsoon proved supportive for soft commodities • Technical and speculative demand pushed prices higher, despite surpluses • More upside for cocoa, some downside risks for sugar, while coffee could remain range-bound Price index agriculturals 2014 180 170 index (1 Jan 2014 = 100) 160 150 140 130 120 110 100 90 Jan Feb Mar Coffee Apr May Cocoa Jun Jul Sugar Soft commodities weather-oriented Weather-related events had a serious impact on soft commodity prices in recent months. In particular, the extreme drought in Brazil, which impacted the 2014/2015 crop, added major support to Arabica coffee prices. The harvest is now nearly at an end and, as the market draws up the balance sheet, coffee prices have stabilised as the initial negative reactions have subsided. Meanwhile, India’s monsoon rains are more than 50% below the 50year average. Market talks suggest that this will be supportive for sugar cane prices. Nevertheless, given that the water reservoirs are currently full, the immediate effects will be limited. Still, the impact on the next sugar crop could be bigger if the monsoon conditions remain significantly below normal. Source: Thomson Reuters Datastream CFTC non-commercial net positions 250,000 200,000 150,000 100,000 contract 50,000 0 -50,000 2010 2011 Sugar 2012 Coffee 2013 2014 Cocoa Source: Thomson Reuters Datastream Coffee and sugar production vs consumption 200 180 160 140 120 100 Mt 16 80 2000/01 2004/05 Sugar production Sugar consumption Source: ISO, USDA 2008/09 2012/13 Coffee production Coffee consumption Expectations for other 2014/2015 global harvests may change over the coming months given the potential of an El Niño weather phenomenon developing in the second half of this year. Since the first signs of an El Niño event emerged, prices of soft commodity futures - like cocoa and sugar - found support as the risk of lower crop yields increased. If this leads to another period of dry weather in central south Brazil, it could result in lower yields next season. This, in turn, may add even more support to sugar prices. Meanwhile, the expectations for the 2014/2015 coffee harvest also remain cautious. The first signs are less pessimistic than a few months ago. However, a better estimate of the actual effects of the Brazilian drought on next years’ crop (2015/2016) can only be made after the upcoming flowering season and the normal dry season (from September until November). Rising cocoa, sugar prices in oversupplied markets Since reaching a low in January of USD 2,642, ICE cocoa future prices have since appreciated by almost 20% to a three-year high. ICE sugar future prices also rallied by almost 30%. These rallies were mainly driven by technical and speculative aspects and were not reflective of the fundamental market conditions. In fact, after recent strong cocoa production figures in West Africa (both main crop and mid-crop) market expectations are for a small-scale surplus (approximately 20-40,000 tonnes) instead of an 80-100,000 tonne deficit, as earlier prognoses indicated. We expect cocoa prices to continue their uptrend towards USD 3,100/tonne on the back of strong demand. Quarterly Commodity Outlook | 25 July 2014 ABN AMRO Group Economics Agriculturals: sugar, coffee, cocoa Robusta vs Arabica coffee price (2nd contract) 3,000 350 2,500 300 250 2,000 200 1,500 USD/t 100 500 50 0 2009 USDc/lbs 150 1,000 0 2010 2011 2012 2013 Robusta coffee (lha) 2014 Arabica coffee (rha) An oversupply is also expected for raw sugar in the near term. According to the latest International Sugar Organisation (ISO) data, there is a 4.4 million tonne oversupply. Nevertheless, investors still have large net long positions based on expectations of a tight sugar market in 2014/2015. That would be the first deficit year after four seasons of surplus. Unica – the Brazilian sugarcane Industry Association – will revise its outlook at the end of July. Any adjustment may lead to shifts in speculative positions. With the market fearing the worst concerning the Brazilian sugar crop, any positive surprises could result in profit-taking. This, combined with uncertainties about next year’s crop, could keep future prices around the current level. Our three-month outlook is USDc 19/lb. Source: Thomson Reuters Datastream ABN AMRO price forecast (index) index (1999=100) 17 450 400 350 300 250 200 150 100 50 0 forecast ABN AMRO 99 01 03 05 Coffee 07 09 11 Cocoa 13 Sugar Source: Thomson Reuters Datastream, ABN AMRO ABN AMRO price forecast 3m 6m 12m (end of Oct) (end of Jan) (end of Jul ‘15) 19.00 19.00 18.00 180 170 175 2,100 2,150 2,050 3,100 3,200 3,025 2014 avg Sugar: - USDc/lb Arabica Coffee: - USDc/lb Robusta Coffee: - USD/tonne Cocoa: - USD/tonne Source: ABN AMRO Group Economics 15 Arabica versus Robusta Compared to the large price swings in Arabica, the price developments in Robusta have been less pronounced (see graph). After the excellent production in Vietnam, warehouses in Ho Chi Minh City are completely filled. It is estimated that just under one-fifth of the coffee crop is still in the hands of the farmers and will be sold in the coming weeks. Overall, the Robusta market is well balanced. As expected, several roasters have indeed increased their prices, and more will follow in the coming months. As a result of the enormous price decline in Arabica from mid2011 to November 2014, roasters began to see better value in Arabica compared to Robusta, allowing them to accommodate more in their blends. The strong rebound of Arabica prices has not yet been strong enough to persuade the industry to switch back to Robusta. For that to happen, the price of Arabica must remain substantially higher and for a longer period of time. Nevertheless, although demand for Robusta will remain strong, Vietnam will most likely continue to increase its yields in response to recent rally of Arabica prices. Robusta will most likely continue to follow the price developments of Arabica. For now, while the 2014/2015 crop is finalised and in anticipation of the flowering season that will enable evaluation of possible 2015/2016 crop losses, we expect Arabica prices to remain range-bound. Drivers in the coming months In addition to weather-related news, particularly the development of an El Niño event, there are other important drivers to watch. Speculative long positions could be liquidated on profit-taking, especially if funds need cash to fight fires elsewhere. This could be seen in cocoa, but sugar longs could also be cut back as a result of the large oversupply and weak demand. For coffee, new important factors to consider are the changes to warehouse rules effective from September. These have resulted in firmer forward structures for the rest of the year. Upside risks to our forecast: Downside risks to our forecast: • • • • Upcoming crops suffer more damage than expected Another period of serious drought in Brazil Asian demand for cocoa rises faster than expected • • El Niño does not emerge Impact of Brazil’s 2014 drought has faded Funds scale back interest in cocoa and sugar 18 Quarterly Commodity Outlook | 25 July 2014 ABN AMRO Group Economics Macro-economic indicators Macro-economic Forecasts ABN AMRO Group Economics (per 2 July 2014) GDP growth (% y-o-y) US China Japan EU UK Germany World Inflation (CPI, % y-o-y avg) GDP per cap USD 2012 2013 2014e 2015e 2012 2013 2014e 2015e 2013 2.8% 1.9% 1.8% 3.8% 2.1% 1.5% 1.9% 2.1% 53,101 7.7% 7.7% 7.5% 7.0% 2.6% 2.6% 2.5% 2.8% 9,844 1.4% 1.5% 1.5% 1.4% -0.1% 0.4% 2.5% 1.7% 36,899 -0.6% -0.4% 1.3% 1.8% 2.5% 1.3% 0.6% 0.9% 31,571* 0.3% 1.9% 3.0% 2.8% 2.8% 2.5% 1.6% 1.7% 37,307 0.9% 0.5% 2.1% 2.3% 2.0% 1.5% 1.0% 1.3% 40,007 3.0% 2.9% 3.2% 3.8% 3.9% 3.8% 3.9% 3.7% 11,964* * = 2012 Regional Manufacturing PMIs Consumer prices per region (CPI, % yoy) World trade (volume index) and yoy % change Commodity Indices Consulted sources for this publication: Economic forecasts & insights from ABN AMRO Group Economics, Metal Bulletin, CRU, Commodities Now, Mining Journal, Bloomberg, IGC, WSA (IISI), ISSB, NBS, IGC, IEA, Baker Hughes, ICCO, ICO, USDA, China Mining, Clarkson Research Services, ABARE, AME, Thomson Reuters Datastream, World bank, ECB, Eurostat, IMF, CPB Quarterly Commodity Outlook | 25 July 2014 ABN AMRO Group Economics Historical commodity price developments Oil: Brent and WTI Gas: Henry Hub & Title Transfer Facility 160 18 140 16 120 14 12 100 10 80 8 60 6 USD/mmBt USD/bbl 40 20 0 00 02 04 06 08 10 12 4 2 0 05 14 Crude Oil-Brent Crude Oil-WTI Spot Cushing 06 07 08 09 Henry Hub Gas Precious metals: Gold 10 11 12 13 14 TTF Gas Precious metals: Silver 2000 6000 1800 5000 1600 1400 4000 1200 3000 800 USDc/troy ounce USD/troy ounce 1000 600 400 200 0 00 02 04 06 08 10 12 2000 1000 0 14 00 02 04 Gold Bullion 06 08 10 12 14 08 10 12 14 08 10 12 14 Silver Precious metals: Platinum Precious metals: Palladium 1200 2500 1000 2000 800 1500 USD/troy ounce USD/troy ounce 600 1000 500 0 00 02 04 06 08 10 12 400 200 0 00 14 02 Platinum 04 06 Palladium Base metals: Aluminium Base metals: Copper 3500 12000 3000 10000 2500 8000 2000 6000 1500 4000 1000 500 USD/t USD/t 19 0 00 02 04 06 08 LME-Aluminium 99.7% Cash 10 12 14 2000 0 00 02 04 06 LME-Copper Grade A Quarterly Commodity Outlook | 25 July 2014 ABN AMRO Group Economics Historical commodity price developments Base metals: Nickel Base metals: Zinc 60000 50000 40000 30000 10000 USD/t USD/t 20000 0 00 02 04 06 08 10 12 5000 4500 4000 3500 3000 2500 2000 1500 1000 500 0 14 00 LME-Nickel Cash 02 04 06 08 10 12 14 LME-SHG Zinc 99.995% Cash Ferrous metals: Global steel prices (HRC) Ferrous metals: Iron ore & Coking coal 1200 350 1000 300 250 800 200 600 150 100 200 50 USD/t USD/t 400 0 00 02 04 06 08 10 12 0 14 06 07 08 09 10 11 12 13 14 10 12 14 12 14 Iron Ore Fines (63.5%) Prime Coking Coal (Aus) Global steel price Agriculturals: Grains (wheat, corn, soybeans) Agriculturals: Sugar 35 2000 30 25 20 1000 15 500 10 0 00 02 04 06 08 10 12 Wheat, 2nd future contract Corn 2nd future contract Soybeans 2nd future contract 14 USDc/lb USDcents/bushel 1500 5 0 00 02 04 06 08 Sugar, 2nd future contract Agriculturals: Cocoa Agriculturals: Coffee 4000 350 3500 300 3000 250 2500 200 2000 150 1500 100 USDc/lb 1000 USD/t 20 500 0 00 02 04 06 08 Cocoa, 2nd future contract 10 12 14 50 0 00 02 04 06 08 Coffee, 2nd future contract 10 21 Quarterly Commodity Outlook | 25 July 2014 ABN AMRO Group Economics Contributors & Disclaimer All text and forecasts in this document have been finalised on 23 July 2014. Group Economics: Contact information ABN AMRO | Group Economics (in order of appearance): Primary area of expertise: Phone: E-mail: - Marijke Zewuster Head Emerging Markets & Commodities +31 20 383 05 18 [email protected] - Georgette Boele Precious Metals, top down +31 20 629 77 89 [email protected] - Hans van Cleef Energy, sugar, cocoa, coffee +31 20 343 46 79 [email protected] - Casper Burgering Ferrous and Non-ferrous metals +31 20 383 26 93 [email protected] - Frank Rijkers Grains (wheat, corn, soybeans) +31 20 628 64 37 [email protected] - Theo de Kort Information specialist +31 20 628 04 89 [email protected] E-mailbox of Group Economics: [email protected] More information: Websites Group Economics - Internet Group Economics (Macro Research and theme reports, including commodities): English: insights.abnamro.nl/en/ Dutch: insights.abnamro.nl/ All publications of ABN AMRO on macro-economics, commodity and sector developments can be found on: insights.abnamro.nl/en. Follow Group Economics on Twitter: https://twitter.com/sectoreconomen Other commodity research products of ABN AMRO Group Economics: 22 Quarterly Commodity Outlook | 25 July 2014 ABN AMRO Group Economics Contributors & Disclaimer Disclaimer & further information © Copyright 2014 ABN AMRO Bank N.V. and affiliated companies ("ABN AMRO"), Gustav Mahlerlaan 10, 1082 PP Amsterdam / P.O. box 283, 1000 EA Amsterdam, The Netherlands. All rights reserved. This material was prepared by ABN AMRO Group Economics Sector Research and ABN AMRO Private Banking International. It is provided for informational purposes only and does not constitute an offer to sell or a solicitation to buy any security or other financial instrument. While based on information believed to be reliable, no guarantee is given that it is accurate or complete. While we endeavor to update on a reasonable basis the information and opinions contained herein, there may be regulatory, compliance or other reasons that prevent us from doing so. The opinions, forecasts, assumptions, estimates, derived valuations and target price(s) contained in this material are as of the date indicated and are subject to change at any time without prior notice. The investments referred to in this material may not be appropriate or suitable for the specific investment objectives, financial situation, knowledge, experience, or individual needs of recipients and should not be relied upon in substitution for the exercise of independent judgment. ABN AMRO or its officers, directors, employee benefit programs or co-workers, including persons which were involved in preparing or issuing this material, may from time to time hold long- or shortpositions in securities, warrants, futures, options, derivatives or other financial instruments referred to in this material. ABN AMRO may offer and render at any time investment banking-, commercial banking-, credit-, advice-, and other services to the issuer of any security referred to in this material. Pursuant to offering and rendering such services, ABN AMRO may come into possession of information not included in this material and ABN AMRO may prior or immediately after publication thereof have acted based on such information. In the past year, ABN AMRO may have acted as lead manager or co-lead manager with regard to a public offering of securities from issuers as mentioned in this material. The stated price of any securities mentioned herein is as of the date indicated and is not a representation that any transaction can be effected at this price. Neither ABN AMRO nor other persons shall be liable for any direct, indirect, special, incidental, consequential, punitive or exemplary damages, including lost profits arising in any way from the information contained in this material. This material is for the use of intended recipients only and the contents may not be reproduced, redistributed, or copied in whole or in part for any purpose without ABN AMRO's prior express consent. This document is solely intended for dissemination amongst private/retail customers. Distribution to private/retail customers in any jurisdiction that would require registration or licensing of the distributor which the distributor does not currently have, is not permitted. Material means all research information contained in any form including but not limited to hard copy, electronic form, presentations, e-mail, SMS or WAP. US Securities Law ABN AMRO Bank N.V. is not a registered broker-dealer under the U.S. Securities Exchange Act of 1934, as amended (the "1934 Act") and under applicable state laws in the United States. In addition, ABN AMRO Bank N.V. is not a registered investment adviser under the U.S. Investment Advisers Act of 1940, as amended (the "Advisers Act" and together with the 1934 Act, the "Acts), and under applicable state laws in the United States. Accordingly, absent specific exemption under the Acts, any brokerage and investment advisory services provided by ABN AMRO Bank N.V., including (without limitation) the products and services described herein are not intended for U.S. persons. Neither this document, nor any copy thereof may be sent to or taken into the United States or distributed in the United States or to a US person. Other jurisdictions Without limiting the generality of the foregoing, the offering, sale and/or distribution of the products or services described herein is not intended in any jurisdiction to any person to whom it is unlawful to make such an offer, sale and/or distribution. Persons into whose possession this document or any copy thereof may come, must inform themselves about, and observe any legal restrictions on the distribution of this document and the offering, sale and/or distribution of the products and services described herein. ABN AMRO cannot be held responsible for any damages or losses that occur from transactions and/or services in defiance with the restrictions aforementioned. Company disclosures ABN AMRO may beneficially hold a major shareholding or a significant financial interest of the debt of this company. ABN AMRO currently maintains a market in the security of this company and otherwise purchases and sells securities of this company as principal. ABN AMRO has received compensation for investment banking services from this company, its subsidiaries or affiliates during the previous 12 months. Personal disclosures The information in this opinion is not intended as individual investment advice or as a recommendation to invest in certain investments products. The opinion is based on research of ABN AMRO Group Economics. The analysts have no personal interest in the companies included in this publication'. Their remuneration for this work is not, was not and will not be related directly or indirectly to the specific recommendations or views expressed in this opinion.
© Copyright 2026 ExpyDoc