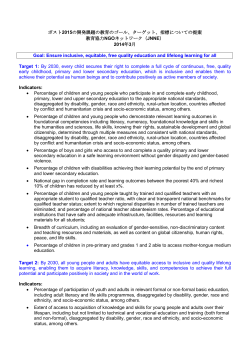
Understanding Ethnic Identity in Africa: Evidence
from the Implicit Association Test (IAT)*
Sara Lowes †
Nathan Nunn §
James A. Robinson ‡
Jonathan Weigel ¶
January 2015
Paper prepared for the 2015 ASSA meetings in Boston, MA. Session: “Culture, Trust, and
Productivity,” with Robert Gibbons presiding.
*
We thank Matthew Summers for excellent research assistance throughout the project. We also
thank Jonathan Yantzi for his assistance in the field and Sriram Natarajan for his guidance with
the IAT programing.
†
Harvard University, Department of Economics, 1805 Cambridge Street, Cambridge, MA,
02138. [email protected]
§
Corresponding author. Harvard University, Department of Economics, 1805 Cambridge Street,
Cambridge, MA, 02138. [email protected]
‡
Harvard University, Department of Government, 1737 Cambridge Street, Cambridge, MA,
02138. [email protected] ¶
Harvard University. Department of Government, 1737 Cambridge Street, Cambridge, MA,
02138. [email protected] 0 I. Introduction
A fundamental feature of people’s psychology is their identity – one’s sense of self. A
great deal of evidence suggests that individuals go through a process of choosing an identity
which then heavily influences the way they behave, which social norms they adopt, and how they
treat others (Akerlof and Kranton, 2010). In the African context, the literature has focused on
ethnicity as a central dimension of identity. While the early empirical literature worked at the
macro level, more recent scholarship has moved to the individual level to better understand
ethnicity, identity, and its potential economic effects. For example, Habyarimana et al. (2007,
2009) undertake an extensive set of behavioral laboratory studies with participants in Kampala,
Uganda. Interestingly, they fail to find evidence of a differential ability to cooperate between
coethnics and non-coethnics in a puzzle game that requires communication and cooperation
between pairs of participants. They also fail to find evidence of differences in preferences for
public goods or for differential altruism towards coethnics relative to non-coethnics using
behavior in an anonymous dictator game. It is only when the identity of the dictator is observable
that there is co-ethnic bias in giving. These findings suggest that there may not be an innate or
implicit bias towards other ethnic groups, but that the social setting (e.g., social pressures or social
sanctions) causes individuals to behave differently towards coethics when observed.
Despite the contention over the importance of implicit ethnic bias, economists have yet to
directly measure implicit ethnic bias. While Habyarimana et al. (2007, 2009) infer this from the
outcomes of behavioral games, in this paper, we argue that recent work in psychology allows us
develop a direct measure of ethnic bias or the intrinsic preference for one’s own ethnic group. Our
measure is a variant of the Implicit Association Test (IAT), which is a computer-based sorting
task that aims to measure individuals’ implicit attitudes towards specific targets. Though the IAT
1 has been heavily used to measure implicit attitudes towards race (black vs. white) and towards
gender (male vs. female), it has not been widely used to examine ethnic preferences.
We implement a variant of the IAT – the single target IAT (ST-IAT) – to test for
participants’ implicit attitudes towards various ethnic groups. We use a participant population
from Kananga, a city located in the central Democratic Republic of Congo, and measure
participants’ attitudes towards four ethnic groups: Luluwa, Luba, Lele, and Kuba. The sample
population is the same as in Lowes, Nunn, Robinson, and Weigel (2015b).
We find that the IAT measures reveal evidence of an implicit own-ethnicity bias.
Individuals have implicit views of their own ethnic group that are more positive than their implicit
views of other ethnic groups. Using survey-based measures, we also find evidence of ownethnicity bias in self-reported attitudes towards other ethnic groups. Interestingly, the implicit
own-ethnicity bias measured by the IAT is much smaller than the explicit bias measured using
survey questions.
We find that one shortcoming of the survey-based data is that they reveal strong
enumerator-ethnicity effects. All else equal, participants report more positive attitudes towards the
ethnicity of the enumerator. However, we find that this bias does not exist in the IAT measures.
This is likely because the implicit attitudes elicited using the IATs are not observable to the
participant, let alone the enumerator. This suggests an important potential benefit of the IAT over
survey-based measures.
II. Overview of the Single-Target Ethnicity Implicit Association Test (IAT)
The IAT was developed to measure an individual’s implicit association between pairs of
objects. To see the intuition behind the IAT, consider the following task described in Banaji and
Greenwald (2013, pp. 33-34). You have to sort a deck of shuffled cards into two piles (one on
2 your left and one on your right) based on the suit of each card. In the first task, you are asked to
put hearts and diamonds in the left pile and spades and clubs in the right pile. Doing this is quite
natural because hearts and diamonds are both red, and spades and clubs are both black. There is a
strong association between these suits that makes sorting quick and intuitive. However, if you
were asked to sort hearts and spades into the left pile and diamonds and clubs into the right, this
would be much less intuitive and would take longer.
This example illustrates the basic logic of the IAT. In a standard IAT, four different types
of images (like the suits) appear on a computer screen. The participant is asked to sort these
images into two groups (like the two piles), one on the left side and one on the right side. If there
is an underlying association between certain types of images, then some groupings will be easier
to sort than others (as in the card example above). In the standard Black-White IAT, individuals
observe: images of Caucasians, images of African Americans, images of good words (e.g., happy,
wonderful), and images of bad words (e.g., terrible, horrible). If, for example, one has a negative
implicit view of African Americans, then sorting the images of African Americans and the bad
words to the same side of the screen will be easier and quicker than sorting images of African
Americans and of good words to the same side of the screen. If there is no underlying association,
then sorting African-American and good images together should take the same amount of time as
sorting African-American and bad images together.
One shortcoming of the standard IAT is that one is only able to make statements about
one’s view of a target relative to the other target. For example, in the race IAT, one is only able to
observe whether the association of good words is stronger with African American images or
Caucasian images (relative to the other). One is not able to make an absolute statement about how
positively the participant views African Americans or Caucasians. In addition, the standard IAT
3 only lends itself to opposing pairs of targets e.g., black-white, male-female, etc. Many objects of
interest, including ethnicity, are not naturally represented in pairs.
These shortcomings have led researchers to develop extensions of the standard IAT. For
example, Bluemke and Friese (2008) have developed the single-target IAT (ST-IAT), which we
use in our research. In each block of the IAT, three objects are sorted: good words, bad words,
and words associated with a target (e.g., a political party, a brand of soda pop, an ethnicity, etc.).
Following the same logic as the standard IAT, if the participant has a positive view of the target,
then sorting will be faster when the participant has to sort the target and good words to the same
side of the screen than when the participant has to sort the target and bad words to the same side
of the screen.
In the summer of 2014 in Kananga, DRC, we implemented a version of the ST-IAT using
ethnic groups as targets. Due to time constraints and limited participant attention span, we limited
the study to four ethnicities prevalent in Kananga: Luluwa, Luba, Lele, and Kuba. Our sample
includes 536 individuals. Of these 193 are Luluwa (the most prevalent group in Kananga), 33 are
Luba, 38 are Lele, and 72 are Kuba.
In this setting, a significant proportion of the population is illiterate. Therefore, we
implemented a variant of the ST-IAT in which participants sorted sounds rather than written
words. The IAT we developed includes nine blocks in total. The first block is a practice block in
which participants played a simplified version of the game, sorting only good and bad words. In
every block of the IAT, participants needed to obtain a 75% success rate in order to continue to
the next block. If they did not meet this threshold, they repeated the block. The remaining eight
blocks of the ST-IAT consisted of two blocks for each of the four ethnic groups. In one of the two
blocks, words related to one of the four ethnic groups and good words were sorted left, and bad
4 words were sorted right. In the other of the two blocks, words related to one of the ethnic groups
and bad words were sorted right, and good words were sorted left. The order of the blocks was
randomized across participants.
Each block has 24 trials: 8 trials with word associated with one of the four ethnic groups,
8 with good words, and 8 with bad words. The order of the words within the blocks is
randomized. We used 8 good words (in English they are laughter, happy, pleasure, joy, love,
glorious, generous, and nice) and 8 bad words (evil, failure, hurt, bad, horrible, terrible, suffering,
and evil). For the 8 trials with ethnicity words, we randomly drew from a pool of six ethnic words
(e.g. for the Luluwa and in English): Luluwa, the Luluwa, Luluwa person, Chief of the Luluwa,
Luluwa culture, Luluwa tradition, Luluwa custom.
Figure 1. ST-IAT screen shot.
Participants used a 10-inch Samsung Galaxy Tab 3 touchscreen tablet connected to
headphones. A view of the screen is provided in figure 1. In the block shown, respondents sort
5 good words to the left, words related to the Luba ethnic group to the left, and bad words to the
right. The sorting was done by pressing the red buttons on the lower left or right of the screen.
Before starting each the block, enumerators verbally explained the instructions to the participant.
The IATs were administered in either French or Tshiluba. For the interested reader, further details
of the ethnicity IAT and its implementation are provided in an online appendix (see Lowes, Nunn,
Robinson, and Weigel, 2015a).
The IAT measure of interest is the D-score, which we construct in the following manner
(see e.g., Greenwald, Nosek, and Banaji, 2003; Lane, Banaji, Nosek and Greenwald, 2007). We
ignore data from practice blocks and from any blocks that were repeated because the participant
did not have an accuracy rate above 75%. We winsorize (i.e., truncate) the recorded latency (i.e.,
response time) to 3000 milliseconds and account for incorrect responses by replacing their latency
with the block mean latency plus the block standard deviation latency. The D-score measuring the
positivity of the implicit association of the target is calculated as:
D-score = [Mean(latency-ve) – Mean(latency+ve)] / SD(latencyboth).
Mean(latency-ve) is the recorded average response time for the block in which the ethnic group is
paired with bad words, Mean(latency+ve) is the average response time for the block in which the
ethnic group is paired with good words, and SD(latencyboth) is the standard deviation of the
response time during both blocks. Note that if the participant is able to sort the various objects
more rapidly when the ethnic group is matched with good words, then Mean(Latencyve
)>Mean(Latency+ve) and the D-score is positive. Thus, the D-score is increasing in the
participant’s implicit bias in favor of a given ethnic group.
IV. Empirical Results
6 We begin by first testing the validity of the ST ethnicity IAT in our setting. To do this, we
developed a ST-IAT for which we had strong priors about what associations we should observe.
Our chosen targets of interest were food, spiders, and snakes. From initial focus groups, we
confirmed that individuals liked food (not surprising) and that they disliked spiders and snakes.
We also learned that they disliked snakes much more than spiders since many snakes in the area
are poisonous while the spiders are not.
Figure 2. Results from the single-target food-spiders-snakes IAT.
Results from the ST food-spiders-snakes IAT are summarized in figure 2. Our findings
confirm that within our sample of 536 individuals, the average implicit association of food is
positive (and statistically different from zero), and of spiders and snakes is negative, with the
association with snakes being more strongly negative than for spiders. These findings confirm
that the single-target IAT succeeds in capturing participants’ implicit attitudes in our setting.
7 Moving to the ST ethnicity IAT, our primary interests are (1) whether we observe an ownethnicity bias in the IAT D-score, and (2) how this compares to the explicit own-ethnicity bias
found in survey-based measures.
The first set of survey questions we use asks individuals to report of how close they feel to
people from each of the four ethnic groups. Participants chose responses using an integer scale
ranging from 0 (furthest) to 5 (closest). The second set of measures is based on respondents’
reported perceptions of each ethnicity group, with the possible responses being: very negative (0),
somewhat negative (1), neutral (2), somewhat positive (3), and very positive (4).
To test for the presence of a bias towards one’s own ethnicity, we estimate the following
equation:
!"#$%!!"#"$%
𝑦!" = 𝛼! + 𝛼! + 𝛽𝐼!"
+ 𝜀!" .
(1)
The unit of observation is an individual i’s view of ethnicity e, either self-reported or measured
!"#$%!!"#"$%
with the ST ethnicity IAT. The variable 𝐼!"
is an indicator variable that equals one if the
ethnicity of the target ethnic group e is the same as the (self-reported) ethnicity of individual i.
The equation also includes fixed effects for the four ethnic groups, 𝛼! , as well as individual fixed
effects, 𝛼! . The baseline sample includes 536 individuals belonging to 22 different ethnic groups.
All of the results reported are very similar if we restrict the sample to the 336 participants that
belong to one the four target ethnic groups.
Estimates of equation (1) are reported in columns 1-3 of table 1. In columns 1 and 2, the
dependent variable is participants’ self-reported views of each of the four ethnic groups, and in
column 3, it is the IAT D-score measure. For all three outcomes one observes a statistically
significant own-ethnicity bias. Interestingly, the own-ethnicity bias is much stronger for the
survey questions than for the IAT score. While the size of the own-ethnicity bias when using the
8 two survey measures is 0.74 and 0.58 standard deviations (columns 1 and 2), the size of the effect
when the D-score is used is 0.14 standard deviations (column 3). This suggests that individuals’
implicit ethnic bias towards their own group is less strong than their explicit self-reported bias.
Table 1. Baseline Results
This result dovetails nicely with Habyarimana et al. (2007, 2009), who find evidence of an
ethnic bias among participants only when their actions are observed. Their findings suggest the
existence of an explicit bias but no implicit bias. Here, we also find evidence for an explicit ownethnicity bias that is larger than the implicit bias. However, in contrast to Habyarimana et al., we
find that the implicit bias is not zero. Our IAT-based measure is able to identify the existence of
an implicit bias towards one’s own ethnic group.
There are a number of potential concerns with survey-based questions that ask
respondents about their views of various ethnic groups. One, in particular, is that individuals’ selfreported views may be influenced by the ethnicity of the enumerator. For example, it may be
9 more difficult to report that one does not view the Luluwa positively when the enumerator is
Luluwa.
One potential benefit of the IAT over survey-based measures (or experiment-based
measures) is that the enumerator does not observe the participant’s performance in the IAT.
Further, since the IAT score is based on split-second response differences, it is highly unlikely
that the enumerator could detect an ethnic biases even if the enumerator were watching.
To assess the extent to which enumerator ethnicity affects our outcomes of interest, we
include in equation (1) an indicator variable that equals one if the ethnicity of the enumerator is
the same as the target ethnicity e. The estimates, with the two survey-based measures as outcomes
are reported in columns 4 and 5 of table 1. They show that the ethnicity of the enumerator does
matter. Participants’ self-reported views of an ethnic group are more positive when the
enumerator belongs to that ethnic group. In contrast, the enumerator’s ethnicity does not affect the
ST ethnicity IAT D-score. As reported in column 6, when the D-score is the dependent variable,
the coefficient for the enumerator ethnicity indicator variable is very close to zero and statistically
insignificant.
These results suggest that a potential benefit of using the IAT to measure attitudes towards
ethnic groups and detecting ethnic bias is that it is less susceptible to influence arising from the
observability of participant responses.1
IV. Conclusions
We have examined a new measure of attitudes towards ethnic groups and have found
evidence that the single-target IAT is a valid measure of ethnic views. We use the measure to test
1
We also find evidence that the order of activities and surveys, which we randomly assigned, affects explicit ethnicbias measured using the survey questions, but does not affect implicit ethnic-bias measured using the IAT. The
estimated coefficient of interest, 𝛽, in equation (1), is sensitive to the order of activities when survey measures are
used but not when the IAT D-score is used.
10 for an own-ethnicity bias in our sample and find that the bias we estimate using the single-target
IAT is smaller in magnitude and statistical strength relative to the bias found when using selfreported view towards ethnic groups from surveys. We also identify an important benefit of using
IATs to measure ethnic bias. With the survey questions, the ethnicity of the enumerator has a
strong effect on participant responses. In contrast, the IAT appears immune to such manipulation,
perhaps due to the unobservability of sorting latencies. These findings suggest that the IAT is a
useful complementary tool in studying ethnicity in Africa and elsewhere.
References
Akerlof, George and Rachel Kranton. 2010. “Economics and Identity,” Quarterly Journal of
Economics, 115 (3): 715-753.
Banaji, Mahzarin R. and Anthony G. Greenwald. 2013. Blindspot: Hidden Biases of Good
People. New York: Delacorte Press.
Bluemke, Matthias and Malte Friese. 2008. “Reliability and Validity of the Single-Target IAT
(ST-IAT): Assessing Automatic Affect Toward Multiple Attitude Objects,” European
Journal of Social Psychology, 38: 977-977.
Greenwald, Anthony J., Brian A. Nosek, and Mahzarin R. Banaji. 2003. “Understanding and
Using the Implicit Association test: I. An Improved Scoring Algorithm,” Journal of
Personality and Social Psychology, 85: 197-216.
Habyarimana, James, Macartan Humphreys, Daniel N. Posner, and Jeremy M. Weinstein. 2007.
“Why Does Ethnic Diversity Undermine Public Goods Provision?” American Political
Science Review, 101(4): 709-725.
Habyarimana, James, Macartan Humphreys, Daniel N. Posner, and Jeremy M. Weinstein. 2009.
Coethnicity: Diversity and the Dilemmas of Collective Action. New York: Russell Sage.
Lane, Kristin A., Mahzarin R. Banaji, Brian A. Nosek, and Anthony G. Greenwald. 2007.
“Understanding and Using the Implicit Association Test: IV. What We Know (So Far) about
the Method,” In Bernd Wittenbrink and Norbert Schwarz (eds.) Implicit Measures of
Attitudes. New York: The Guildford Press.
Lowes, Sara, Nathan Nunn, James A. Robinson, and Jonathan Weigel. 2015a. “Appendix for:
Understanding Ethnic Identity in Africa: Evidence from the Implicit Association Test
(IAT),” Mimeo, Harvard University.
Lowes, Sara, Nathan Nunn, James A. Robinson, and Jonathan Weigel. 2015b. “The Evolution of
Culture and Institutions: Evidence from the Kuba Kingdom,” Mimeo, Harvard University.
11
© Copyright 2026 ExpyDoc