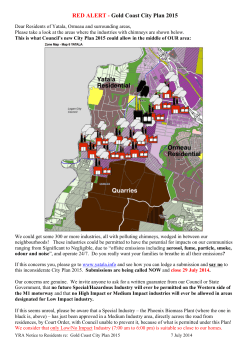
Estimating Indirect Land Use Change
Emissions from Biofuels
Comments by Clean Air Task Force to California Air Resources Board
On the ILUC emissions estimate discussed in ARB’s presentation
“iLUC Analysis for the Low Carbon Fuel Standard (Update)” (March 11, 2014) May 19, 2014
Overview
The Clean Air Task Force (CATF) is a non-profit environmental organization that works to
protect the earth’s atmosphere by improving air quality and reducing global climate change
through scientific research, public advocacy, technological innovation, and private sector
collaboration. CATF is pleased to submit the following comments to the California Air
Resources Board concerning ARB’s review of the indirect land use change (ILUC) emissions
associated with biofuels and how those emissions are accounted for within the state’s Low
Carbon Fuel Standard (LCFS).
Although research into the effect that biofuels have on climate change is marked by uncertainty
and controversy, it is increasingly evident that the production and consumption of some types
of biofuels are undermining efforts to reduce greenhouse gas (GHG) emissions. As compared
to other policies being used to promote biofuels—most notably, the federal Renewable Fuel
Standard—the LCFS represents a significantly better platform for evaluating net GHG emissions
and rewarding the fuels with the lowest carbon intensities. CATF is therefore committed to
helping ARB ensure that the best and most current research is used to inform its assessments
of the carbon intensities of different fuels, especially biofuels.
These comments highlight three factors that ARB should take into account as it evaluates the
ILUC emissions estimate used to calculate the carbon intensity of biofuels in the LCFS context:
•
Studies that supposedly demonstrate a trend toward lower ILUC emissions estimates—
including versions of the Global Trade Analysis Project (GTAP) model that ARB relies
upon to implement the LCFS—typically ignore how water scarcity constraints will
impact crop expansion. A recent analysis that takes water scarcity into account finds
that earlier studies “likely underestimated induced land use emissions due to ethanol
production by more than one quarter.”
•
GTAP’s inability to differentiate commercial forest from non-commercial forests means
that the model wrongly assumes that markets respond to the conversion of both land
types in the same way.
•
The yield improvement assumptions in GTAP overlook important differences among
crops and growing regions, they fail to incorporate new research on future corn yields
in the Midwest United States, and they do not adequately address the climate impact
associated with the increased use of nitrogen-based fertilizers to sustain yield growth.
Each of these factors separately suggest that the GTAP model is currently under-counting ILUC
emissions. Taken together, they indicate that a reduction to the ILUC emissions estimate
discussed in ARB’s March 11, 2014, presentation, “iLUC Analysis for the Low Carbon Fuel
Standard (Update),”1 would not be appropriate. CATF therefore urges ARB to keep the ILUC
estimate at its current level until ARB can more fully account for the issues raised here and at
the March workshop.
[I]
The “Trend” Toward Lower ILUC Emission Estimates Is Illusory
In California (as in Washington DC), the ethanol industry has aggressively promoted the idea
that ILUC emissions estimates for corn ethanol are steadily trending downward as new lifecycle
analyses are published. The industry places particularly high value on particular publications by
Purdue researchers Wally Tyner and Farzad Taheripour that point toward relatively low
estimates of ILUC emissions, e.g., a 2012 paper that reduces the estimated land requirements
for US ethanol production by 25%.2 The cited studies have important shortcomings,
however—a problem that is exemplified by the way in which the studies have ignored realworld constraints on the amount of water available for new agriculture.
In fact, more recent work by Taheripour is intended to correct this oversight. In a 2013 study
he co-authored by Thomas Hertel and Jing Liu, two other researchers from Purdue, he writes:
“[I]n contrast to the recent trend in such studies, incorporating explicit modeling of irrigation,
and associated constraints, significantly raises the land-based emissions associated with biofuel
expansion.”3
Taheripour et al. (2013) opens with two key points. First, water availability is essential to
understanding the land use impact of biofuel expansion, especially with water availability
projected to decrease over the next two decades.
[T]he question of whether expansion of global cropland cover involves irrigated
or rainfed lands make a significant difference in terms of how much new land will
be required to provide the additional production called for in the presence of
biofuels … [I]f the expansion of irrigated land is constrained, either due to
insufficient water or due to insufficient pumping capacity, then it is likely that
more cropland area will be required to meet the additional global demand
induced by ethanol production.4
The authors cite recent studies that predict large water deficits, including an analysis by
McKinsey which estimates that by 2030 water demand will exceed water supply by 40%. “In
summary,” Taheripour et al. write, “it appears that water for agricultural irrigation will become
much more expensive in the future – no doubt spurring considerable efficiency gains, but also
raising the cost of production and therefore limiting the amount of land on which irrigated
crops can be economically grown.”5
Second, refining land use change models to account for real-world constraints on water
availability reveals a greater likelihood that biofuels expansion will drive displaced agricultural
CATF Comments to ARB on ILUC Estimate-May 2014 | 2
production into areas that are rainfed. “These regions tend to be more carbon rich and
therefore
exhibit
higher and
ILUC
factors,” write Taheripour et al. “Therefore,
Taheripour et al.
Energy, Sustainability
Societyemission
2013, 3:4
Page 10 ofearlier
18
http://www.energsustainsoc.com/content/3/1/4
models
which ignore the role of irrigation in crop expansion tend to underestimate the ILUC
emissions due to biofuel expansion.”6
One such model is GTAP-BIO, which Taheripour and Tyner used in the earlier 2012 study to
assess the land use impacts of the 2015 ethanol mandate in the US Renewable Fuel Standard.7
(GTAP-BIO, of course, is used to generate the emissions estimates for biofuels that ARB relies
upon to implement the LCFS.) The enhancements that Taherpour et al. make to GTAP in the
2013 study allow the model to recognize water scarcity constraints and distinguish between
rain-fed and irrigated land. Figures 3 and 6 from Taheripour et al. (2013) illustrate the extent to
which the intensity of global land use change can differ when models are programmed to
distinguish between irrigated crops and rainfed crops, and when constraints on water availability
Taheripour et al. Energy, Sustainability and Society 2013, 3:4
Page 9 of 18
are
introduced:
http://www.energsustainsoc.com/content/3/1/4
Fig. 3 from Taheripour et al. (2013)
Figure 5 Irrigated cropland cover change, with irrigation constraint.
the presence of constraints on its expansion in some
Conclusions
In recent years, numerous studies have examined the parts of the world, previous studies have underestimated
global land use changes and consequent emissions due the induced land use emissions due to ethanol producto biofuel expansion across the world. These studies tion. In particular, previous studies built based on the
have effectively ignored the distinction between rainfed earlier version of the GTAP-BIO model resulted in estiand irrigated lands. This paper develops a new general mates of land-based emissions of ethanol expansion
equilibrium framework which, unlike the existing global which are too small by about one quarter.
All of the estimated induced land use changes due to
CGE models, disaggregates irrigated and rainfed cropping industries to examine the role of potential irrigation biofuels and their associated emissions provided in the
constraints in biofuel-induced land use changes. Appli- literature are subject to significant uncertainties. In this
cation of this framework to the problem of biofuel- paper, we concluded that by ignoring the role of irrigainduced emissions from land use change shows that tion, previous studies have underestimated the induced
models which ignore the role of irrigation and mingled land use emissions due to ethanol production. By inFigure 3 Irrigated cropland cover change, without irrigation constraint.
irrigated and rainfed areas tend to systematically under- corporating these factors into the estimation process for
estimate the induced land use changes due to the US induced land use emission, we can provide more accurresults.calculated
We show
this simulation
omission introduces
ethanol
By ignoring
rolethe
of irrigation
emissions
for that
the three
results are
AEZ10, program.
and AEZ11
(which the
cover
Midwest) and
are ate
Fig.
6 from
al. (2013)
higher
than Taheripour
this figure by et
30.4%,
40.2%, and 58.2%, re- shown in Table 5. This table indicates that increasing US
spectively. Therefore, any deforestation in these Midwest ethanol production from its 2001 level to 56.78 billion liAEZs would induce larger land use emissions than de- ters causes about 35.6 g CO2e/MJ emissions if there is
forestation in the West (AEZ7).
no irrigation constraint across the world. Factoring in
Figure 8 represents land use emission factors for pas- the physical limitations on irrigation expansion increases
ture conversion to croplands. In general, the land emis- the land-based emissions to 45.4 g CO2e/MJ. This means
sion factors of pasture areas are smaller than the forest that the physical water scarcity adds 27.5% to the emisareas in the same region/AEZ. For example, the pasture sions due to land use changes induced by ethanol expanland emission factor of US AEZ7 is about 101 Mg CO2/ sion. As shown in Table 5, the constrained case also
ha. This is about one-fourth of the forest conversion generates 27.5% more emissions compared to the case
wherein we ignore irrigation altogether. This means that
emission factor in this AEZ.
The model developed by Plevin et al. [41] takes GTAP earlier studies, which failed to distinguish rainfed from
land use changes and calculates land use emissions in irrigated lands, likely underestimated induced land use
grams of CO2 equivalent per megajoule (g CO2e/MJ) of emissions due to ethanol production by more than one
produced biofuel (ethanol in this case). The land use quarter.
Figure 6 Rainfed cropland cover change, with irrigation constraint. Figures 3, 4, 5, 6 represent change in harvested areas.
CATF Comments to ARB on ILUC Estimate-May 2014 | 3
By sensitizing the model to these factors, the 2013 study finds that ILUC emissions are likely to
be substantially higher than prior estimates:
[I]ncreasing US ethanol production from its 2001 level to 56.78 billion liters
causes about 35.6 g CO2e/MJ emissions if there is no irrigation constraint across
the world. Factoring in the physical limitations on irrigation expansion increases
the land-based emissions to 45.4 g CO2e/MJ. This means that the physical water
scarcity adds 27.5% to the emissions due to land use changes induced by ethanol
expansion. As shown in Table 5 [excerpted below], the constrained case also
generates 27.5% more emissions compared to the case wherein we ignore
irrigation altogether. This means that earlier studies, which failed to distinguish
rainfed from irrigated lands, likely underestimated induced land use emissions
Taheripourdue
et al. Energy,
Sustainability
and Society 2013,by
3:4 more than one quarter.8
Page 12 of 18
to ethanol
production
http://www.energsustainsoc.com/content/3/1/4
Table 5 from Taheripour et al. (2013)
Table 5 Land use emissions due to US ethanol production
Simulations
Ethanol
production
(billion
liters)
Annualized ILUC emissions
(g CO2e/MJ)
Deviation from no-irrigation (%)
−0.05
Unconstrained
50.08
35.6
No-irrigation
50.08
35.6
0.0
Constrained
50.08
45.4
27.5
level and computed production by irrigation type using 23% of the global harvested area is irrigated, while global
irrigated lands account for about 38% of global agriculthe following equation:
An additional
point
worth noting in this context
that both
of the
valuesThis
cited
in thethat2013
turalisoutputs
(measured
by weight).
indicates
w
w
w
Qij ¼ Aij " Yij
ð1Þ
irrigated landshigher
are morethan
productive
versus rainfed
lands.
study for corn ethanol—35.6 and 45.4 g CO2e/MJ—are
the central
values
that ARB
The23.2
globalg average
yields 9for irrigated and rainfed areas
presented
at
the
March
11
workshop
(30.0
and
CO
e/MJ).
2
Here, Q, A, and Y represent crop quantity, harvested
are about 10.8 and 5.3 metric ton/ha.
area, and yield. The superscript w denotes irrigation type
To understand the role of irrigation in crop produceither w =
irrigated
or w = rainfed),ARB
i indicates
In(with
its March
2014
presentation,
staffthe
notified
thereview
Board
thatdatabase
the current
version
of GTAP
tion, we
the new
from different
angles.
crop type with 29 members based on PSD, and j shows
fails
differentiate
theavailable
irrigated
andTable
rain-fed
land and assumes that the water
the to
index
of grid cell forbetween
all grid cells
in the
6 PSD and SAGE crop categories
PSD data set.
we the
aggregated
PSD gridded
availability
(or, Then,
rather,
unavailability
of water)
does
not affect the model’s
PSD crop
categories
GTAP/SAGE estimates
crop categories
harvested areathe
andconversion
crop production
to land
country
Wheat
concerning
of up
new
forbycrop
production. Staff flagged twowht
of the problems
AEZ and crop to match the results with the GTAP agMaize
for
grain
gro
connected
withofthis
assumption—water
is not an unlimited resource, and it cost money to
gregation scheme
the data
set of Monfreda et al. [37].
Rice
pdr
The GTAP
data set
aggregates crops
into eight categorirrigate
newly
converted
cropland—and
pointed
out that, “Crop expansion and
crop switching
Barley
gro
ies.
The
mapping
schedule
from
PDS
to
GTAP
database
decisions will require availability of water resource and may change model predictions.”10
gro
is presented in Table 6. Then we used the following rela- Rye for grain
According
to the
presentation,
staff
plans ofto collect
data on water availability, gro
productivity
tionships to split
harvested
area and crop
production
Millet
differences,
andinto
land
elasticity,
andcategories:
integrate those
within the
SAGE/GTAP data
irrigated
and rainfed
Sorghumdata
for graininto a revised GTAP model
gro
11 #
"
next few
months.
wPSD
Soybeans
osd
Q
SAGE
Qwirz ¼ X irz wPSD " QSAGE
ð2Þ Sunflower
irz
osd
Q
w irz
Potatoes
v-fcropland
This effort "to incorporate
water-related
restrictions
on
biofuel
demand-driven
#
PSD
Awirz to materially
Cassava
v-f associated with
wSAGE
SAGE
expansion
is
likely
affect
ARB’s
estimate
of
the
net
GHG
emissions
ð3Þ
Airz ¼ X wPSD " Airz
cane
irz
the LCFS. Thew A2013
study by Taheripour et al.Sugar
indicates
that ignoring the rolec-bof irrigation in
Sugar beets
c-b
cropland
expansion “introduces systematic biases in the measurement of the size
and pattern of
These two equations serve to share out the quantity Oil palm
osd
global
land
and
theintolandRapeseed/canola
use emissions due to production
of biofuels.”12
produced
anduse
areachanges
harvested in
the therefore
SAGE database
osd
irrigated and rainfed components. Specifically, Q and A Groundnuts/peanuts
osd
represent crop quantity and harvested area, w shows the
We
therefore
encourage
ARB
to
ensure
that
water
constraints
are
accounted
Pulses
v-ffor in the
index of irrigation type with two categories of irrigated
Citrus
v-fLCFS.
lifecycle
emissions
analyses
used
to
assess
the
treatment
of
biofuels
within
the
and rainfed type, i indicates crop type with eight memv-f
bers, r shows the index of the region for all regions in Date palm
the data set, z is the index of AEZ from 1 to 18, and fi- Grapes/vine
v-f
nally, PSD and SAGE represent their corresponding data Cotton
pfb
CATF Comments to ARB on ILUC Estimate-May 2014
sets. Finally, the new data set is aggregated into 19 reCocoa
ocr
gions by AEZ according to the regional aggregation level
Coffee
ocr
used in this paper. These 19 regions and their members
Others
perennial
ocr
are shown in Table 7.
| 4
[II]
GTAP’s Treatment of Forest Conversion Artificially Suppresses ILUC
Emissions
Currently GTAP represents three land-use classes: forestry, pasture, and cropland. These are
economic uses of land, however, not land-cover types. That is, GTAP does not represent
forests generally; it represents economically productive timberland. As a result, the model
assumes that any conversion of forestry land causes a reduction in timber supply, which in turn
creates upward pressure on timber prices. This assumption has two effects that are likely to
produce lower projected ILUC emissions.
First, the opportunity cost of converting commercial forestry land is greater than the
opportunity cost of converting forestland that is not in economic use. The assumption within
GTAP that all forestland is commercially managed therefore exaggerates the economic limits on
non-commercial forest conversion. Consequently, the model likely projects less overall forest
conversion than it would if it differentiated between commercial and non-commercial forests
and made both types available for conversion.
Second, once commercial forestland is converted, there is an afforestation response elsewhere
that makes up some portion of the lost timber supply. GTAP fails to appreciate that the
conversion of non-commercial forestland would not produce a similar afforestation response.
Notably, other models used to estimate land-use change emissions—including IFPRI’s MIRAGE,
MIT’s EPPA, and PNNL’s GCAM—allow for the conversion of non-commercial forestland.
ARB staff referenced these concerns in their presentation for the March 2014 workshop,
explaining that GTAP’s inability to differentiate between forest categories “creates unrealistic
deficit from wood products in the forestry sector.”13 A temporary fix involving adjustments to
the Land Transformation Elasticity (ETL) values was proposed, with a completion target of April
2014.14 It is not clear from ARB’s website whether this fix has been executed or how the
adjustment impacts the ILUC estimate. CATF cannot specifically comment on the proposed fix
until we have reviewed the results of the ETL adjustment, but we are encouraged that ARB has
identified this problem and is committed to addressing it. We urge ARB to ensure that its
ILUC determination is based on land use modeling that effectively differentiates between
commercial and non-commerical forestland.
[III] Aspects of GTAP’s Treatment of Yield Problematically Affect ILUC
Analysis
Several of the ways in which GTAP treats future crop yields are suppressing the model’s ILUC
emission projections. These include the model’s assumption that price-induced yield
improvements for all crops in all regions will match the improvement rate projected for
Midwestern US corn, the model’s current failure to accommodate new research suggesting that
future corn yield improvements in the Midwest US could decelerate, and model’s ongoing
failure to adequately address the climate impact associated with the increased use of nitrogenbased fertilizers to sustain yield growth.
CATF Comments to ARB on ILUC Estimate-May 2014 | 5
[A]
GTAP’s Handling of Yield Price Elasticity Suppresses ILUC
Estimates
Yield price elasticity is perhaps the most controversial parameter in the GTAP model. GTAP
utilizes a single number which determines how much yields—of all crops, in all regions—
increase in response to price increases. Most arguments about price-induced yield
improvements have focused on the “correct” value for this parameter, while failing to recognize
that no such parameter exists in the real world: no single value can properly capture the
substantial variability across crop types, climatic conditions, and economic conditions.
In practice, nearly all of the discussion about this parameter is informed by studies of one crop
grown in one region—i.e., corn grown in the US Corn Belt. There is little reason to expect
that the yield effects measured for corn in the Midwest, a growing region characterized by
fertile soil and readily available capital, to be representative of the effect that minor price
increases have on, say, rice yield in developing regions.
When setting a range of values to consider for yield price elasticity within GTAP, ARB must
treat this parameter as representing the average yield elasticity for all crops, in all regions, which
is likely to be lower than what has been achieved by corn growers in the United States. The
high values suggested for the US corn should be treated as the maximum obtainable. If GTAP
assumed (appropriately) that not all crops grown around the world will achieve the same level
of yield price elasticity as US corn, estimated ILUC emissions would likely increase.
[B]
GTAP Does Not Incorporate New Research on Future Corn
Yields
The assumptions made in GTAP about future crop yields do not yet take into account
important new research by David Lobell and others on the impact that future drought
conditions will have on Midwest US corn yields over the next 50 years. According to the
study—Lobell et al., “Greater Sensitivity to Drought Accompanies Maize Yield Increase in the
U.S. Midwest,” SCIENCE (May 2, 2014)—a greater incidence of midsummer drought conditions
will slow the steady improvement in corn yields that farmers have historically achieved by
increasing their cropping density. Assuming that finding is corroborated, it should be
incorporated into GTAP’s assumptions about future yield improvement.
According to the study, a handful of factors have allowed farmers to increase the density at
which they plant corn and soy—e.g., no-till agricultural, higher ambient CO2 concentrations,
and genetic enhancements. Increased density has contributed to yield improvements, but it also
“can be detrimental under drought conditions because of excessive stress exposure for
individual plants.”15 The authors examined how corn and soy respond to various environmental
stresses to determine “the net effect of recent genetic, agronomic, and environmental changes
on drought sensitivity.” They find that corn yields are particularly sensitive to increases in
daytime vapor pressure deficit (VPD), “a widely used measure of atmospheric water demand
that depends on air temperature and humidity.” VDP increases appear to be especially
impactful when they occur 2-3 months after a corn crop is sowed.16 As Figure 4(B) from Lobell
et al. shows, VDP during that timeframe (July, approximately) is expected to climb significantly
over the next forty years:
CATF Comments to ARB on ILUC Estimate-May 2014 | 6
Fig. 3. Effects of vapor pressure deficit (VPD) and sowing date on maize yields. (A) Yield response
curves for VPD from multivariate adaptive regression spline model (see fig. S1 for explanation). Colors at
bottom of figure indicate ranges for each quintile of that variable. (Inset) Yield trends for 1995 to 2012
corresponding to each quintile of VPD. (B) Same as in (A) but for sowing date. Error bars, mean T 1 SE.
Time trends for the highest quintile of VPD are significantly lower than for the lowest quintile (P = 0.04). Response
curves and yield trends for other predictors and for soybean are shown in figs. S1, S2, and S5.
Fig. 4 from Lobell et al. (2014)
Fig. 4. Changes in vapor pressure deficit and its impacts. (A) Estimates
of maize yield sensitivity to VPD 61 to 90 days after sowing from a crosssectional regression for each year in the study period, along with best-fit trend
lines with (solid) or without (dashed) including 2012 for computing the trend.
Red dots indicate sensitivity estimates from APSIM simulations with sowing
densities corresponding to the start and end of the study period. (B) Average
July VPD in the study region for historical and projected periods. Dots show
518
2 MAY 2014
VOL 344
progress under high VPD conditions.
One likely explanation for the increased sensitivity to VPD is the continuing trend toward
denser sowing of maize crops. In Illinois, for example, average plant populations have gone from
slightly under 24,000 plants per acre in 1995 to
30,000 by 2012 (a 25% increase over our study
period) (23, 24). Similar trends have occurred
in other Corn Belt states (23). To evaluate this
individual year observations, gray line shows linear trend for 1995 to 2012,
black line shows mean VPD projected using 29 climate models, blue shading
indicates 25th to 75th percentile of model projections, and gray shading indicates 5th to 95th percentiles. (C) Estimated impact of mean VPD projections
on average maize yields using either constant yield sensitivity of –27.5%
per kPa or a linear increase in sensitivity at the historical rate of 7% per kPa
per decade.
SCIENCE
www.sciencemag.org
The study concludes that if corn-growing regions continue to experience hotter and drier Julys,
current projections for corn yield improvements are unlikely to be met:
One implication is that climate change effects may be more severe than
predicted by models that assume current crop genetics and management.
Climate model projections indicate that July VPD for this region will become
more severe, with an expected increase in average VPD of roughly 20% over the
next 50 years (Fig. 4B), driven both by higher temperatures and reduced relative
humidity. At current VPD sensitivity, these VPD trends would reduce yields by
about 15% over the next 50 years. If maize yields continue to become
increasingly sensitive to VPD, then yield losses from VPD trends could be as
much as 30% (Fig. 4C).17
In addition to casting doubt on long-term yield projections for corn (the feedstock used to
produce more than 80% of the biofuel consumed in the United States in 2013), Lobell et al.’s
findings support the point made above that ARB should not use a yield price elasticity value for
corn as a proxy for the elasticity of other crops’ yields. Lobell et al. demonstrate that there are
important physical constraints on corn yields that farmers may not be able to overcome
through the commitment of additional resources. Accordingly, the study suggests that GTAP’s
yield price elasticity value for corn may not be appropriate for corn, much less for other crops.
Consequently, ARB should ensure that the new work by Lobell et al. informs future yield
projections and the effect those projections have on ILUC estimates.
[C]
ARB’s Modeling Framework Undercounts N2O Emissions
The modeling framework used by ARB assumes that yields for a wide range of crops will climb
in response to increased demand for biofuel feedstocks, but it does not adequately account for
the extra emissions associated with the farming techniques that will be utilized to achieve those
higher yields. The likely result of ARB’s approach is that ILUC emissions are undercounted.
Adding fertilizer, for example, results in additional emissions of nitrous oxide (N2O), a potent
greenhouse gas. ARB’s modeling framework currently accounts only for the N2O emissions
that result from fertilization of the feedstock crops used to produce biofuels. This approach
CATF Comments to ARB on ILUC Estimate-May 2014 | 7
ignores the additional use of fertilizer for other crops, even when that additional usage is tied
to an overall rise in crop prices brought about by new demand for energy crops. Under the
existing modeling framework, therefore, the benefit of price-induced yield increases are
counted, while the cost to climate of achieving those increases is not. If ARB accounts for both
sides of the equation—i.e., improved yields and higher N2O emissions—as it should, estimated
ILUC emissions are likely to increase.
In the March 2014 presentation, ARB staff acknowledged that both crop intensification and
crop extensification associated with increased biofuel demand could result in additional N2O
emissions.18 We urge ARB to fully account for these emissions when estimating ILUC
emissions.
[D]
GTAP’s Treatment of Marginal Crop Yields Increases
Uncertainty
One of the recent changes to GTAP that contributed to the proposed reduction in ILUC
emissions relates to how the model represents yield on newly converted cropland. GTAP
previously relied on a single value of 0.66 to represent the relative productivity of newly
converted land,19 until Taheripour et al. (2012) used the Terrestrial Ecosystem Model (TEM) to
estimate relative yields on a regional basis.20 The shift to regionalized estimates is an
improvement conceptually, but the implementation of this change creates additional
uncertainty—leaving in doubt whether this change produces a better representation of reality.
To implement this change, Taheripour et al. estimated the average net primary productivity
(NPP) of a single crop—based on corn grown in the US Corn Belt—for land not currently used
for crop production in each Region-AEZ combination, and the average NPP of land currently in
crop production in that Region-AEZ.21 The ratio of these NPP values—truncated to a
maximum value of 1.022—is used as a proxy for the relative yield of newly converted cropland.23
This approach implicitly incorporates the following assumptions:
•
•
•
•
•
That Iowa’s 1996 corn season is an appropriate proxy for all crops grown around the world.
(TEM is parameterized using data for corn grown in 1996 in Iowa, one of the world’s
most productive corn producing regions.)
That NPP is a good proxy for yield, and the difference in yield between these two land-use
classes is best represented as a constant ratio (A/B) rather than, say, a constant difference (AB).
That TEM’s estimate of NPP is correct. (Pan et al. (1996) performed sensitivity analysis on
the TEM model (version 4.0), showing that estimated NPP is sensitive to different
assumptions about soil texture, temperature, precipitation, and radiation—all of which
may vary within a given Region-AEZ.24)
That the average NPP of all land not in crop production is a good approximation of NPP on the
land actually converted. (This assumption holds true only when land selection is random
or there is little variability of NPP across land in the Region-AEZ. Neither of these are
claimed to be the case in the study.)
That truncating some of the NPP ratios to 1.0 produces a valid estimate of marginal yield.
(Taheripour et al. make this adjustment in their 2012 study as a way of recognizing the
unlikelihood that yields are better on land not being used for production. It remains
unclear, however, why this adjustment is necessary if the basic method of computing
CATF Comments to ARB on ILUC Estimate-May 2014 | 8
NPP and using the ratio is valid. In other words, if the method produces values that are
believed to be unrealistically high in some cases, what basis is there to believe that the
other values produced by TEM (i.e., those <1.0) are not likewise too high?)
In principle, regionalized estimates of marginal yield can produce more accurate model results.
Whether this is true in practice, however, depends on how the regionalized values are
determined. It is unclear whether the present implementation brings GTAP results closer to
reality or further from it.
Conclusion
CATF believes that California’s LCFS can play a globally important role in identifying and
promoting fuels that can meaningfully reduce GHG emissions from transportation. We
therefore appreciate the opportunity to help ARB ensure that the best and most current
research is used to assess the carbon intensities of different fuels, particularly biofuels.
In order to develop a more reliable ILUC estimate, CATF urges ARB should ensure that its
model fully appreciates the extent to which water scarcity will constrain future crop expansion,
effectively differentiates commercial forest from non-commercial forests, and utilizes the most
comprehensive and up-to-date data on yield improvements.
Sincerely,
Jonathan F. Lewis
Senior Counsel—Climate Policy
Clean Air Task Force
18 Tremont Street, Suite 530
Boston, MA 02108
[email protected]
617.624.0234
CATF Comments to ARB on ILUC Estimate-May 2014 | 9
ENDNOTES
1
John Courtis, Anil Prabhu, Farshid Mojaver, and Kamran Adili. iLUC Analysis for the Low
Carbon Fuel Standard (Update), California Air Resources Board, (March 11, 2014) (hereafter
“March 2014 Staff Presenation”).
2
Farzad Taheripour, Quinlai Zhuang, Wallace E. Tyner, and Xioliang Lu. Biofuels, Cropland
Expansion, and the Extensive Margin. ENERGY, SUSTAINABILITY AND SOCIETY 2012 (hereafter
“Taheripour et al. (2012)”)
3
Farzad Taheripour, Thomas W. Hertel and Jing Liu. The Role of Irrigation in Determining the
Global Land Use Impacts of Biofuels. ENERGY, SUSTAINABILITY AND SOCIETY 2013. 3 (emphasis
added) (hereafter “Taheripour et al. (2013)”).
4
Id. at 1-2.
5
Id. at 2.
6
Id. at 2.
7
Taheripour et al. (2012) at 6.
8
Taheripour et al. (2013) at 9.
9
March 2014 Staff Presentation at 61.
10
March 2014 Staff Presentation at 42.
11
Id. at 43.
12
Taheripour et al. (2013) at 1.
13
Id. at 45.
14
Id. at 45.
15
David B. Lobell et al. Greater Sensitivity to Drought Accompanies Maize Yield Increase in the
U.S. Midwest. SCIENCE 2014. 516.
16
Id. at 517.
17
Id. at 519.
18
March 2014 Staff Presentation at 47-48.
19
See Thomas W. Hertel et al. Global Land Use and Greenhouse Gas Emissions Impacts of US
Maize Ethanol: Estimating Market-Mediated Responses. BIOSCIENCE 2010.
20
See Taheripour et al. (2012).
21
Id. at 3.
22
Id. at 8.
23
Id. at 3.
24
Yude Pan, et al. The Importance of Climate and Soils for Estimates of Net Primary
Production: A Sensitivity Analysis with the Terrestrial Ecosystem Model. GLOBAL CHANGE
BIOLOGY 1996.
CATF Comments to ARB on ILUC Estimate-May 2014 | 10
© Copyright 2026 ExpyDoc