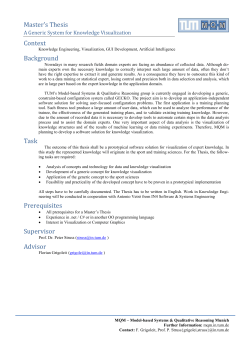
International Journal of Engineering Trends and Technology (IJETT) – Volume 13 Number 4 – Jul 2014
Development of a Visualization System for Climate
Data Analysis
K C Gouda#1, Chowdari K K*2, Nagaraj Bhat#3, S N Chandrashekar *4
#
CSIR Centre for Mathematical Modelling and Computer Simulation (C-MMACS)
Wind tunnel Road, NAL Belur Campus, Bangalore-37, India
*
Department of Computer Science and Engineering,
SJCIT (Visveswaraya Technological University), Chikkaballpur, Bangalore, India
Abstract— Now a days the concern about the climate studies is
being increasing world over because of the natural disasters
across the globe. In the present study an attempt is being made
for developing a software system for Climate data Visualisation.
The main aim is the development of an user friendly tool for the
analysis as well as visualization representation of multi-source
and multi-scale weather and climate data, which can be used for
the efficient and real time analysis of weather and climate
studies. On the growing importance of climate studies and High
Performance Computing, different users starting from a farmer
to a scientist to a policy maker needs to understand the various
changes in the weather and climate parameters
like
Temperature, rainfall, humidity etc. Data discovery from multisource like satellite, automatic weather station, reanalysis
products and numerical weather prediction model outputs can be
easily used and analysed.
Keywords— Visualisation, Weather and Climate Data, Analysis,
Weather and Climate Parameters.
I. INTRODUCTION
Weather is the state of the atmosphere, to the degree that it
is hot or cold, wet or dry, calm or stormy, clear or
cloudy. Most
weather
phenomena
occur
in
the troposphere, just
below
the stratosphere.
Weather
generally
refers
to
day-to-day
temperature
and precipitation activity, whereas climate is the term for the
average atmospheric conditions over longer periods of
time. When used without qualification, "weather" is
understood to be the weather of Earth.
Weather forecasting is the application of science and
technology to predict the state of the atmosphere for a future
time and a given location. Human beings have attempted to
predict the weather informally for millennia, and formally
since at least the nineteenth century. Weather forecasts are
made by collecting quantitative data about the current state of
the atmosphere and using scientific understanding of
atmospheric processes to project how the atmosphere will
evolve.
Climate encompasses the statistics of temperature, humidity,
atmospheric
pressure, wind, precipitation,
atmospheric
particle
count
and
other meteorological elemental
measurements in a given region over long periods. Climate
ISSN: 2231-5381
can be contrasted to weather, which is the present condition of
these elements and their variations over shorter periods. A
region's climate is generated by the climate system, which has
five components: atmosphere, hydrosphere, cryosphere, land
surface, and biosphere.
With growth of computing power, virtualization techniques,
satellite data and weather models now a days it can be
possible to disseminate the information of weather and climate
in a nice and user friendly way, which in turn can be easily
used by various users like farmer, water manager, engineers to
the policy maker.
The main objective of this study is to develop a GUI based
platform for the visualization and analysis of multi-source and
multi-format satellite and model derived climatological
parameters like sea surface temperature, wind, temperature,
cloud, humidity etc.
II. SOFTWARE AND TOOLS USED
A. GrADS
The Grid Analysis and Display System (GrADS) is an
interactive desktop tool that is used for easy access,
manipulation, and visualization of earth science data.
GrADS [1] uses a 5-Dimensional data environment: the
four conventional dimensions (longitude, latitude, vertical
level, and time) plus an optional 5th dimension for grids that
is generally implemented but designed to be used for
ensembles.
Data may be displayed using a variety of graphical
techniques: line and bar graphs, scatter plots, smoothed
contours, shaded contours, streamlines, wind vectors, grid
boxes, shaded grid boxes, and station model plots.
B. Ferret
Ferret is a workstation-based visualization and analysis
environment designed to meet the needs of physical scientists
studying global ocean-climate interactions [2]. Ferret was
developed as an adjunct to the numerical modelling studies of
the Thermal Modelling and Analysis Project (NOAA/TMAP).
Ferret was created in the belief that unifying data management,
http://www.ijettjournal.org
Page 166
International Journal of Engineering Trends and Technology (IJETT) – Volume 13 Number 4 – Jul 2014
analysis, and visualization and placing them directly in the
hands of scientists would lead to new levels of productivity.
C. Microsoft Visual Studio 2010
Microsoft Visual Studio is an integrated development
environment (IDE) from Microsoft. It is used to
develop console and graphical
user
interface
applications along
with Windows
Forms
or
WPF
applications, web sites, web applications, and web services in
both native code together with managed code for all platforms
supported
by Microsoft
Windows, Windows
Mobile, Windows CE, .NET Framework, .NET Compact
Framework and Microsoft Silverlight.
III. SYSTEM DESIGN
A. Data Flow Diagram
The data flow diagram of the project work is described in
the figure 1 below. In the 1st step multi-source data are taken,
then through the algorithm the spatio-temporal analysis are
being computed and finally the output are post processed by
using GrADS and in C#. Finally the output in image format is
presented. The GUI is also developed in C#. Here the data
from IMD [3 ],TRMM [4 ] and NCEP [5 ] are used.
Visual Studio includes a code editor supporting IntelliSense
as well as code refactoring. The integrated debugger works
both as a source-level debugger and a machine-level debugger.
Other built-in tools include a forms designer for building GUI
applications, designer, class designer, and database schema
designer. It accepts plug-ins that enhance the functionality at
almost every level—including adding support for sourcecontrol systems (like Subversion and Visual SourceSafe) and
adding new toolsets like editors and visual designers for
domain or toolsets for other aspects of the software
development lifecycle
D. C(Programming Language)
Fig. 1 Data Flow Diagram
C is an imperative (procedural) language. It was designed to
be compiled using a relatively straightforward compiler, to
provide low-level access to memory, to provide language
constructs that map efficiently to machine instructions, and to
require minimal run-time support. C was therefore useful for
many applications that had formerly been coded in assembly
language, such as in system programming.
C has facilities for structured programming and allows
lexical variable scope and recursion, while a static type system
prevents many unintended operations. In C, all executable
code is contained within subroutines, which are called
"functions". Function parameters are always passed by value.
Pass-by-reference is simulated in C by explicitly passing
pointer values. C program source text is free-format, using
the semicolon as a statement terminator and curly braces for
grouping blocks of statements.
E. C#(Programming Language)
C#
is
a multi-paradigm
programming
language
encompassing strong
typing, imperative,
declarative,
functional, procedural, generic,
object (class-based)
and
component-oriented programming disciplines. It is intended to
be a simple, modern, general-purpose, object-oriented
programming language.
ISSN: 2231-5381
Fig 2 Schematic of system analysis.
In the present system analysis basically three work steps are
considered, firstly collect the multi-source satellite data,
check the quality control like missing data etc. Then analysis
the data as well as run the prediction model using the real
time data as the initial condition, finally the post processing
using the visualization software like GrADS for the easy
dissemination of the results to the users. The schematic of the
proposed system analysis is presented in figure 2.
http://www.ijettjournal.org
Page 167
International Journal of Engineering Trends and Technology (IJETT) – Volume 13 Number 4 – Jul 2014
IV. RESULTS AND DISCUSSIONS
The GUI and the visualization are well implemented and
tested the user input like the parameters to be extracted from
database and analysis is presented in the figure 3. Which
basically allows the users to select the parameters like
temperature, rainfall, wind, humidity etc.
Fig 5 Final output in contour map
Fig. 3 User input to select the parameters to be plotted
After selection of the data the corresponding global data
breing fetched by the algorithm then the domain selection and
time selection options should be provided by the user
depending upon the area of interest. The drop down menu is in
the left side of the GUI presented in figure 4.
Fig 6 Screenshot of Visualizations (shaded) of regional map over India
V. CONCLUSIONS
In this work a GUI based platform is developed which is a
user friendly tool for the analysis as well as visualization
representation of multi-source and multi-scale weather and
climate data. This can be used for the efficient and real time
analysis of weather and climate studies, model derived
climatological parameters such as sea surface temperature,
wind, atmospheric temperature, cloud, humidity etc.
It can be used as a very robust tool for the visualization of
multi-scale weather data with metadata. It can also be used for
the weather informatics for users like farmers, water
managers, disaster managers etc. It ensures well
representation of spatial (map) and temporal data. It could also
be used in statistical analysis over regions of interest also can
be interfaced with web for the web visualization.
Fig. 4 Screenshot of developed GUI for Visualizations of global map to
select the domain of interest
After getting the spatial and temporal extent the system
uses the spatio-temporal data analysis algorithm and also the
statistical analysis like the area averaging, time averaging,
generation of climatology over an area as well as the time
average at a single position etc. and the final spatial results are
generated and visualised with GrADS background analysis.
Fig 5 and 6 represents respectively the contour and shaded
map of the rainfall over Indian land mass as well as over the
adjoining seas like Bay of Bengal in east and Arabian sea in
the west.
ISSN: 2231-5381
ACKNOWLEDGMENT
The second author acknowledges HOD, Dept of CSE,
Department of Computer Science and Engineering and
Principal, SJCIT (VTU), CHIKKABALLPUR, Bangalore,
India for their support and encouragement.
[1]
[2]
[3]
[4]
[5]
REFERENCES
www.ferret.pmel.noaa.gov
www.iges.org/grads
http://www.imd.gov.in
http://www.trmm.gsfc.nasa.gov
www.ncep.noaa.gov/
http://www.ijettjournal.org
Page 168
© Copyright 2026 ExpyDoc