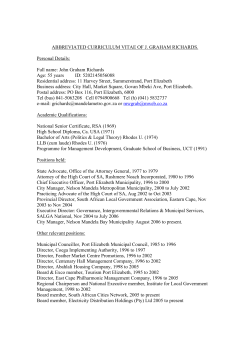
l Equity Research l China l Industrial Transportation 16 April 2014 COSCO Pacific Potential Qingdao Port IPO could crystallise value COSCO Pacific’s (CP) valuation at 11x 2014E PER is OUTPERFORM (unchanged) compelling, in our view. Both forward PER and PBR are PRICE as of 15 Apr 2014 PRICE TARGET lower than 1SD below the five-year average. 1Q14 ended with the closure of CP’s USD 212mn acquisition of a stake in Asia Container Terminal (ACT). We think CP is back in the acquisition mode, which should drive nonorganic growth higher. A potential IPO in the China port sector in 2014 could be a catalyst. ACT acquisition to facilitate mega vessel calls. In March 2014, CP acquired a 40% stake in ACT from Hutchison Port (HPHT SP, OP, PT SGD 0.75) at a USD 212mn consideration. The deal valuation appears inexpensive from an assets perspective, but expensive from an earnings perspective. Previously, ACT sourced almost all cargo from HPHT at a low transaction price; hence earnings were downward biased. We believe CP is likely to improve ACT’s EBITDA margin to the level of COSCO-HIT Terminals, as joint operations allow them to serve mega container vessels more efficiently. Potential Qingdao Port IPO could crystallise value. According to a Bloomberg report on 31 March, Qingdao Port Group plans to raise c.USD 500mn through an IPO in HK in 2Q14. CP has two JVs with Qingdao Port Group – Qiangdao Qianwan Container Terminal (CP owns 20%) and Dongjiakou Iron Ore Terminal (CP owns 25%). We think a potential IPO will partially crystallise the value of CP’s stakes in the two JVs and serve as a catalyst. Leasing yields should improve. We expect leasing yields to recover to 10% in 2014 from 9.3% in 2013, as container inventory has been digested after global leasing firms slowed expansion in 2H13. While container liners will continue to receive mega vessels in 2014-16 and have sharply cut their capex for boxes, they will source boxes mainly from leasing firms. CP has a more aggressive container purchase plan in 2014 for satisfying COSCO Container Lines’ demand and thus revenue should increase with fleet expansion of 12%, in our estimates. Valuations. We lower our 2014/15E earnings by 25%/26% due to slower than expected recovery in global trade. We roll over our SOTP-based valuation to 2014 and trim our PT to HKD 12.5 from HKD 13.0. Claire Teng, CFA Ai Lin Kuo, CFA +852 3983 8525 Equity Research Standard Chartered Bank (HK) Limited +852 3983 8506 Equity Research Standard Chartered Bank (HK) Limited HKD 10.58 HKD 12.50 Bloomberg code Reuters code 1199 HK 1199.HK Market cap 12-month range HKD 28,690mn (USD 3,700mn) HKD 9.27 - 12.44 EPS adj. est. change 2014E Year-end: December Sales (USD mn) EBITDA (USD mn) EBIT (USD mn) Pre-tax profit (USD mn) Net profit adj. (USD mn) FCF (USD mn) EPS adj. (USD) DPS (USD) Book value/share (USD) EPS growth adj. (%) DPS growth (%) EBITDA margin (%) EBIT margin (%) Net margin adj. (%) Div. payout (%) Net gearing (%) ROE (%) ROCE (%) EV/sales (x) EV/EBITDA (x) PBR (x) PER adj. (x) Dividend yield (%) -25.2% 2013 799 429 239 751 309 (157) 0.11 0.10 1.61 -10.7 96.3 53.7 29.9 38.7 40.2 16.7 16.5 3.7 9.4 17.5 0.8 13.2 6.9 2015E 2014E 920 476 272 386 353 (899) 0.13 0.05 1.69 14.1 -50.2 51.7 29.6 38.3 40.0 34.9 7.6 4.0 8.1 15.7 0.8 10.9 3.7 2015E 1,017 560 320 443 400 (10) 0.14 0.06 1.77 13.5 13.6 55.1 31.5 39.4 40.0 34.7 8.2 4.5 7.5 13.7 0.8 9.6 4.2 -26.1% 2016E 1,110 620 368 509 460 7 0.16 0.07 1.87 14.8 14.9 55.9 33.1 41.4 40.0 34.2 8.9 5.0 7.1 12.7 0.7 8.3 4.8 Source: Company, Standard Chartered Research estimates Share price performance COSCO Pacific HANG SENG INDEX (rebased) 13.0 11.0 9.0 Apr-13 Jul-13 Share price (%) Ordinary shares Relative to index Relative to sector Major shareholder Free float Average turnover (USD) Oct-13 Jan-14 Apr-14 -1 mth -3 mth -12 mth 1 5 3 -4 6 -1 China COSCO (42.7%) 57% 6,326,404 Source: Company, FactSet Important disclosures can be found in the Disclosures Appendix All rights reserved. Standard Chartered Bank 2014 1199 HK HKD 10.5 8 HKD 12.5 0 http://research.standardchartered.com Equity Research l COSCO Pacific Valuations Figure 1: CP – Sum-of-the-parts (SOTP) model Valuation method Base year Earnings contributions Equity value PER Holdings NAV contribution % of NAV COSCO-HIT DCF 2014 16.1 ACT DCF 2014 1.2 359 11.1 50% 180 3.6% 228 174.2 40% 212 4.2% Yantian Phs I-III DCF 2014 Guangzhou Nansha Phase II DCF 2014 58.0 3,667 13.0 21% 754 15.0% 8.9 490 21.6 39% 191 Quanzhou Pacific DCF 3.8% 2014 8.3 114 9.8 71% 81 Jinjiang Pacific 1.6% DCF 2014 2.1 25 9.3 80% 20 0.4% Xieman Haicang DCF 2014 (11.2) 162 (10.1) 70% 113 2.3% Kao Ming DCF 2014 0.3 153 52.3 10% 15 0.3% SCT DCF 2014 - - na 10% - 0.0% Waigaoqiao/ Yanshan DCF 2014 20.1 600 8.9 30% 180 3.6% Ningbo Beilun IV DCF 2014 17.8 1,703 19.1 20% 341 6.8% Zhangjiagang Wing Hanverky DCF 2014 3.4 100 15.1 51% 51 1.0% Yangzhou DCF 2014 1.7 27 8.7 56% 15 0.3% Nanjin DCF 2014 2.2 226 20.2 20% 45 0.9% Taicang DCF 2014 1.2 183 57.4 39% 71 1.4% Qingdao Qianwan DCF 2014 31.2 3,278 21.0 20% 656 13.0% DPCM DCF 2014 1.5 304 39.6 20% 61 1.2% Tianjin Five Continents DCF 2014 2.0 216 15.3 14% 30 0.6% Euroasia DCF 2014 1.7 98 17.0 30% 29 0.6% Yingkou Port DCF 2014 1.2 62 25.2 50% 31 0.6% COSCO PSA DCF 2014 1.1 38 16.6 49% 19 0.4% Antwerp DCF 2014 (0.9) 84 (19.4) 20% 17 0.3% Suez Canal DCF 2014 11.5 833 14.5 20% 167 3.3% Piraeus Port DCF 2014 100% Port Total Ports Container leasing Total Adjusted net debt (corporate debt) NAV PER 2014 26.0 516 19.9 205.6 13,467 18.5 145 1,161 8.0 100% 516 10.3% 3,795 75.4% 1,161 23.1% 4,956 98.4% 79 1.6% 5,035 100.0% NAV per share in HK$ 13.9 Discount for SOTP 12.5 Source: Standard Chartered Research 16 April 2014 2 Equity Research l COSCO Pacific Figure 2: CP – Forward PE standard deviation Current valuation is lower than 1SD below the average CP’s five-year average PER is 12.3x 18 17 16 +2 SD 15 +SD PER 14 13 Mean 12 11 -1 SD 10 9 8 May-09 -2 SD Jan-10 Sep-10 Jun-11 Feb-12 Oct-12 Jul-13 Mar-14 Source: FactSet, Standard Chartered Research Figure 3: CP – Forward PB standard deviation Current valuation is lower than 1SD below the average CP’s five-year average PBR is 1.1x 1.9 1.7 +2 SD PBR 1.5 +SD 1.3 Mean 1.1 -1 SD 0.9 0.7 May-09 -2 SD Jan-10 Sep-10 Jun-11 Feb-12 Oct-12 Jul-13 Mar-14 Source: FactSet, Standard Chartered Research 16 April 2014 3 Equity Research l COSCO Pacific Figure 4: CP – Historical dividend yield range Current yield is slightly below the historical average CP’s five-year average dividend yield is 4.5% 10% 9% 8% 7% +2 STD 6% +1 STD 5% Mean 4% -1 STD 3% -2 STD 2% 1% 0% May-09 Nov-09 May-10 Nov-10 May-11 Nov-11 May-12 Nov-12 May-13 Nov-13 Source: FactSet, Standard Chartered Research 16 April 2014 4 Equity Research l COSCO Pacific Potential Qingdao Port Group IPO could crystallise value According to a Bloomberg report on 31 March 2014, Qingdao Port Group plans to raise c.USD 500mn through an IPO in Hong Kong in 2Q14. CP has two joint ventures with Qingdao Port Group – Qingdao Qianwan Container Terminal (QQCT, 20% owned by CP) and Dongjiakou Iron Ore Terminal (DJK Terminal, 25% owned by CP). We think Qingdao Port is the best quality port in North China. Qingdao Port is the largest container port in Northern China and its strong growth is supported by competitive industries in Shangdong Province. Qingdao is also one of the largest ore ports in China and should benefit from China’s increasing dependence on imported ores. Given high utilisation and limited space for expansion in the existing port area, the Qingdao municipal government has chosen Dongjiakou, 80km away from the existing port area, to expand. A doubling of capacity in Dongjiakou should facilitate Qiangdao Port’s long-term growth. We think a potential IPO of Qingdao Port Group will partially crystallise the value of CP’s stake in the QQCT and DJK Terminals and serve as a share price catalyst. Qingdao Port: In a sweet spot Qingdao Port was the sixth-largest container port, the largest iron ore port and the largest oil port in China in 2013. Qingdao Port and Guangzhou Port are the only two unlisted ports among the top ten ports in China. Figure 6: China’s busiest port by freight throughput (2013) Qingdao is the sixth busiest port in China 40 35 25 mn tonnes mn TEU 30 20 15 10 Shanghai Shenzhen Hong Kong Ningbo Guangzhou Qingdao Tianjin Dalian Xiamen Lianyunga… Yingkou Yantai Rizhao Fuzhou Quanzhou Dandong Zhongshan Shantou Haikou Jiaxing 5 - Source: Ministry of Transport of China, Census and Statistics Department of HKSAR, Standard Chartered Research 900 800 700 600 500 400 300 200 100 - Ningbo Shanghai Tianjin Guangzhou Tangshan Qingdao Dalian Yingkou Rizhao Hong Kong … Shenzhen Yantai Lianyungang Zhanjiang Xiamen Huanghua Fuzhou Dandong Quanzhou Figure 5: China’s busiest container ports (2013) Qingdao is the sixth-largest container port in China Source: Ministry of Transport of China, Census and Statistics Department of HKSAR, Standard Chartered Research Throughput In 2013, Qingdao Port handled 450mt of cargo (up 10.6 % YoY), including 15.5mn TEU of containers (up 6.8% YoY) and 110mt of iron ore. Port areas The broader Qingdao Port consists of four areas – Qianwan Port Area, Dongkiakou Port Area (DJK Port Area), Qingdao Old Port Area and Huangdao Oil Port Area. 16 April 2014 5 Equity Research l COSCO Pacific 16 April 2014 1) Qianwan Port Area is a major operating area and accounts for 80% of the total throughput of Qingdao Port. There are a total of 29 berths in four phases of Qianwan Port area. QQCT owns and operates all 21 container berths (including 15 that are operational and 6 to be developed) in Qianwan Port Area directly or via joint ventures, and handles 100% container throughput of the Qingdao Port. After the Qingado municipal government approved the Qingdao Dongjiakou Port Area Development Plan in 2008, Qianwan Port Area is positioned to focus on international container handling, and its bulk cargos and domestic containers will be gradually diverted to DKJ Port Area. 2) DJK Port Area is a newly developed port area with an aim to double Qingdao Port’s capacity in the long run. It has a total of 112 berths and designed capacity of 370mt. Currently, it has 20 berths in 6 terminals that are operational, with a total handling capacity of 220mt. Given the port area is relatively new, utilisation was only 32% in 2013. It is located 80km south-west of Qianwan Port Area and covers a land area of 150 sqkm. 3) Qingdao Old Port Area is the closet to the city centre of Qingdao and is being redeveloped to operate as a cruise terminal. The cruise terminal building is under construction and will likely start operations in 2015. 4) Huangdao Oil Port Area is engaged in oil and LNG handling, representing 40% of the crude oil handled in Qingdao Port. After the deadly oil pipe explosion accident in November 2013, the Qingdao municipal governmnet decided to relocate crude oil terminals to DJK Port Area. 6 Equity Research l COSCO Pacific CP’s presence in Qingdao Port Qianwan Port Area – QQCT Container handling in Qianwan Port Area, including 21 berths, are run and owned by QQCT directly or via its subsidiaries and joint ventures. A four-party joint venture, including CP (20%), Dubai World (29%), Maersk (20%) and Qingdao Port Group (31%) own QQCT. Some of QQCT’s berths are owned and run by joint ventures formed by QQCT or its subsidiaries and other companies, including China Merchants Holdings (CMH), Neptune Orient Lines (NOL) and SITC International Holdings. Figure 7: Shareholding structure of Qingdao Port’s container handling business If Qingdao Port Group is listed, it could partially crystallise the value of CP’s stake in QQCT COSCO Pacific Dubai World 20% 29% Maersk Qingdao Port Group 31% 20% Qingdao Qianwan Container Terminal (QQCT) Operates 11 berths directly and owns 10 berths via QQCTN; handled 15mn TEU in 2013 80% China Merchants Holdings (CMH) Pan Asia International Shipping Ltd 20% Qingdao New Qianwan Container Terminal (QQCTN) Owns 10 berths, of which 6 are not developed yet and 4 are operated by JV QQCTU 50% 50% Qingdao Qianwan United Container Terminal (QQCTU) Operates 4 berths owned by QQCTN and 5 berths owned by CMH; handled 5mn TEU in 2013 APL-SITC A JV between NOL and SITC Of the 9 berths that are operational, 7 are run directly and 2 are run by JV QQCTUA 70% 30% Qingdao Qianwan United Advance Container Terminal (QQCTUA) Operates 2 berths owned by QQCTU, handled 2mn TEU in 2013 Source: Respective companies, Standard Chartered Research DJK Port Area – DJK Terminal DJK Port Area was designed to accommodate all iron ore throughput diverted from Qianwan Area, in the long term. Currently, there are two iron ore berths that are operational (one 300k dwt and one 200k dwt). Both are operated by DJK Terminal. The throughput of the two berths represented c.26% of total iron ore throughput of Qingdao Port in 2013. In May 2013, a joint venture was formed by CP (owns a 25% stake in the JV), CMH (25%), Qingdao Port Group (30%) and IMC Group (20%) to acquire DJK Terminal from Qingdao Port Group at a consideration of RMB 1.4bn. The capital was injected in February 2014 and CP and CMH should start booking joint-venture profits from 2Q14. The designed handling capacity of DJK Terminal is 29mt currently and could be expanded to 59mt. It was running at close to full utilisation in 2013. 16 April 2014 7 Equity Research l COSCO Pacific Figure 8: Shareholding structure of Dongjiakou Iron Ore Terminal If Qingdao Port Group is listed, it could partially crystallise the value of CP’s stake in DJK Terminal COSCO Pacific 25% China Merchants Holdings 25% Qingdao Port Group IMC Group 30% 20% Dongjiakou Iron Ore Terminal Source: Respective companies, Standard Chartered Research DJK Port Area – other projects A total of six terminals in DJK Port Area are operational. Besides DJK Terminal, other terminals that are operational include Huaneng Multi-purpose Terminal Project and Expansion Projects (51% invested by Huaneng Power International and 49% by Qingdao Port Group). Terminal projects under construction in DJK Port Area include Shandong LNG Terminal Phase I and Datang Multi-purpose Terminal. Many petrochemical companies have signed joint ventures with Qingdao Port Group to develop terminals in DJK Port Area, including Sinopec and Vopak. 16 April 2014 8 Equity Research l COSCO Pacific Income statement (USD mn) Year-end: Dec Sales Gross profit SG&A Other income Other expenses EBIT Net interest Associates Other non-operational Exceptional items Pre-tax profit Taxation Minority interests Exceptional items after tax Net profit Cash flow statement (USD mn) 2012 736 315 (92) 2 0 225 (68) 223 0 2 382 (28) (12) 0 342 2013 799 318 (90) 11 0 239 (66) 177 7 394 751 (33) (15) 0 703 2014E 920 371 (101) 2 0 272 (59) 166 6 0 386 (27) (7) 0 352 2015E 1,017 429 (112) 3 0 320 (69) 187 5 0 443 (35) (8) 0 399 2016E 1,110 487 (122) 3 0 368 (69) 206 5 0 509 (41) (10) 0 459 333 393 309 429 353 476 400 560 460 620 0.13 0.12 0.05 2,712 0.25 0.11 0.10 2,816 0.12 0.13 0.05 2,816 0.14 0.14 0.06 2,816 0.16 0.16 0.07 2,816 Year-end: Dec Cash Short-term investments Accounts receivable Inventory Other current assets Total current assets 2012 849 0 222 13 9 1,092 2013 1,238 0 224 19 0 1,481 2014E 281 0 259 22 0 562 2015E 205 0 286 24 0 515 2016E 132 0 312 26 0 469 PP&E Intangible assets Associates and JVs Other long-term assets Total long-term assets 3,718 10 2,206 338 6,271 4,168 10 1,498 395 6,070 5,289 10 1,581 395 7,274 5,528 10 1,674 395 7,607 5,789 10 1,777 395 7,971 Total assets 7,364 7,551 7,836 8,122 8,440 Short-term debt Accounts payable Other current liabilities Total current liabilities 775 358 7 1,141 276 465 90 830 276 531 90 896 276 569 90 935 276 603 90 968 Long-term debt Convertible bonds Deferred tax Other long-term liabilities Total long-term liabilities 1,827 0 0 179 2,006 1,770 0 0 107 1,878 1,770 0 0 107 1,878 1,770 0 0 107 1,878 1,770 0 0 107 1,878 Total liabilities 3,146 2,708 2,774 2,812 2,846 Shareholders’ funds Minority interests 3,954 263 4,546 297 4,757 305 4,997 313 5,272 323 Total equity 4,217 4,843 5,062 5,310 5,595 Total liabilities and equity 7,364 7,551 7,836 8,122 8,440 Net debt (cash) Year-end shares (mn) 1,752 2,712 809 2,816 1,765 2,816 1,841 2,816 1,914 2,816 Net profit adj. EBITDA EPS (USD) EPS adj. (USD) DPS (USD) Avg fully diluted shares (mn) Balance sheet (USD mn) Year-end: Dec EBIT Depreciation & amortisation Net interest Tax paid Changes in working capital Others Cash flow from operations 2012 225 168 (83) (18) 192 (153) 331 2013 239 190 (86) (21) 98 (46) 374 2014E 272 203 (59) (27) 29 6 425 2015E 320 240 (69) (35) 9 5 470 2016E 368 252 (69) (41) 6 5 520 Capex Acquisitions & Investments Disposals Others Cash flow from investing (710) (21) 6 218 (507) (532) 1,169 51 71 759 (1,324) 0 0 83 (1,241) (480) 0 0 93 (387) (513) 0 0 103 (410) Dividends Issue of shares Change in debt Other financing cash flow Cash flow from financing (45) 0 486 0 442 (113) 2 (621) (5) (737) (141) 0 0 0 (141) (160) 0 0 0 (160) (184) 0 0 0 (184) 266 (379) 397 (157) (957) (899) (76) (10) (73) 7 Change in cash Exchange rate effect Free cash flow Financial ratios and other Year-end: Dec Operating ratios Gross margin (%) EBITDA margin (%) EBIT margin (%) Net margin adj. (%) Effective tax rate (%) Sales growth (%) Net income growth (%) EPS growth (%) EPS growth adj. (%) DPS growth (%) 2012 2013 2014E 2015E 2016E 42.9 53.4 30.6 45.3 7.3 22.8 -12.0 -12.0 -6.3 -10.9 39.8 53.7 29.9 38.7 4.5 8.6 105.3 97.7 -10.7 96.3 40.4 51.7 29.6 38.3 7.0 15.2 -49.9 -49.9 14.1 -50.2 42.2 55.1 31.5 39.4 8.0 10.5 13.6 13.6 13.5 13.6 43.9 55.9 33.1 41.4 8.0 9.1 14.9 14.9 14.8 14.9 Efficiency ratios ROE (%) ROCE (%) Asset turnover (x) Op. cash/EBIT (x) Depreciation/capex (x) Inventory days Accounts receivable days Accounts payable days 9.0 3.8 0.1 1.5 0.2 9.6 119.5 243.1 16.5 3.7 0.1 1.6 0.4 12.1 102.0 312.6 7.6 4.0 0.1 1.6 0.2 13.7 95.8 331.0 8.2 4.5 0.1 1.5 0.5 14.2 97.7 341.2 8.9 5.0 0.1 1.4 0.5 14.4 98.3 343.3 Leverage ratios Net gearing (%) Debt/capital (%) Interest cover (x) Debt/EBITDA (x) Current ratio (x) 41.6 41.8 2.9 6.1 1.0 16.7 30.4 2.8 5.4 1.8 34.9 29.5 3.8 4.3 0.6 34.7 28.5 4.5 3.7 0.6 34.2 27.4 5.1 3.3 0.5 Valuation EV/sales (x) EV/EBITDA (x) EV/EBIT (x) PER (x) PER adj. (x) PBR (x) Dividend yield (%) 10.7 20.0 34.9 11.0 11.3 1.0 3.7 9.4 17.5 31.4 5.8 13.2 0.8 6.9 8.1 15.7 27.5 10.9 10.9 0.8 3.7 7.5 13.7 23.9 9.6 9.6 0.8 4.2 7.1 12.7 21.3 8.3 8.3 0.7 4.8 Source: Company, Standard Chartered Research estimates 16 April 2014 9 Equity Research l COSCO Pacific Disclosures appendix The information and opinions in this report were prepared by Standard Chartered Bank (Hong Kong) Limited, Standard Chartered Bank Singapore Branch, Standard Chartered Securities (India) Limited, Standard Chartered Securities Korea Limited and/or one or more of its affiliates (together with its group of companies, ”SCB”) and the research analyst(s) named in this report. THIS RESEARCH HAS NOT BEEN PRODUCED IN THE UNITED STATES. Analyst Certification Disclosure: The research analyst or analysts responsible for the content of this research report certify that: (1) the views expressed and attributed to the research analyst or analysts in the research report accurately reflect their personal opinion(s) about the subject securities and issuers and/or other subject matter as appropriate; and (2) no part of his or her compensation was, is or will be directly or indirectly related to the specific recommendations or views contained in this research report. On a general basis, the efficacy of recommendations is a factor in the performance appraisals of analysts. Where “disclosure date” appears below, this means the day prior to the report date. All share prices quoted are the closing price for the business day prior to the date of the report, unless otherwise stated. Recommendation and price target history for COSCO Pacific HKD 16.74 14.97 2 3 13.21 1 11.44 9.68 7.91 May-11 Date Aug-11 Nov-11 Recommendation Feb-12 May-12 Price target Aug-12 Date Nov-12 Feb-13 Recommendation 1 25 Aug 11 IN-LINE 11.00 2 8 Jan 13 Source: FactSet prices, SCB recommendations and price targets May-13 Price target OUTPERFORM 14.00 Aug-13 Date Nov-13 Feb-14 Recommendation May-14 Price target 3 26 Mar 13 OUTPERFORM 13.00 Recommendation and price target history for Hutchison Port Holdings Trust USD 0.96 0.88 3 0.80 4 2 5 0.73 6 1 0.65 0.58 May-11 Date 1 4 Oct 11 Aug-11 Nov-11 Recommendation OUTPERFORM Feb-12 May-12 Price target 0.69 Aug-12 Date 3 25 Oct 12 2 18 Jan 12 OUTPERFORM 0.78 4 8 Jan 13 Source: FactSet prices, SCB recommendations and price targets Nov-12 Recommendation Feb-13 May-13 Price target Aug-13 Date Nov-13 Recommendation OUTPERFORM 0.81 5 10 Jun 13 IN-LINE 0.81 6 19 Nov 13 OUTPERFORM IN-LINE Feb-14 May-14 Price target 0.75 0.75 Recommendation Distribution and Investment Banking Relationships % of covered companies currently assigned this rating % of companies assigned this rating with which SCB has provided investment banking services over the past 12 months OUTPERFORM 54.4% 12.7% IN-LINE 35.4% 11.5% UNDERPERFORM As of 31 March 2014 10.2% 7.7% Research Recommendation Terminology OUTPERFORM (OP) IN-LINE (IL) UNDERPERFORM (UP) Definitions The total return on the security is expected to outperform the relevant market index by 5% or more over the next 12 months The total return on the security is not expected to outperform or underperform the relevant market index by 5% or more over the next 12 months The total return on the security is expected to underperform the relevant market index by 5% or more over the next 12 months SCB uses an investment horizon of 12 months for its price targets. Additional information, including disclosures, with respect to any securities referred to herein will be available upon request. Requests should be sent to [email protected]. Global Disclaimer: Standard Chartered Bank and/or its affiliates ("SCB”) makes no representation or warranty of any kind, express, implied or statutory regarding this document or any information contained or referred to in the document. The information in this document is provided for information purposes only. It does not constitute any offer, recommendation or solicitation to any person to enter into any transaction or adopt any hedging, trading or investment strategy, nor does it 16 April 2014 10 Equity Research l COSCO Pacific constitute any prediction of likely future movements in rates or prices or represent that any such future movements will not exceed those shown in any illustration. The stated price of the securities mentioned herein, if any, is as of the date indicated and is not any representation that any transaction can be effected at this price. While all reasonable care has been taken in preparing this document, no responsibility or liability is accepted for errors of fact or for any opinion expressed herein. The contents of this document may not be suitable for all investors as it has not been prepared with regard to the specific investment objectives or financial situation of any particular person. Any investments discussed may not be suitable for all investors. Users of this document should seek professional advice regarding the appropriateness of investing in any securities, financial instruments or investment strategies referred to in this document and should understand that statements regarding future prospects may not be realised. Opinions, forecasts, assumptions, estimates, derived valuations, projections, and price target(s), if any, contained in this document are as of the date indicated and are subject to change at any time without prior notice. Our recommendations are under constant review. The value and income of any of the securities or financial instruments mentioned in this document can fall as well as rise and an investor may get back less than invested. Future returns are not guaranteed, and a loss of original capital may be incurred. Foreign-currency denominated securities and financial instruments are subject to fluctuation in exchange rates that could have a positive or adverse effect on the value, price or income of such securities and financial instruments. Past performance is not indicative of comparable future results and no representation or warranty is made regarding future performance. While we endeavour to update on a reasonable basis the information and opinions contained herein, there may be regulatory, compliance or other reasons that prevent us from doing so. Accordingly, information may be available to us which is not reflected in this material, and we may have acted upon or used the information prior to or immediately following its publication. SCB is not a legal or tax adviser, and is not purporting to provide legal or tax advice. Independent legal and/or tax advice should be sought for any queries relating to the legal or tax implications of any investment. SCB, and/or a connected company, may have a position in any of the securities, instruments or currencies mentioned in this document. SCB and/or any member of the SCB group of companies or its respective officers, directors, employee benefit programmes or employees, including persons involved in the preparation or issuance of this document may at any time, to the extent permitted by applicable law and/or regulation, be long or short any securities or financial instruments referred to in this document and on the website or have a material interest in any such securities or related investment, or may be the only market maker in relation to such investments, or provide, or have provided advice, investment banking or other services, to issuers of such investments. SCB has in place policies and procedures and physical information walls between its Research Department and differing public and private business functions to help ensure confidential information, including ‘inside’ information is not disclosed unless in line with its policies and procedures and the rules of its regulators. Data, opinions and other information appearing herein may have been obtained from public sources. SCB makes no representation or warranty as to the accuracy or completeness of such information obtained from public sources. You are advised to make your own independent judgment (with the advice of your professional advisers as necessary) with respect to any matter contained herein and not rel y on this document as the basis for making any trading, hedging or investment decision. SCB accepts no liability and will not be liable for any loss or damage arising directly or indirectly (including special, incidental, consequential, punitive or exemplary damages) from use of this document, howsoever arising, and including any loss, damage or expense arising from, but not limited to, any defect, error, imperfection, fault, mistake or inaccuracy with this document, its contents or associated services, or due to any unavailability of the document or any part thereof or any contents or associated services. This material is for the use of intended recipients only and in any jurisdiction in which distribution to private/retail customers would require registration or licensing of the distributor which the distributor does not currently have, this document is intended solely for distribution to professional and institutional investors. Country-Specific Disclosures - If you are receiving this document in any of the countries listed below, please note the following: United Kingdom and European Economic Area: SCB is authorised in the United Kingdom by the Prudential Regulation Authority and regulated by the Financial Conduct Authority and the Prudential Regulation Authority. This communication is not directed at Retail Clients in the European Economic Area as defined by Directive 2004/39/EC. Nothing in this document constitutes a personal recommendation or investment advice as defined by Directive 2004/39/EC. Australia: The Australian Financial Services Licence for Standard Chartered Bank is Licence No: 246833 with the following Australian Registered Business Number (ARBN: 097571778). Australian investors should note that this document was prepared for “wholesale clients” only within the meaning of section 761G of the Australian Corporations Act 2001 (Act) and the Corporations Regulations. This document is not directed at persons who are “retail clients” as defined in the Australian Corporations Act 2001. Brazil: SCB disclosures pursuant to the Securities and Exchange Commission of Brazil (“CVM”) Instruction 483/10: This research has not been produced in Brazil. The report has been prepared by the research analyst(s) in an autonomous and independent way, including in relation to SCB. THE SECURITIES MENTIONED IN THIS DOCUMENT HAVE NOT BEEN AND WILL NOT BE REGISTERED PURSUANT TO THE REQUIREMENTS OF THE SECURITIES AND EXCHANGE COMMISSION OF BRAZIL AND MAY NOT BE OFFERED OR SOLD IN BRAZIL EXCEPT PURSUANT TO AN APPLICABLE EXEMPTION FROM THE REGISTRATION REQUIREMENTS AND IN COMPLIANCE WITH THE SECURITIES LAWS OF BRAZIL. Germany: In Germany, this document is being distributed by Standard Chartered Bank Germany Branch which is also regulated by the Bundesanstalt für Finanzdienstleistungsaufsicht (BaFin). Hong Kong: This document, except for any portion advising on or facilitating any decision on futures contracts trading, is being distributed in Hong Kong by, and is attributable to, Standard Chartered Bank (Hong Kong) Limited which is regulated by the Hong Kong Monetary Authority. India: This document is being distributed in India by Standard Chartered Securities (India) Limited which is a SEBI registered broker and a member of the Bombay Stock Exchange Limited and The National Stock Exchange of India Limited. Korea: This document is being distributed in Korea by, and is attributable to, Standard Chartered Securities Korea Limited which is regulated by the Financial Supervisory Service. Malaysia: This document is being distributed in Malaysia by Standard Chartered Bank Malaysia Berhad only to institutional investors or corporate customers. Recipients in Malaysia should contact Standard Chartered Bank Malaysia Berhad in relation to any matters arising from, or in connection with, this document. Singapore: This document is being distributed in Singapore by Standard Chartered Bank Singapore Branch only to accredited investors, expert investors or institutional investors, as defined in the Securities and Futures Act, Chapter 289 of Singapore. Recipients in Singapore should contact Standard Chartered Bank Singapore Branch in relation to any matters arising from, or in connection with, this document. South Africa: SCB is licensed as a Financial Services Provider in terms of Section 8 of the Financial Advisory and Intermediary Services Act 37 of 2002. SCB is a Registered Credit Provider in terms of the National Credit Act 34 of 2005 under registration number NCRCP4. United States: Except for any documents relating to foreign exchange, FX or global FX, Rates or Commodities, distribution of this document in the United States or to US persons is intended to be solely to major institutional investors as defined in Rule 15a-6(a)(2) under the US Securities Act of 1934. All US persons that receive this document by their acceptance thereof represent and agree that they are a major institutional investor and understand the risks involved in executing transactions in securities. Any US recipient of this document wanting additional information or to effect any transaction in any security or financial instrument mentioned herein, must do so by contacting a registered representative of Standard Chartered Securities (North America) Inc., 1095 Avenue of the Americas, New York, N.Y. 10036, US, tel + 1 212 667 0700. WE DO NOT OFFER OR SELL SECURITIES TO U.S. PERSONS UNLESS EITHER (A) THOSE SECURITIES ARE REGISTERED FOR SALE W ITH THE U.S. SECURITIES AND EXCHANGE COMMISSION AND WITH ALL APPROPRIATE U.S. STATE AUTHORITIES; OR (B) THE SECURITIES OR THE SPECIFIC TRANSACTION QUALIFY FOR AN EXEMPTION UNDER THE U.S. FEDERAL AND STATE SECURITIES LAWS NOR DO WE OFFER OR SELL SECURITIES TO U.S. PERSONS UNLESS (i) WE, OUR AFFILIATED COMPANY AND THE APPROPRIATE PERSONNEL ARE PROPERLY REGISTERED OR LICENSED TO CONDUCT BUSINESS; OR (ii) WE, OUR AFFILIATED COMPANY AND THE APPROPRIATE PERSONNEL QUALIFY FOR EXEMPTIONS UNDER APPLICABLE U.S. FEDER AL AND STATE LAWS. © Copyright 2014 Standard Chartered Bank and its affiliates. All rights reserved. All copyrights subsisting and arising out of all materials , text, articles and information contained herein is the property of Standard Chartered Bank and/or its affiliates, and may not be reproduced, redistributed, amended, modified, adapted, transmitted in any form, or translated in any way without the prior written permission of Standard Chartered Bank. 16 April 2014 11 Equity Research l COSCO Pacific 16 April 2014 12
© Copyright 2026 ExpyDoc