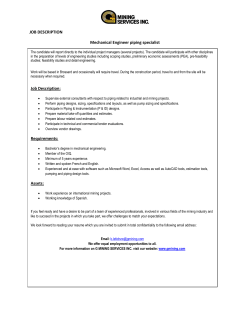
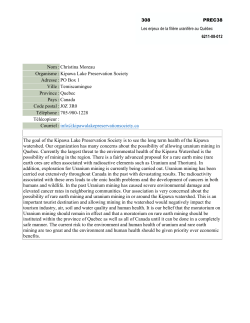
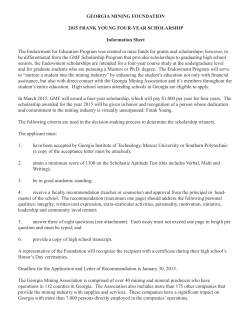
Merrill Lynch Conference
Sun City 24 – 26 March 2014
Group revenue
Revenue Sept 2013
Revenue Sept 2012
4%
8%
7%
7%
7%
53%
29%
2
50%
7%
28%
Automotive and Logistics
Equipment Southern Africa
Equipment Russia
Handling
Equipment Europe
Group operating profit
Operating Profit Sept 2013
Operating Profit Sept 2012
60%
60%
51%
48%
50%
50%
42%
40%
40%
30%
30%
20%
20%
39%
12%
12%
10%
10%
2%
1%
0%
0%
0%
-10%
3
2%
-2%
-10%
-5%
Automotive and Logistics
Equipment Southern Africa
Equipment Europe
Equipment Russia
Handling
Corporate
Equipment Division
Caterpillar enhancing distribution model
Objectives
1 Strengthening the Caterpillar-Dealer model
2 Enhancing customer focus
3 Achieving superior economics for Caterpillar
and the dealer
4 Seizing opportunities / mitigating risks
5
Business overview
Equipment southern Africa
Market outlook by segment (Rm)
46%
34%
54%
31%
2003 2004 2005 2006 2007 2008 2009 2010 2011 2012 2013 2014 2015 2016 2017 2018
Building Construction
7
Heavy Construction
Contract Mining
Mining Houses
Major surface mining opportunities 2013 - 2018
Coal
Copper/Nickel
Jindal (2015)
Iron ore
Uranium
FQM – Kalumbila (2014)
Gold
Vedanta – KCM (2013-14)
Vale/Rio Tinto –Tete (2013-)
Exxaro Medupi Exp (2013-)
Nippon Steel- Revuboè (2015)
B2 Gold (2013-)
ResGen – Boikarabelo (2015)
Extract Resources – Husab
CoAL – Makhado (2016)
Kumba – Sishen (2013-)
8
Exxaro – Belfast Project (2015)
Zonnebloem Xstrata (2016)
Xstrata – Tweefontein (2013-)
Anglo – New Largo (2017)
Major infrastructure opportunities 2013 - 2018
Awarded and in progress
Potential
Refinery
Dams, Rail, Ports, Roads
Mine Infrastructure
Infrastructure Backlogs
North South Water Pipeline
Power, Ports, Roads
and Railways
Various Road Rehab
Neckartal Dam
Mine Infrastructure
Rail and Dams
Mine Infrastructure and
Provincial and Municipal
Infrastructure
9
To commence short term
17 Strategic Integrated
Projects (SIPs) developed
and approved in South Africa
We have the broadest mining truck line in the industry
Helping customers choose the trucks that match precisely to their unique hauling needs
797F
793F
795F AC
793F AC
MT6300 AC
MT5500 AC
793D
789D
785D
785C
MT5300D AC*
MT4400D AC*
MT3700 AC
MT3300 AC
CAT
MECHANICAL DRIVE
MINING TRUCKS
CAT
ELECTRIC DRIVE
MINING TRUCKS
UNIT RIG
ELECTRIC DRIVE
MINING TRUCKS
10
* Fully Caterpillarised former Unit Rig LMT
Kumba | Electric Drive truck trial update
● Six Cat 795 AC trucks placed
at Sishen (R250m)
● Performance is measured on
• Fleet availability
• Mean Time Between Failure
• Life Cycle Costing
● Fleet performance is above
contractual KPI targets to date
● Exceptional parts and component
availability
11
Zambia | FQM Kalumbila
● Order of R1.1bn placed in 2011 for
three Cat 7495 rope shovels and
seven Cat MD 6640 drills
● 2 Rope shovels and 2 drills currently
being assembled on site
● 39 local employees on site for the
assembly of the machines
First Cat electric rope shovel to be delivered in Zambia
12
Namibia | Swakop Uranium – Husab Project
● First machine, Cat 6060FS hydraulic
shovel arrived in Walvis bay in
September 2013; machine has been
assembled, tested and handed over
● Assembly of second rope shovel
and other machines in progress
● The whole fleet is expected to be
commissioned by November 2014
● Barloworld Operational team being
put in place
Components of the Cat 6060 in transit
Total contract value
R1.3bn
Assembled shovel and Barloworld Equipment team on site
13
Southern Africa revenue profile 2013
Revenue
by line of business
4%
New equipment
sales by industry
3%
11%
10%
42%
41%
11%
52%
26%
New equipment sales
Used equipment sales
14
Product support
Rental
Mining
Construction
EMPR
Power
Contract Mining
Southern Africa sales history
R‘000
25 000 000
20 000 000
41%
33%
15 000 000
36%
28%
10 000 000
34%
30%
5 000 000
46%
37%
0
2006
2007
2008
Equipment sales
15
2009
2010
2011
2012
Product support
2013
Equipment southern Africa – outlook
● January 2014 firm back orders at R3.6bn (Sept 2013: R3.55bn)
● EMPR large mining machine deliveries and site solutions expected to offset
slowdown in CAT legacy mining sales
● Strong after sales activity to continue
● Continued growth in construction with solid prospects for the medium term
● Positive outlook for Rental operation based on current market conditions
Firm Order Book (Rm)
Southern
Africa
0
Jan 2014
16
2 000
4 000
Sep 2013
Business overview
Equipment Russia
Commodities overview – Russia
Oil
Copper
Industry value
US$448bn
Gold
Industry value
US$7bn
Aluminium
Industry value
US$13.1bn
Silver
Industry value
US$33.3bn
Platinum
Industry value
US$8.8bn
Nickel
Industry value
US$1.4bn
18
Coal
Industry value
US$1.7bn
Diamond
Industry value
US$4.9bn
Industry value
US$4.4bn
Russia revenue profile 2013
Revenue
by line of business
2%
New equipment sales by industry
2%
3%
3%
7%
33%
16%
71%
63%
19
New equipment sales
Product support
Mining
Construction
Used equipment sales
Rental
Oil and gas
Other
Power systems
Russia sales history
US$ ‘000
600 000
500 000
33%
27%
400 000
28%
300 000
25%
200 000
36%
24%
100 000
29%
25%
0
2006
2007
2008
Equipment sales
20
2009
2010
2011
2012
Product support sales
2013
Green field projects – surface
Units
US$
21
2015
147
282m
2016
136
313m
2017
101
398m
Underground greenfield mining projects
SDS Ugol
Region 1
Western and
Eastern Siberia
Yuzhnaya Mine – Lutuginskiy
mine site:
Coal reserves – 40 m tonnes
Region 2
Yakutia and
Russia Far East
Anadyr
UGMK
Depressed
coal market
delaying
investment
Baykaimskaya mine
(underground)
Coal reserves – 68,7 m tonnes
Magadan
EVRAZ Holding
Raspadskaya mine
Coal reserves – 451 m tonnes
Raspadskaya Koksovaya mine
Coal reserves – 101 m tonnes
SUEK JSC
A.D. Rubana mine
Coal reserves – 40 m tonnes
Mirniy
Yakutsk
MC Kolmar
Nerungryugol JSC
Omsk
Tomsk
Novosibirsk
Achinsk
Krasnoyarsk
Kemerovo
Barnaul
Nerungry
Inaglinskaya Mine
Coal reserves – 76,8 m tonnes
Denisovskaya Mine
Coal reserves – 64,5 m tonnes
Abakan
Chita
MC Sibirskaya
(Sibuglemet)
Uvalnaya mine
Coal reserves – 342 m tonnes
22
PetropavlovskKamchatskiy
EVRAZ Holding
Mezhegey Ugol
Coal reserves – 700 m tonnes
Construction/oil and gas – opportunity
Railways
Oil & Gas projects
Region 1
Western and
Eastern Siberia
Kuyumba – Tayshet
oil trunk pipeline
Region 2
Yakutia and
Russia Far East
• implem. period – 2013-2016
• Length – 704 km
• Cost – $3 bn
Power of Siberia
gas pipeline
Anadyr
• implem. period – 20122016
• Length – over 2700 km
• Cost – over $13,6 bn
Magadan
Severo-Sibirskaya
railroad
• 2 000km (Nizhnevartovsk to
Ust-Ilimsk (BAM))
• Stage: start 2016 – US$4bn
Mirniy
Yakutsk
PetropavlovskKamchatskiy
Ust-Kut GPP
Omsk
Tomsk
Novosibirsk
Achinsk
Krasnoyarsk
Kemerovo
Barnaul
Kyzyl-Kuragino
railroad
• 411,7 km
• 2013 - Contractor chosen –
Mostovik
• US$5,57bn
23
Nerungry
• 2,3 bn m3 of natural gas to be
processed (INK)
• Commissioning – 2014
Abakan
Chita
BAM railway
• mega project (second spur of
Baikal-Amur Mainline)
• Stage: start in 2014
• $15 bn
Equipment Russia – outlook
● Mining order book showing downward trend
● Gold under pressure with coal market still weak
● Continued branch infrastructure development throughout the territory remains key
to growing long term market share
Order book (US$m)
Order book excludes EMPR orders retained
by CAT to the value of US$28.7m – VT will
receive margin via service fee
Russia
0
Jan 2014
24
20
40
Sep 2013
60
Business overview
Equipment Iberia
GDP Forecasts
3.4%
Spain starting to recover
1.5%
1.0%
0.8%
0.9%
0.5%
-0.2%
-0.1%
-1.2%
-1.6%
-3.8%
2007
Actual
26
2008
2009
2010
2011
Previous forecast - Oct 2013
Source: IMF and Ministry of Economy Spain
2012
2013
2014
2015
Current forecast - Feb 2014
Machine Industry trend and outlook (Iberia)
25 000
20 000
Units
15 000
10 000
5 000
0
2000 2001 2002 2003 2004 2005 2006 2007 2008 2009 2010 2011 2012 2013 2014 2015 2016 2017 2018
27
Headcount
• Headcount across the Iberian region has
been reduced by 965 employees or 40.4%
3 000
2 500
2 388
2 363
2 146
2 000
1 954
1792
1 665
1 482
1 500
1 428
1 423
1 407
1150
1134
264
264
0
0
Jan 2014
Sept 2014
1 000
500
0
346
250
Sept 2007
Sept 2008
BW Iberia staff
28
SITECH + MYTRACTOR: 9 employees
Sept 2009
Sept 2010
BW FSA
Sept 2011
Sept 2012
BW MERA
Sept 2013
BW STET
Iberia revenue profile 2013
Revenue
by line of business
New equipment
sales by industry
2%
25%
35%
38%
46%
35%
14%
5%
29
New machine sales
Product support
Mining
Construction
Used machine sales
Rental
Other
Power
* Construction includes contract mining
Iberia sales history
€ ‘000
900 000
800 000
30%
700 000
600 000
30%
32%
500 000
34%
400 000
40%
37%
2010
2011
300 000
33%
35%
2012
2013
200 000
100 000
0
2006
2007
2008
Equipment sales
30
2009
Product support
Equipment Iberia – outlook
● Iberian economy appears to have bottomed
● Order books continue at low levels but slightly better than 2013
● Focus on maintaining market share, margins and cost control
● New Mining projects appear on the horizon
● Power systems sector remains solid
● Improved operating performance due to lower cost base
Order book (€m)
Iberia
0
20
Jan 2014
31
40
Sep 2013
60
Business overview
Global Power Systems
Power Systems opportunities
Oil & Gas
● Good progress in penetration of international key accounts
● After sales growth in Angola and Russia
● Working with Concession holders and service providers on largescale projects i.e. Mozambique LNG and Karoo unconventional
gas
Electric Power
● Electricity shortfall and large-scale infrastructure development
are driving the market
● Growing gas opportunities; cogeneration, landfill, greenhouses,
etc
● Project participation and orders growing
Marine
● Main prime and after sales opportunities with offshore vessels,
ferries, cargo, governmental (military) and fishing (tuna)
● Emphasis going forward on gas propulsion, systems integration
and coverage of international key accounts following CAT´s
acquisition of Berg
33
Automotive and Logistics
Strategic positioning
Automotive and Logistics Division
Customers
Barloworld Automotive
(Automotive Business model)
Car
Rental
Motor
Digital
Motor
Fleet
Retail
Disposal
Retail
Services
Southern
Solutions
Australia
Africa
Freight
Mangmt
and
Services
Supply
Chain
Mangmt
Supply
Chain
Mangmt
Transpor
t
Solutions
Communication, HR, IT, Legal, Finance, Sustainable Development, Strategy,
Empowerment and Transformation, Risk Management, Business Development and
Sales, Governance, Ethics and Compliance
• Inter-business unit synergies and cost efficiencies
• Apply Collective Wisdom
35
Barloworld Logistics
• Leveraging Automotive infrastructure to achieve
critical mass for growth
• Retain strategic focus on each business unit
Sense of scale
General Information
Employees
10 765
Countries
16
Automotive Principals
Avis, Audi, BMW, Ford, General
Motors, Mazda, Mercedes-Benz,
Toyota, Volkswagen
Car Rental locations
>190
Wholly owned Motor Retail dealerships (SnA & Oz)
FY Sep ‘12
FY Sep ‘13
Rental Days
5.71m
6.06m
New & Used retail units sold
88 467
97 484
Total vehicles under management
227 019
277 164
76
83
Key Indicators
New vehicles sold per dealership per month incl. Oz
36
40
DTS km’s travelled FY’13
75.0m
SAT tons shipped FY’13
16 333t
Operational review
● Strong overall result in a demanding trading environment
● Revenue: R34.4bn (FY’12: R29.5bn) – up 17%
● Record operating profit R1 479m (FY’12: R1 152m) – up 28%
● Operating margin for the year 4.3% (FY’12: 3.9%)
● All business segments performed well
Operating profit (Rm)
Margin
+26%
Car Rental
+20%
Motor Retail
+39%
Fleet Services
+38%
Logistics
0
37
150
2013
300
450
2012
600
7.7%
7.1%
2.5%
2.4%
16.7%
15.2%
2.3%
2.1%
Integrated automotive and logistics business model delivers
● Revenue CAGR = 14%
● Operating profit CAGR = 27%
Revenue and Margin
Rbn
Margin
40
● Operating margins improved from
3.4% to 4.3%
5.0%
30
4.0%
20
● Balanced mix of businesses
delivers value through synergies
10
3.0%
0
2.0%
2011
2012
Revenue
2013
Margin
Operating profit
Rm
1 600
1 400
1 200
1 000
800
600
400
200
0
2011
38
2012
2013
Division overview
● Enhance return on equity
● Continued cash focus
● Targeted capital allocation
● Growing market share
● Optimising vehicle fleets (utilisation)
● Managing working capital levels
● Improving asset turn
● Expense management
● Controlling interest costs
● Implementing Logistics growth
strategy
● Targeted growth opportunities
across all units
● Exceeding customer expectations
● Australia negotiations
39
Car Rental
● Improved rental days despite competitive market
● Static revenue per day
● Continued focus on operating costs
● Fleet utilisation remains well controlled
● Continued solid used vehicle profit contribution
● Sustained customer satisfaction above 90%
Leading indicators
% Growth
15
10
5
0
-5
Rental days
Rate per day
Jan '14 YTD
40
Fleet utilisation
Sept '13 YTD
Fleet size
Motor Retail
Total South African Vehicle Market
900
800
700
600
500
400
300
200
100
0
2007
2008
2009
2010
Passenger
41
Source: RGT
2011
2012
2013
LCV
2014
2015
2016
M&HCV
2017
2018
Motor Retail
● Southern Africa
• Fewer, Bigger, Better” Strategy continues
• 71 new vehicles sold per dealership per month
(Sep’13: 75)
• Appropriate dealership footprint
• Focused brand strategy aligned to overall Automotive
business model presents some targeted growth
• Improved operating margin through cost containment
and margin expansion
• Continued strong finance and insurance contribution
Leading indicators
% Growth
25
15
5
-5
New units
Service hours
Jan '14 YTD
42
Parts revenue
F & I Net profit
Sept '13 YTD
Fleet Services
● Pleasing performance in low interest rate
environment
● Finance fleet growth slows post large contract
roll-outs
● Strong growth in fleets under maintenance
● Continued strong used vehicle profits
● COJ settled and performing well
● Awaiting adjudication on further tenders
● Investigating further African growth opportunities
Leading indicators
% Growth
25
15
5
-5
Maintenance fleet
Jan '14 YTD
43
Finance fleet
Total fleet
Sept '13 YTD
Logistics
Good turnaround and positioned for growth
● Manline contributing strongly to the newly
formed Barloworld Transport Solutions
from 1 Feb 2013
● Niche acquisition effective 5 Jun 2013,
rebranded Manline Mega, is well
positioned in the abnormal load transport
market with further growth potential
● Successfully renewed all expiring
contracts in Supply Chain Management
and Dedicated Transport
● Awarded Pioneer Bakery fleet 4PL
contract
● International operations continue to face
difficult trading conditions
• Restructured Spanish operations
• Exited Far East business effective 1 Nov
2013
44
Merrill Lynch Conference
© Copyright 2026 ExpyDoc