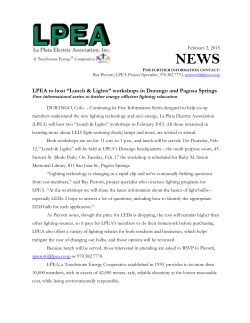
The Contribution of the Hop Production Sector to Washington’s Economy IMPACT Center Fact Sheet, June 2014 Suzette P. Galinato, Peter R. Tozer, and Thomas L. Marsh Hop Production • $157 million value of production • 2,555 total employment • $131 million in wages • $175 million value added • $312 million total economic impact Washington State is a major producer of many high‐value crops, including apples, cherries, pears, and hops, among others. Washington State is the leading hop‐ producing state in the U.S., with 79% of U.S. hop production (USDA NASS, 2014). The objective of this publication is to provide an overview of the contribution of the hop production sector to the economy of Washington State. Hop production Hops are one of the key ingredients in beer. There are a number of hop varieties and each variety has its own alpha acid (AA) rating, which is represented by the amount of alpha acid as percentage of the total weight of the hops. The two main classifications of hops are: aroma varieties and bittering varieties. Aroma hops have an oil profile associated with desirable aroma and lower alpha acid rating such as Willamette (4%‐5% AA) and Cascade (4.5%‐7% AA). Bittering hops have higher alpha acid percentage such as Chelan (12%‐14.5% AA), Chinook (12%‐14% AA), Millennium (14.5%‐16.5% AA), and Apollo (15%‐19% AA) (Palmer, 1999; USA Hops, 2013). The top three major producers of hops in the world are China, Germany, and the United States (Figure 1). Germany produced 37% of the world’s total hop supply, on average, between 2011 and 2013, followed by the U.S. (33%) and China (12%) during the same period (HGA, 2013). 3% 12% China 6% 2% 33% 8% Czech Republic England Europe (rest) Germany United States 37% Rest of the World Figure 1. Production of hops by country as percentage of total world hop production, 3year average, 20112013. Source: HGA (2013). U.S. hop acreage declined by 24% between 1998 and 2004 (Figure 2) as a consequence of a worldwide oversupply, and increased 4 35,000 3.5 30,000 3 25,000 2.5 20,000 2 15,000 1.5 10,000 1 5,000 Figure 2. U.S. hops harvested acres and price received, 19982013. Source: USDA NASS (2014). 30,000 25,000 tons 20,000 15,000 10,000 5,000 0 Oregon Washington Figure 3. Hop production by state, 5year average, 20092013. Sources: HGA (2013) and USDA NASS (2014). 1,000 Yield per acre The U.S. commercial hop production is concentrated in the Pacific Northwest region (Idaho, Oregon and Washington). Figure 3 shows hop production by state, where the majority comes from Washington. From 1999 to 2013, the region had a 5‐year average of 33,592 acres that yielded 35,555 tons of hops (HGA, 2013; USDA NASS, 2014). Idaho 1,500 Value of production per acre Figure 4. Yield and value of production per acre of hops in Washington, 19982013. 1998 1999 2000 2001 2002 2003 2004 2005 2006 2007 2008 2009 2010 2011 2012 2013 Price received 2,000 0 0 Acres harvested 2,500 500 0.5 0 10,000 9,000 8,000 7,000 6,000 5,000 4,000 3,000 2,000 1,000 0 $/acre 40,000 3,000 1998 1999 2000 2001 2002 2003 2004 2005 2006 2007 2008 2009 2010 2011 2012 2013 4.5 The total value of hop production in Washington was about $157 million in 2011 and $202 million in 2013 (USDA NASS, 2014). Hops consistently ranked in the top 15 agricultural commodities in Washington, and in 2012, the crop ranked 14th in terms of agricultural commodity value (USDA NASS, 2013a). Between 1998 and 2010, the general trends in the per‐acre yields and value of production of hops have been increasing (Figure 4). Yield/acre 45,000 Price ($/lb) Acres between 2004 and 2008 by 47% due to a worldwide deficit in hops and increased prices (Associated Press, 2008; Global Malt, 2011). However, the high prices were temporary as there was again an oversupply of hops between 2008 and 2009 leading to lower prices (Gabrielyan and Marsh, 2012). The harvested acres and price received for hops decreased by 14% and 11%, respectively, between 2008 and 2013 (USDA NASS, 2014). These historical data show the challenge faced by the hop industry in seeking equilibrium between supply and demand. Sources: HGA (2013) and USDA NASS (2014). Zeus, Columbus, and Cascade are the top three varieties grown in Washington, accounting for 38% of the state’s crop on average between 2011 and 2013 (USDA NASS, 2013b). Hop production is concentrated in the central region of the state, particularly in Benton and Yakima counties. As of the 2012 Agricultural Census, there were a total of 40 farms growing hops, of which 32 farms are located in Yakima County and 5 farms in Benton County (USDA NASS, 2014). Economic contribution The 2011 data for crop price, crop yield and harvest area were obtained from USDA NASS (2014) and used in the estimation. These data were $3.06 per lb, 2,200 lb per acre, and 23,320 acres, respectively. Employment data and production costs were obtained from enterprise budgets developed by Hinman (1999) and Galinato et al. (2011), respectively. Because the production cost estimates represent 2010 prices, we used a price deflator to adjust the cost data in order to be consistent with the IMPLAN data. The price deflator was calculated based on the prices paid indexes for agricultural production items in 2010 and 2011. The updated enterprise budget was translated into an input‐output accounting structure using the methodology by Willis and Holland (1997). IMPLAN software and the 2011 IMPLAN model for Washington (latest available database for the state) were used to estimate the economic contributions of the hop production sector. The hop production sector’s economic contribution is measured by the following impacts: $312 million in output or revenue; 2,555 full‐time jobs; $131 million in labor income; and $175 million in total value added (Table 1). The table also shows the different types of impact. Direct effects are the immediate effects related to hop production, while indirect effects are associated with inter‐industry transactions such as transactions with gas distributors, wholesale and retail businesses, fertilizer and agricultural chemical manufacturers, insurance, accounting and banking services, and custom work or field contractors. Induced effects represent household consumption expenditures of employees in the directly and indirectly affected industry sectors. Examples of induced effects include expenditures on food services, real estate, healthcare services, wholesale and retail merchandise, and utilities. Total effect is the sum of the direct, indirect and induced effects. The direct effects represent the largest portion of the economic impact in all categories: 44% of employment, 52% of labor income, 45% of value‐added, and 50% of output. References Associated Press. 2008. Yakima Valley Growers Pull Crops for Hops. OREGONLIVE‐The Oregonian. http://blog.oregonlive.com/breakingnews/200 8/04/yakima_valley_growers_pull_cro.html Gabrielyan, G. and T.L. Marsh. 2012. Domestic and Export Price Formation of U.S. Hops. Selected Paper for the Agricultural & Applied Economics Association’s Annual Meeting, Seattle, Washington. Galinato, S.P., A. George, and H. Hinman. 2011. 2010 Estimated Cost of Producing Hops in the Yakima Valley, Washington State. Washington State University Extension Publication FS028E. Global Malt. 2011. World: Hop Market Remains in Need of Recovery. http://www.globalmalt.de/english‐world‐hop‐ market‐remains‐in‐need‐of‐recovery/?lang=en HGA (Hop Growers of America). 2013 Statistical Report. http://hops.msu.edu/uploads/files/2013_Stat_ Pack.pdf Table 1. Economic contributions of the hop production sector by type of impacts. Impact Type Employment1 Labor Income2 Total Value Added3 Output4 (hundred) ($ million) ($ million) ($ million) Direct Effect 11 $68 $79 $157 Indirect Effect 8 $35 $45 $70 6 $28 $51 $85 Induced Effect 26 $131 $175 $312 Total Effect Definition (Source: MIG, 2013): 1Employment = number of jobs. 2Labor income = employee compensation + proprietor income. 3Value added = employee compensation + proprietor income + other property income + indirect business taxes. 4Output = intermediate expenditures + value added. Hinman, H. 1999. Estimated Cost of Producing Hops under Drip Irrigation in the Yakima Valley, Washington State. Farm Business Management Report EB1134. Washington State University, Pullman, WA. MIG (Minnesota IMPLAN Group, Inc.). 2013. IMPLAN System (data and software). MIG Inc., Hudson, WI. http://www.implan.com Palmer, J. 1999. How to Brew – Chapter 5: Hops. http://www.howtobrew.com/section1/chapter 5‐1.html USA Hops. 2013. Variety Manual. http://www.usahops.org/userfiles/image/138 3233116_2013%20Hops%20Variety%20Manu al.pdf USDA NASS (U.S. Department of Agriculture National Agricultural Statistics Service). 2013a. 2013 Washington Annual Agriculture Bulletin. http://www.nass.usda.gov/Statistics_by_State/ Washington/Publications/Annual_Statistical_Bu lletin/annual2013.pdf USDA NASS. 2013b. National Hop Report. http://www.nass.usda.gov/Statistics_by_State/ Washington/Publications/Hops/HP12_1.pdf USDA NASS. 2014. Quick Stats. http://www.nass.usda.gov/Quick_Stats/ Willis, D. and D. Holland. 1997. Translating Farm Enterprise Budgets into Input‐Output Accounts: Another Example from Washington State. Department of Agricultural Economics, Washington State University, Pullman, WA. Acknowledgment This study was funded by the USDA‐NIFA Specialty Crop Research Initiative Competitive Grant 2009‐ 51181‐05790 “Agronomic and Biochemical Impacts of Biotic and Abiotic Stress on Pacific Northwest Flavor Crops,” Project Director Dr. Doug Walsh, WSU Irrigated Agriculture Research and Extension Center, Prosser, and the IMPACT Center in the School of Economic Sciences, WSU, Pullman. Comments from Dr. Philip Watson and Dr. Garth Taylor (Department of Agricultural Economics and Rural Sociology, University of Idaho), and Ms. Sally O’Neal (Irrigated Agriculture Research & Extension Center, WSU, Prosser, WA) are sincerely appreciated. Publisher IMPACT Center, School of Economic Sciences, PO Box 646210, Pullman, WA 99164‐6210 You may download copies of this and other publications from the IMPACT Center’s website: http://impact.wsu.edu.
© Copyright 2026 ExpyDoc