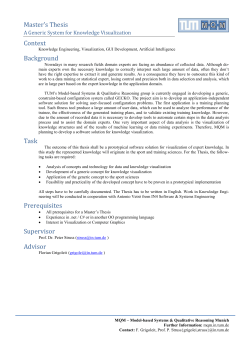
Monadic Exploration: Seeing the Whole Through Its Parts
Marian D¨ork
Potsdam University of
Applied Sciences, Germany
[email protected]
Rob Comber
Culture Lab, School of
Computing Science,
Newcastle University, UK
[email protected]
ABSTRACT
Monadic exploration is a new approach to interacting with
relational information spaces that challenges the distinction
between the whole and its parts. Building on the work of
sociologists Gabriel Tarde and Bruno Latour we turn to the
concept of the monad as a useful lens on online communities
and collections that expands the possibility for creating
meaning in their navigation. While existing interfaces tend
to emphasize either the structure of the whole or details of a
part, monadic exploration brings these opposing perspectives
closer together in continuous movements between partially
overlapping points of view. We present a visualization that
reflects a given node’s relative position within a network
using radial displacements and visual folding. To investigate
the potential of monadic exploration we report on an iterative
design process of a web-based visualization of a highly crossreferenced book and its six-month deployment.
Author Keywords
Information seeking; exploratory search; philosophy; theory;
information visualization; network visualization.
ACM Classification Keywords
H.5 Information Interfaces & Presentation
INTRODUCTION
“A monad is not a part of a whole, but a point of view
on all the entities taken severally and not as a totality.”
– Bruno Latour et al. [14]
There is increasing prevalence of large, relational data sets
in the everyday practices of individuals. Most prominently,
people are interacting with large-scale social data in the form
of social network sites, and vast media collections such as
photo archives, library catalogs, and blogs. With such data
sets people are often interested in the content of particular
elements as well as the entirety of elements as a whole. For
instance, one might want to look at both a specific friend’s
profile page, while also gaining some idea of who their
friends are. Or one might read an individual post and then
wish to see how it relates and resonates within a community.
Permission to make digital or hard copies of all or part of this work for personal or
classroom use is granted without fee provided that copies are not made or distributed
for profit or commercial advantage and that copies bear this notice and the full citation
on the first page. Copyrights for components of this work owned by others than
ACM must be honored. Abstracting with credit is permitted. To copy otherwise, or
republish, to post on servers or to redistribute to lists, requires prior specific permission
and/or a fee. Request permissions from [email protected].
CHI’14, April 26–May 1, 2014, Toronto, Canada.
c 2014 ACM ISBN/14/04...$15.00.
Copyright http://dx.doi.org/10.1145/2556288.2557083
Martyn Dade-Robertson
School of Architecture
Planning & Landscape,
Newcastle University, UK
[email protected]
As digitisation proceeds further we witness the popularisation
of interconnected data sets and the desire to afford new modes
of navigation to make sense of them. In this paper we explore
a type of interaction with relational information spaces, which
incorporates both the individual and the whole. We aim
to harness the rich connections embedded in collections to
devise new methods for moving along linked elements.
Some recent efforts in graph visualization defy the longstanding overview-first dogma in favor of filtered and local
perspectives [10, 20]. These developments correspond to
recent sociology theory promoting the part over the whole,
as a richer and more nuanced view on social networks [14].
Our work here follows these lines of research in visualization
and sociology and explores how information spaces can be
navigated along individual entities in the context of their
collection. We are inspired by the concept of the monad,
which offers a relational perspective on the world by shifting
emphasis from aggregation of the whole to movement among
particular points of view [14, 17]. In fact, Bruno Latour explicitly challenged the CHI community to develop interfaces
that support the visualization and navigation of monads [13].
This paper introduces monadic exploration as a new way
of navigating relational information spaces. We propose
three basic principles of the monadic perspective—having,
difference, and movement—to inspire a new class of visual
interfaces for exploring collections. The monadic perspective
brings the contradictory representations of individual elements and entire collections closer together and suggests continuous movements between partially overlapping vantage
points. Based on these ideas, we present a visualization that
uses search queries or element selections to provide unique
perspectives on the network through radial displacements and
visual folding. We applied this visualization technique to a
highly cross-referenced book and deployed it for a six-months
period on the Web. We report on the largely positive feedback
and discuss future directions for research and design.
VISUALIZING NETWORKS AND COLLECTIONS
Visualizations have played a significant role in the analysis
of social networks. Starting from manual drawings of
‘sociograms’, there has been a gradual movement towards
computer-supported methods for graph layouts [7]. The main
aim of such visualizations has been to analyse the structure
of networks, and secondarily to communicate derived understandings. Some efforts focused on graph visualization
for more casual audiences, for example, by encouraging the
playful exploration of one’s own friend networks [10].
A range of alternative visualizations have been developed that
provide different perspectives on networks and support various types of analyses. For example, node properties can be
aggregated into higher-level representations thus allowing for
a meta analysis of connection patterns [22]. Graphs can also
be summarized by histograms representing facet distributions
across neighborhoods and graph-theoretical qualities such as
node and edge specific metrics to characterize and compare
large networks [12]. A hybrid representation between nodelink diagrams and matrices has been shown to support the
analysis of local communities as well as global structure [11].
However, most network visualizations tend to provide a
global perspective on a graph by attempting to represent it in
its entirety or aggregating its nodes and edges based on their
properties. Such global approaches can make it difficult to
discern relations among particular nodes and neighborhoods.
In contrast to the emphasis on high-level views on networks,
there has been some work favoring more local perspectives.
Without requiring a global view, egocentric networks around
particular nodes can support the analysis of, for example,
group communication patterns and people’s social roles [6].
In the context of online communities, it has been shown that
‘starting with what you know’ can serve as a more useful
approach [10] than the established principle of ‘overview
first’ [16]. When dealing with particularly large networks,
search relevance can be used to initially establish a partial
context and then expand the visualization from there [20].
While emphasizing individual nodes and their neighbors,
local views lack the wider context of the network and thus
can make it difficult to connect the part back to the whole.
The tension between global and local views relates to a longstanding research effort on focus+context visualization [2].
For example, radial graph layouts arrange a focus node at the
center and connected nodes as context into concentric circles,
e.g. [26]. The visualization we will introduce also features a
circular layout, but integrates keyword search with the exploration of collection elements. Our work extends prior work on
focus+context techniques to exploratory information seeking
involving both search and navigation in rich collections.
Information visualizations are increasingly used to support
the visual exploration of rich collections. This development
coincides with a growing interest in more exploratory forms
of information seeking without specific information needs,
but rather a more open-ended desire to learn, play, and
discover [15, 25]. Such positive and exploratory information
practices have been conceptualized using the analogy of the
flaneur curiously strolling through streets and experientially
making sense of a city [4]. To foster such forms of
serendipitous information seeking and spawn interest in collections, visualizations can offer unconventional and inviting
views [18]. Presenting faceted relations as visual paths and
connecting interface states through transitions can support
lateral movements through interconnected collections [5].
Continuing these efforts in visualization and building on
the concept of the monad, we will develop an approach
to information exploration that takes search queries and
particular elements as vantage points onto a collection.
TARDE’S MONADOLOGY
“Each monad draws the world to itself,
and thus has a better grasp of itself.”
– Gabriel Tarde [17]
The people and artifacts in our lives define us, just as our
relationships to them alter the meanings we ascribe to them.
Friendships, interests, and professions are rich sources for
understanding ourselves as well as our social and material
environment. Such a relational perspective on the world
coincides with a growing prevalence of richly interconnected
information spaces on the Web such as social networks
and media-sharing communities. However, this growing
relational embeddedness of digital resources is still neglected
by the interfaces used to navigate such collections. While
each entity in these informations spaces, e.g., a person
or a photo, is connected with many other entities, the
existing interfaces downplay the rich interconnectedness that
is becoming increasingly prevalent. To conceptualize the
relational aspects of data sets and conceive new methods for
interacting with them we draw from work in sociology.
Resembling the tension between global and local views on
networks, there has been a struggle between the macro and
micro scale in social science since its earliest days [14].
The social network model has grown as an analytic lens
among social scientists as a means to study the structure of
society [21], due in part to the widespread public use of
social network sites. While social network sites are used in
diverse ways, the underlying social network model and its
representation as web-based interface provide only limited
mechanisms for individual meaning making in navigation.
The social network model tends to flatten relations, assuming
them to be univariate and mutual [3]. Although social
networks describe complex relations among individuals, they
do not represent the richness of those ties. Moreover, as
these social ties are decontextualized from the relational
world in which they exist, they potentially further reduce the
meaningful history of a relationship. Such reductions result in
a top-down model of society, in the form of a highly abstract
network—resembling the reductions that most visualization
techniques rely on to provide overviews of large data sets.
While ostensibly operating at the global level, in-grained in
this perspective is an assumption that the individual, as a fundamental social unit, has also changed [23]. Such ‘networked
individualism’ asks the individual to become devolved from
their context to preserve the value of a dispersed network
(for instance in the actualization of social capital). It is thus
argued that the social network profile, together with its many
counterpart fragments across various social media channels,
gives rise to the isolation of the individual from its context. In
the case of the individual human actor, it is argued that online
social networks change who we are as individuals because
they allow us to deliberately write ourselves into being across
distributed spaces [19], configuring local networks in global
contexts. In contrast, we do not argue that individuals are
isolated from each other, in fact, the opposite effect is often
possible, but rather that the network model reinforces a
dichotomy of the local and global, the part and the whole.
Among those scholars who resist this dichotomization, such
as Tarde, Bahktin, Simmel, Elias, and Latour, a relational
worldview is espoused. In this text, we follow this argument
as forwarded by Tarde [17] and, later, Latour et al. [14], to
rethink the exploration of information spaces. We agree that
the dichotomy of element and aggregate is unnecessary and
unfounded, and that alternative theoretical accounts of the
social world might be better founded on the relationships between those elements. This is the perspective put forward by
Gabriel Tarde in his text ‘Monadology and Sociology’ [17].
Drawing on Lorenc’s reading of Tarde [17], we identify three
principles of monadology, which can positively contribute to
the study and design of novel exploration interfaces.
On Having, Not Being
Tarde sees a monad as an element’s own relational perspective
onto the world—whether social or physical. The notion
of the element and the characterization of the world as
fundamentally relational can be seen in Tarde’s appeal to
the Newtonian principle of reciprocal action: as each monad
exerts its influence upon another, it is equally influenced by
that other. Thus any attribute (reiterating the Newtonian link,
we could consider weight) is defined by the relation (i.e.,
gravity) between elements, and not by the a priori being of
the entity. He posits that the essential qualities of an entity
is not that of ‘being’, but of ‘having’. Specific attributes then
are those belonging to an entity, but to which, conversely, the
entity also belongs. For instance, the monad of ‘me’ has the
attribute ‘academic’, while the monad ‘academic’ has ‘me’.
Having suggests the primacy of relational aspects embedded
in collections. Therefore each element should be understood
as an entity mainly in so much as it has relations to other
entities. For example, a photo meaningfully exists insofar
as it relates to people, places, and events. Furthermore, we
might also suggest that all elements have relations to all other
elements, even when a relation is of total difference. In this
way, a monadic interface represents the social world of an
information space by visualizing the varying relations among
the elements of a collection. While, this principle prioritizes
the relations among elements, it does not preclude the use of
individual properties of elements such as color or size.
The Essential Difference
Central to Tarde’s monadology is the argument that the
element takes precedence over the aggregate. There is a
critical point in this assertion, namely that difference is
pivotal in the construction of monads. The monad is defined
by its particular perspective on its world, which is defined by
the unique relations to others. The monadic perspective then
is dependent on the extent to which each monad is expended
in the constituting monads of the others. Thus each monad
is defined by the overlapping spheres of monadic influence
of others. Given that monads are not mutually exclusive
(elements can contain shared characteristics), we can assume
that two monads that occupy fully identical spaces are, in
fact, the same monad. By extension, the way in which we
understand a monad is not in its similarity, but difference
to others. Therefore, while a monad may exert influence
over other monads, it must do so without itself becoming
extinguished in the other—it must retain difference.
Difference as the second defining feature of an element should
be recognized within the information space. In contrast to a
focus on similarity among elements (e.g., products in online
shops), a monadic perspective emphasizes an element’s
distinguishing qualities. In line with ‘having’, difference is
not an a priori property of the element but its unique position
in the world. We propose therefore that each element must
stamp its particular identity on the relational world, which is
its own monad. That is, the difference of the element must be
conveyed by taking the monad’s perspective on the world.
Meaning in Movement
The principles of having and difference construe the monad
as a unique perspective onto the world achieved through the
relations with other entities. However, the monad’s perspective on the world is not simply inscribed by mechanistic
laws. Tarde stresses that a monad is not a configuration of
static relations, but rather a highly dynamic and contingent
arrangement. This is a fundamental break away from the
structuralist perspective of many of Tarde’s contemporaries
(and those who followed them). For him, this is a significant
consideration for sociology, as it is equally for us with
regard to information exploration: in what way can we
understand the whole through the dynamic relations among
the parts? Tarde is joined in this concern by many others,
most notably Simmel. As Frisby reiterates Simmel, the
question of understanding the whole (famously ‘What is
Society?’) is reliant on exploring “all those modes and forces
of association which unites its elements” [8]. How can we
make these forces of association in collections visible? This
question corresponds to Latour et al.’s challenge “to account
for longer lasting features of social order by learning to
navigate through overlapping ‘monads”’ [14]. This emphasis
on navigation ascribes a unique role to movement as a way to
experience the relations and differences among elements.
Movement suggests a way of making sense of an information
space by navigating along elements as overlapping monads.
While the principles of having and difference highlight the
relational quality of an element’s unique position in an
information space, the principle of movement relates to
the dynamic quality of an element and the potential of
exploration as a form of interpretative sense-making. The
movement between monads should serve as a meaningful
proxy for the viewer’s movement through an information
space. The principle of movement is an invitation to explicitly
consider the purpose of animation to support exploration.
Taking the principles of having, difference, and movement
together, we propose monadic exploration as a way to
make sense of the relationships among entities exerting
their influences throughout an information space. Monadic
exploration is, therefore, the meaning-making movement
between overlapping vantage points in a relational world.
DESIGNING FOR MONADIC EXPLORATION
A monadic perspective suggests an approach to relational
information spaces that promises new types of explorations.
To substantiate this approach, we have undertaken an iterative
design process that started with above elaborations about
monads, continued with more practical considerations about
design goals for an interface, and finally led to a prototype.
In parallel, we engaged with a community behind a particular
information space that provided us with the opportunity
to get feedback and a sense for the potential for monadic
exploration. While we envision a wide range of interfaces
to be based on the idea of monadic exploration, we present
here one initial design that serves as a concrete example. This
design is not the only or necessary one, but it is explicitly
intended for monadic exploration of a densely interconnected
information space. In this section we focus on the decisions
behind the design of the visual interface. In the subsequent
section, we describe the findings from the case study of a
highly cross-referenced book and its six-month deployment.
Representation: Taking a Monadic View
We first discuss the representational considerations for a
monadic visualization of a relational information space. The
premise is that elements have some relationships among each
other, feature textual and/or visual attributes, and can have a
type to distinguish, for example, between people and artifacts.
P
r
α
Centre
Collection
From Profiles and Graphs to Monads
The dichotomy between micro and macro in the social
sciences finds resemblance in the contrast between profile
pages and graph visualizations of social networks. The
typical structure of a profile page can be found on almost
any web-based information space far beyond social network
sites. While a few related entities are displayed on a given
page, revealing the relationships among other entities and the
rest of the information space requires conventional navigation
from one page to the next. In contrast to profiles, a graph
visualization represents the whole network typically using
a globally optimized graph-drawing algorithm. To convey
higher-level structures in a network, graph visualizations tend
to diminish the individual differences between nodes and
their particular relations among each other.
Considering the monadic principles developed in the previous
section, it becomes apparent how neither profiles nor graphs
facilitate the movement between elements to discern their
differences and explore their influence on the collection. The
profile focuses on the individual details of one node without
much consideration of the larger context and a graph portrays
the abstract structure of an entire network neglecting the
richness of individal elements at the node level.
We seek to find a way to retain the individual and relational
aspects of elements when representing an interconnected
information space. To support monadic exploration, we aim
to design a visualization of elements as both vantage and
navigation points providing both nuanced perspectives on
and inviting gateways through relational information spaces.
Based on this general aim and the principles of having,
difference, and movement, we posit these design goals:
Offer elastic layout. Visual arrangements of a collection
should portray both subtle and marked differences in relations
among elements. Based on the explorer’s steps, the layout
should fold and stretch as elements shrink, expand, and move.
Reveal differences. During the exploration of the collection
the variation of attraction among elements should be represented as animated transition of positions, opacities, and
labels. The resulting movements should convey difference.
Integrate navigation and search. The explorer should be able
to shift between different forms of information seeking. Both
open-ended navigation and more targeted keyword search
should be supported within the same visual arrangement.
Figure 1. A monad has a search query or an element selection at its
center and a circular arrangement of a collection’s elements around it.
A Monad As a Circular Layout
We define a monad as the visual arrangement of a collection
around the explorer’s interest that is manifested at the center
of the monad and expressed either as a search query or an
element selection. We adopt a polar coordinate system to
negotiate the overall structure of a whole with the differences
among the parts. As shown in Figure 1, an element is
positioned at point P with angular coordinate α encoding
any collection-wide ordering (e.g., by type or name) and
radial coordinate r being inversely proportional to the search
relevance or the attraction strength to the selected element.
By using a combination of node specific and collection wide
encodings for position, the monad has both dynamic as well
as stable qualities. In this sense, the monad offers an elastic
lens, which dynamically draws the elements to the center or
pushes them towards the periphery within a stable structure
of a global ordering around the circle. The radial movements
of elements only represent changes in attraction, making the
movement a meaningful visual variable to discern difference.
Subtle Attractions
The radial coordinate is intended to convey likely interestingness of a given element based on its relationship to an
explorer’s search query or element selection. The effect
is that the more relevant an element is, the closer it gets
positioned towards the center than those that are less relevant.
Search relevance can be computed, for example, by counting
the occurrences of the query across each element’s text fields
(e.g., title, teaser, and text). A more robust technique is tf–idf,
a common measure used in information retrieval to determine
how relevant a result is for a given set of search terms; if one
of the terms is more common in the collection than the others
it will contribute less in the overall ranking.
Besides a search query, an element itself can be the basis
for determining the possible interestingness of each element
in a collection. For this we assume that a direct connection
between the selected element and another element in the collection is an indicator for attraction. However, a connection
between nodes is binary and does not account for the dense
pathways contained in interconnected information spaces.
C
C
E
B
A
?
Type
F
.1
B
A
Selected Element
E
.01
.21
.1
D
Hovered
F
D
brushed elements
Linked/matched
Linked/matched
Related
Related
Distant
A
A
B
C
D
E
F
1
0
0
0
0
1
1
1
0
B
0
1
0
C
.11 1.1
0
1
D
.1 1.01 .11
1
E
.11 1.11 1
F
.02 .21 .11 1.01 1.01
B
1
C
0
1
D
0
1
0
E
0
1
1
0
F
0
0
0
1
1
Adjacency matrix
A
B
1
A
1
C
D
E
F
.11 .1 .11 .02
1.1 1.01 1.11 .21
.11
1
.11
Figure 3. An illustration of the varying visual appearances of elements
according to their attraction value as well as interaction state. If an
element is directly connected with the hovered element, a brighter tone
of the element’s dot color is added as a background behind its label.
.21 1.01
.21
1.01
Attraction matrix
Figure 2. Both direct and indirect connections contribute to the relationship between nodes. Based on the information from the adjacency
matrix, the attraction matrix captures more nuanced relationships.
To get a more nuanced sense of relationship between two
nodes we can additionally consider the indirect connections
between them. Consider the graph depicted in the top left
of Figure 2. There may be no direct link between B and F,
however, there are three paths via C, D and E that suggest
an implicit attraction nevertheless (top right). To consider a
more nuanced indication of attraction between elements, we
include indirect paths between elements in addition to direct
links. The attraction score AI,J between two nodes I and J
then corresponds to the weighted sum of paths pi :
AI,J = p1 + w2 · p2 + w3 · p3
with p1 equal 1 if directly linked, otherwise 0, p2 and p3 as
the number of two-hop and three-hop paths, and w2 and w3 as
weights (through iterative refinement we settled with 0.1 and
0.01). Given a binary adjacency matrix we can calculate an
attraction matrix containing the strength of attraction for each
pair of nodes (see Figure 2, bottom). We assume that edge
weights equal 1; this can be adapted to account for weighted
edges by introducing additional weights for each summand.
When there is neither an active search query nor element
selection, the displacement of elements is based on a node’s
degree, i.e., number of direct connections, as a straightforward measure of centrality. Node degree serves as a proxy
for potential interest inviting the explorer to select an element
without having to enter a search query to see some elements.
Dots and Labels
Labeling is a computationally complex challenge in visualization, especially when displaying many elements. We
address this problem in two ways: 1) only elements with
relatively high attraction scores are labeled, and 2) labels are
displayed in radial arrangements around the circular layout
around which each element has a dedicated segment. The
only time label overlaps occur is when two similarly relevant
elements are neighbors in the circular ordering. Using the
mouse pointer one can clarify and read them individually.
Elements are displayed as a dot and optional label. As
illustrated in Figure 3, the visual appearance of dots and
labels is varied to reflect different relationships and interaction states. There are two types of relationships to convey:
adjacency as the binary relationship of having a direct
connection, and attraction as the more nuanced relationship
based on direct and indirect paths or search relevance. The
attraction values are already encoded by an element’s position
using the circular layout discussed above. Position allows
for the discernment of smaller differences that is adequate
to represent more nuanced differences in attraction. The
binary connectivity is conveyed by the opacity and therefore
darkness of the dot and label: linked elements are displayed
significantly darker. Similarly for search, if an element has
at least one occurrence, the element is drawn darker. There
are only two levels of opacity used for the dots, making the
visual discrimination between these two effortless.
An element’s label is simply the title of the represented entity,
e.g., the name of a person or the title of an article. Labels
are placed facing towards the outside of the display, and
rotated according to the angular coordinate used for element
placement. Similar to how the dot’s opacity varies, the label
is shown only in full opacity for elements that have either a
direct connection with the activated element or are matched
against the search query. If the attraction value is weaker
the label is shown either with reduced opacity or not at all—
depending on the number of displayed elements.
The color used for the dot and label denotes the type of that
element. While distinguishing elements by color is optional,
it can help to discern the distribution of element types in
a heterogenous information space. However, considering
the perceptually limited discriminatory power of color, we
suggest to use it when the number of types is lower than ten.
The size of the dot represents the element’s degree, that is the
number of connections to other elements in the collection.
When an element is selected as the center of the monad,
its dot and label move into the middle of the visualization
and are increased in the respective sizes. Within the dot a
symbol is embedded indicating the element’s type. Below
symbol and title, a brief description and an optional figure is
displayed providing more detail for that element. Displaying
elements as circles of varying sizes allows for non-disruptive
transitions between these different states. Together with the
selection of colors and fonts, the symbols can be used to
reflect the aesthetic identity of a given collection.
(a)
(b)
(d)
(c)
Figure 4. From views based on (a) node degree and (b) search relevance to (c) hover highlights and (d) selection of a specific node as the monad.
Interaction: Moving Between Monads
Search
The visualization supports three basic types of interaction:
search, hover, and select. The intention behind offering these
three interaction methods is to allow for targeted, provisional,
and exploratory movements through a collection. The search
allows the formulation of a query based on an existing
interest, while the hover function lets one peek around
without changing the layout; by selecting an element one
can navigate through a collection along its elements. When
a person opens the visualization with no active element, the
elements are placed around the circular layout based on their
node degrees (see Figure 4, top left). Highly connected
elements are positioned closer to the center and are displayed
with a label in contrast to less connected elements that are
arranged towards the outside with no label shown. At this
point the viewer can decide to either enter a search query or
hover over any of the displayed nodes.
When no element is selected, the search box is placed into
the center. Once a few letters are entered, elements are
moved according to their relevance scores (see Figure 4, top
right). As the query changes, elements move in or outward
and reveal or hide labels to reflect the changing relevance
scores. The effect is that the person entering a query can
get a general sense of the impact that query changes have
by seeing the movements toward and away from the center
in the immediate visual periphery of the search box. While
many search interfaces already offer query suggestions or
display results while a query is being entered, query changes
lead to abrupt display changes. In contrast, changing the
query in the monad does not disrupt the overall organization
of the visualization. Instead, elements either get gradually
expanded and pulled in when they become more relevant, or if
not, they are gradually folded and pushed towards the outside.
Figure 5. A book on creative activism (left) is used as a case study for monadic visualization. The interface represents the book’s contents using a
monadic Context view (see Figures 4) and additionally as Article (middle) and Network (right) views.
Hover
Setup and Interface Design
Moving the mouse pointer over any element shows how it
relates to other elements (see Figure 4, bottom right). Regardless whether a search query is active or an element has been
selected, hovering over dot or label of an element highlights
connected elements of that hovered element (foreshadowing
which elements move closer when clicked). The hovering
function allows the viewer to inspect whether two elements
share an element as a neighbor. On the flip-side, it is possible
to discern which elements are neighbors of the hovered
element, but not of the centered element by looking for those
highlighted elements with brighter dots. Furthermore, if an
element’s label is not shown (due to a low attraction value),
hovering over its dot reveals the label. Thus one can deviate
from the emphasized elements in the center and investigate
peripheral elements that differ from a search or selection.
The book contains 194 modules about creative forms of
protest and civic engagement. The modules are categorized
into five types: tactics, principles, theories, case studies,
and practitioners. In total, there are 1938 references linking
related modules; in the book these references are shown on
the margins of the pages (see Figure 5, left). The references
turn the book into a densely interlinked information space. To
integrate the visual design of the interface with the book, we
adopted the same color scheme from the website and used the
same symbols representing the module types.
CASE STUDY: BEAUTIFUL TROUBLE
The interface used for the deployment had three views:
Context, Article, and Network. The Context view is the visualization discussed in the previous section. The Article view
approximately resembles the display of many information
spaces on the Web, such as posts on blogs or profile pages
in online communities (see Figure 5, middle). The purpose
of the Article view is to show great detail about an entity,
allow for its close examination, and provide links to related
pages. While there are many ways of visualizing networks,
most network visualizations use force-directed algorithms
and display all edges among nodes. The aim with the
Network view was to provide one such perspective on the
interconnections among modules (see Figure 5, right). The
Network view uses the Fruchterman-Reingold layout [9] as
is provided by the network visualization environment Gephi.
Curved edges among nodes are shown in faint shades of grey,
except for the selected element whose edges are displayed in
dark tones of the element’s color. Node labels are only shown
for the selected element and directly connected neighbors.
To better understand the potential of monadic exploration
we used the book ‘Beautiful Trouble: A Toolbox For Revolution’ [1] as a case study. Being highly cross-referenced,
the book serves as an intriguing example of a relational
information space. This book is also a particularly interesting
dataset for our purpose here, because of the interest and
passion that the editors and readers have for the subject
matter. To contrast the use of the monadic perspective with
established representations, we created an interface that also
offered profile and graph views on the book’s contents. In
collaboration with the team behind the book, we deployed
the interface for six months on the book’s official website and
invited readers to explore the book’s contents with it.
Each of these three views provides a different perspective
on the book’s contents emphasizing different aspects and
granularities. We integrated these three views into the same
interface to allow for a close consideration of these distinct,
yet related perspectives. The rationale behind this was not to
illustrate the superiority of one of these views over another
(admittedly we focused our design on the Context view),
but rather to contrast typical ways of displaying relational
information spaces with a view designed towards monadic
exploration. By juxtaposing these views in one interface we
can compare how they are used and received, and think how
the experience differs between the three approaches.
Select
Clicking on any element turns it into the current selection of
the monad (see Figure 4, bottom left). If there is an active
search or a selected element, it is replaced by the element.
The dot and label increase in size and move into the center.
Below the label is a description of the active element. As a
new active element changes the relative attraction values of
the other elements they will gradually move and adjust their
opacity. During this transition the hover highlights remain
visible allowing the viewer to follow elements that are linked
with the newly selected element. After the moving transition
is over, the hover highlights eventually fade out.
The visual design and interactivity is integrated across the
different views. The interface has a tab for each view on
the top indicating which is active and allowing the viewer to
switch modes, which results in an animated transition moving
elements to their new positions in the respective layout. The
intention behind this integration is to see the relationships
between these views and notice how elements are arranged
differently. For example, when switching from Context to
Article view, the circular arrangement of elements gradually
morphs into the linear list on the side of the Article view.
To integrate the interface with the book’s website we worked
closely with the technical lead of the team behind it. We had
access to the book’s modules via their content management
system, and deployed the interface on a subdomain of the
book’s website.1 Both website and visual interface were integrated with links between module pages and the respective
states in the views. The team announced the visualization
on their blog, mailing lists, and social media accounts as
an experimental interface for exploring the book. Visitors
were encouraged to give feedback in the interface. During
the six months of the deployment, we received 124 feedback
submissions and the visualization attracted 4890 visitors.
Editors: “Feels Like Home”
Following the initial deployment, we asked the editors to give
their perspective on the final prototype. Having discussed the
concept of the monad with them, we wanted to know how
they felt the interface lived up to their expectations. Feedback
was provided via e-mail responses. In what it contributes to
their website, the editors felt that the visualizations “highlight the web of relationships among the content elements”
[Andrew] and provide a “variety of ways to interact with
the content” [Phillip]. Further comments from Andrew and
Phillip reveal a difference in how they value the various views
within the interface. For Andrew the Context view “feels like
home”. He draws on this sense of familiarity, and compares
those ways the overview of the book has been presented in
print format with how the Context view extends upon them:
“It’s like a dynamic table of contents – a very organic
and responsive and navigable ‘map’ of the book’s
content and relationships – with an ability to glance at
or skim the surface of the actual content.”
The Context view is, in this sense, an overview that captures
the monadic perspective of the whole. Although this appears
to stand aside from the content, Andrew insists that there is an
organic connection between the Article and Context views:
“The Article View offers a focus or spotlight on a
particular piece of content, one that you can organically
‘drop into’ from the Context View.”
For Phillip, it is the Article view that holds the most value as:
“The Article view is a nice compromise: showing both
the module content and the relations in a way that makes
it visually apparent that certain other modules are more
or less related to the one in focus.”
1
http://explore.beautifultrouble.org
One possible solution is proposed as Andrew asks for a
unified monadic interface, where the Article view is fully
embodied in the Context view. Although we envisaged the
three views as interwoven, this was not incorporated into
the prototype interface. Both Andrew and Phillip provide
negative feedback on the Network view, which they felt to
stand apart from the symbiosis between the other views:
“The Network View feels disconnected from the other
two views, more like a side-show novelty. It’s also
a map, but not one that feels particularly welcoming
or navigable or responsive or useful, compared to the
Context View.”
Asked to speculate about future directions of using visualization to explore the content, Andrew is considering
the “possibility of making a combined Context-Article View
THE interface for the site”—not as an alternative, but a
replacement of the existing website. Phillip mentioned that
the interface does not support mobile devices, something
which would need to be taken care of in the long term.
Participants: “Learning While Walking Around”
Feedback from visitors was collected through an online
feedback tool built into the deployed interface. Visitors were
asked to share “thoughts, impressions, and suggestions about
the interface and the different views.” This feedback points,
in the main, to positive and enjoyable experiences. More
interesting for us are both the ways in which the constructed
monadic perspective serves navigation and the limitations of
the views achieving this. Much like the book editors, users
also felt that the interface generally accomplished that which
the monadic perspective requires. All feedback submissions
that explicitly compared the different views favored the
Context and Article views over the Network; for example:
“I liked the article and context pages and found it easy
to use them–the visualization of relationships on the
context page was exciting. Not so the Network page.”
Several comments suggest immersive qualities of the interface, such as: “It feels like I could spend hours...” and
“Makes you want to read another article.” This suggests
a complex relationship between aesthetics and substance,
where the visuals seem to encourage a close engagement
with the content, one where exploration supports meaning
making. One user calls to mind the metaphor of the flaneur,
reconstructing the flow of meaning making in transition:
“It’s nice and funny! :-) learning while walking around.”
Another user reiterates this sentiment, but draws attention to
the potential for overload:
“When I first looked at it, I was a bit fazed by how it was
organised. . . but it is remarkably intuitive and after the
first few minutes, exploration became really enjoyable.
There’s so much visually present that the occasional
overlapping titles create a sense of information overload, but the system encourages its own familiarisation.”
This is an intrinsic familiarization, where the interaction
techniques produce an evolving knowledge. Users drew
specific concerns with the Network view—as “messy,” “over-
whelming, and therefore, counterproductive.” For some this
is a fundamental difficulty with the system. In viewing the
prototype system, users were concerned with the lack of
directed navigation and information seeking:
“Not sure how useful this interface would be if I were
looking for guidance in a particular area...”
Some users see the interface to be prohibitive for information
seeking: “The cross-indexing is very complex; I’m not sure it
serves to quickly zero in on particular content...” (The search
function was not introduced until after the first four weeks of
deployment.) However, the same visitor follows on to see this
limitation as a potential:
“...it’s a treasure hunt for discovering. Be prepared to
wade in and be immersed in the collective [...] wisdom
of the best social change agents active now.”
DISCUSSION
The shared feedback largely resonates with Tarde’s characterization of monads in constant movement with a drive to grasp
the world and shape it to their desires [17], which raises some
interesting questions about monadic exploration.
For the purpose of exploration, we defined the monad as a
visual arrangement of elements communicating relationships
and allowing for gradual movements through a collection.
While these movements are triggered by human explorers,
we have not considered their role in the visualization itself.
As a person navigates using the monad, could the monad
itself be seen as their avatar in an information space? With
the desire of the monad to exert influence on the world we
recognize the poetic, aesthetic, and imaginary interest of the
information flaneur [4] as a central driver in making meaning
of information spaces. However, can we position the flaneur
as a monad into the world in which they navigate? We refer
to Latour’s expression that “another experience of ‘being in a
whole’ should be explored that has little to do with ‘being a
part’ of a ‘structure’...” [14]. The information flaneur relates
to the collection, as the urban flaneur to the city, as not ‘part’
of the city, but nonetheless in it. In this sense, the flaneur
reveals the space as a continuation of being therein, where
“the added value is no longer the power of prediction, but
the progressive shift from confusing overlaps to successive
clarifications of provisional wholes” [14]. This is also crucial
for the realization of the monadic perspective, as the interests
of the flaneur might transcend the collection in question.
While the monadic view responds to the explorer’s transient
interest, their ongoing meaning making could form a more
gradually evolving basis for attraction forces. Furthermore,
the interaction histories of many explorers could inform collective attraction forces [24]. As Tarde explicitly rejects the
monad as a machine with a static “distribution and direction
of pre-existing forces” [17], people’s changing inclinations
and contingent movements through an information space
can give rise to unexpected discoveries and changes to a
collection. Considering attraction forces among elements and
explorers to evolve over time, a monad becomes a temporally
specific perspective on an information space. The visualization we introduced is atemporal, however, a simple addition
would be the introduction of temporal elements representing
time spans meaningful for a given collection. However,
besides treating time as metadata fields, the challenge is
to meaningfully represent temporal dynamics in relational
information spaces. Could time-sensitive monads help us
recognize stories in evolving information spaces?
During the creation of a particular monadic interface, we
found it useful to translate the conceptual principles of the
monadic perspective (having, difference, and movement)
into three concrete design goals (offer elastic layout, reveal
differences, and integrate navigation and search). Due to
the engagement with a community of book editors and their
readers, we observed two additional design principles that
appeared to be beneficial for monadic exploration: 1) provide
stable, yet dynamic arrangements, and 2) consider the visual
style of a given collection. First, by devising a layout
that (paradoxically) integrated a reliable order with dynamic
displacements, it was possible to negotiate the influence of
the collection and the explorer; it seemed that this negotiation
was crucial to provide a sense of orientation and facilitate
meaning making. Second, the visualization design was meant
to be sensitive to the aesthetics of the represented collection
(especially via colors and symbols), which seemed to help the
explorers to trust the interface to be truthful to the content.
CONCLUSION
We adopted the perspective of the monad, as advanced by
Tarde and Latour, to problematize the dichotomy between
aggregate and element. Based on the idea of a monad as
an element’s relational perspective onto the world, we introduced monadic exploration as a method to navigate relational
information spaces along overlapping vantage points. We
have presented one particular visualization that is based on
this approach that merges the macro and the micro in a circular arrangement of elements. We applied this visualization
to a cross-referenced book and deployed it as part of an
experimental interface for six months. The feedback about
the potential of monadic exploration was very promising;
participants felt that the monadic view provided an inviting
way to explore the book’s contents and appreciated the
visualization’s immersive qualities.
In summary, we have made the following main contributions:
• A theoretical treatise about the concept of monads that
identifies key principles to inform new types of interfaces.
• A visualization technique that represents a collection as a
circular arrangement of elements designed to support both
exploratory and targeted forms of information seeking.
• A case study of a highly cross-referenced book contrasting
a monadic visualization with conventional representations.
During this work, interesting questions came up about the
role of the explorer in a monadic interface and the treatment
of temporal dynamics. How can a monad support explorers
in following their changing interests? In what ways can
the temporal dynamics be exposed that are latent in an
information space? These are some of the questions we wish
to pursue further in future work on monadic exploration.
The distinction between the whole and its parts has been
a useful one for information visualization to cope with the
scale differences at these two granularities, however, it also
introduced an artificial boundary between high-level structure
and low-level detail. While we do not claim that the presented
interface resolves this dichotomy once and for all, we hope
that the monadic perspective can bring fruitful considerations
for interaction and visualization design to make the relational
qualities of collections visible and navigable. To quote
Bruno Latour from his CHI 2013 keynote: “the future
belongs to those who are able to navigate through overlapping
monads” [13]. In particular in the context of cultural archives,
digital humanities, and the arts, we see great potential for
monadic interfaces to support new types of engagements with
relational information spaces.
ACKNOWLEDGMENTS
We are indebted to the Beautiful Trouble team, especially
Andrew Boyd and Phillip Smith, for their willingness to
collaborate with us. Thanks also to Tom Schofield, Mitchell
Whitelaw, Tim Dwyer, and Annika Haas for their insightful
feedback and to our colleagues at Culture Lab for stimulating
discussions related to monads. We are also very grateful for
the constructive feedback from the reviewers. This research
was funded by the RCUK PATINA Project (EP/H042806/1)
and the EPSRC SIDE Project (EP/G066019/1).
REFERENCES
1. Boyd, A., and Mitchell, D. O., Eds. Beautiful Trouble: A
Toolbox For Revolution. OR Books, 2012.
2. Cockburn, A., Karlson, A., and Bederson, B. A review
of overview+detail, zooming, and focus+context
interfaces. ACM Computing Surveys 41, 1 (2008), 1–31.
3. Donath, J., and boyd, d. Public displays of connection.
BT Technology Journal 24 (2004), 71–82.
4. D¨ork, M., Carpendale, S., and Williamson, C. The
information flaneur: A fresh look at information
seeking. In CHI ’11: Proceedings of the SIGCHI
Conference on Human Factors in Computing Systems,
ACM (2011), 1215–1224.
5. D¨ork, M., Riche, N. H., Ramos, G., and Dumais, S.
PivotPaths: Strolling through faceted information
spaces. TVCG: Transactions on Visualization and
Computer Graphics 18, 12 (2012), 2710–2719.
6. Fisher, D. Using egocentric networks to understand
communication. Internet Computing 9, 5 (2005), 20–28.
7. Freeman, L. Visualizing social networks. Journal of
Social Structure 1 (2000).
8. Frisby, D. Simmel and Since: Essays on Georg Simmel’s
Social Theory. Sociology: Cultural studies. Routledge,
1992.
9. Fruchterman, T. M., and Reingold, E. M. Graph drawing
by force-directed placement. Software: Practice and
experience 21, 11 (1991), 1129–1164.
10. Heer, J., and boyd, d. Vizster: Visualizing online social
networks. In InfoVis 2005: Symposium on Information
Visualization, IEEE (2005), 32–39.
11. Henry, N., Fekete, J., and McGuffin, M. NodeTrix: A
hybrid visualization of social networks. TVCG:
Transactions on Visualization and Computer Graphics
(2007), 1302–1309.
12. Kairam, S., MacLean, D., Savva, M., and Heer, J.
GraphPrism: Compact visualization of network
structure. In AVI 2012: Advanced Visual Interfaces,
ACM (2012), 498–505.
13. Latour, B. From aggregation to navigation: A few
challenges for social theory. Closing plenary keynote at
CHI ’13, Paris, May 2, 2013.
14. Latour, B., Jensen, P., Venturini, T., Grauwin, S., and
Boullier, D. The whole is always smaller than its parts –
a digital test of Gabriel Tardes’ monads. British Journal
of Sociology 63, 4 (Dec 2012), 590–615.
15. Marchionini, G. Exploratory search: From finding to
understanding. Comm. of the ACM 49, 4 (2006), 41–46.
16. Shneiderman, B. The eyes have it: A task by data type
taxonomy for information visualizations. In Proc. of the
IEEE Symposium on Visual Languages (1996), 336–343.
17. Tarde, G. Monadology and Sociology. re.press, January
2012. Originally published 1893. Edited and translated
by Theo Lorenc.
18. Thudt, A., Hinrichs, U., and Carpendale, S. The
bohemian bookshelf: Supporting serendipitous book
discoveries through information visualization. In
CHI ’12: Proceedings of the SIGCHI Conference on
Human Factors in Computing Systems, ACM (2012),
1461–1470.
19. Turkle, S. Life on the Screen. Simon & Schuster, 2011.
20. van Ham, F., and Perer, A. ”Search, show context,
expand on demand”: Supporting large graph exploration
with degree-of-interest. TVCG: Transactions on
Visualization and Computer Graphics 15, 6 (2009),
953–960.
21. Wasserman, S., and Faust, K. Social network analysis:
methods and applications. Cambridge University Press,
1994.
22. Wattenberg, M. Visual exploration of multivariate
graphs. In CHI ’06: Proceedings of the SIGCHI
Conference on Human Factors in Computing Systems,
ACM (2006), 811–819.
23. Wellman, B. Little boxes, glocalization, and networked
individualism. In Digital cities II: Computational and
sociological approaches. Springer, 2002, 10–25.
24. Wexelblat, A., and Maes, P. Footprints: history-rich
tools for information foraging. In CHI ’99: Proceedings
of the SIGCHI Conference on Human Factors in
Computing Systems, ACM (1999), 270–277.
25. White, R. W., Kules, B., Drucker, S. M., and m.c.
schraefel. Supporting exploratory search: Introduction.
Comm. of the ACM 49, 4 (2006), 36–39.
26. Yee, K.-P., Fisher, D., Dhamija, R., and Hearst, M.
Animated exploration of dynamic graphs with radial
layout. In InfoVis 2001: Symposium on Information
Visualization (2001).
© Copyright 2026 ExpyDoc