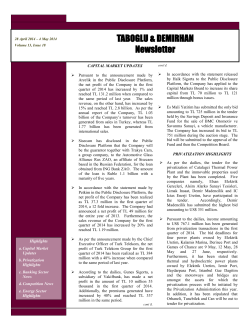
NORTHERN STAR RESOURCES
Research Note
TYPE TITLE HERE
Investment highlights
•
•
•
•
The value of Northern Star (NST) has declined simultaneously
with the gold price and it is now one of the only gold stocks
with solid fundamentals trading at a discount to our price
target. We have also seen gold prices in Aussie dollar terms
remain relatively stable and believe that NST can continue to
extract efficiencies from its diversified production base of five
operating mines in Western Australia. At current price levels,
we see NST as a very attractive prospect in the gold sector
given that it trades on a PE ratio of 4, has a robust Balance
Sheet and is deriving solid operating cashflow. Hence we are
upgrading our recommendation to Buy (previously Hold) with
a price target of $1.29/share.
The September Quarterly - The Company sold 150.3koz in the
Quarter at an average price of $1,399/oz. The average All In
Sustaining Cost (AISC) of production was $1,043/oz, including a noncash item of $50/oz relating to site rehabilitation liabilities.
Underlying free cash flow was $50m when normalised for one-off
cash outflows relating to the Jundee acquisition of $90.8m and oneoff acquisition/integration costs of $4.6m. As at 30 September 2014,
bank debt totalled $50m after reducing its loan by $20.8m in the
period, while cash and cash equivalents were $101.5m.
The quarterly takeaways – this was the first Quarter to incorporate
all five of NST’s projects and the result highlighted the benefits of a
diversified portfolio of producing assets. It is hard to match NST’s
enthusiasm for the quarterly result as the Company sets high
expectations and there were some assets that outperformed our
expectations, while others were below expectation. However, these
high expectations are set primarily within the Company and that
should drive value and cash flow in future periods.
4 November 2014
12mth Rating
BUY
Price
Target Price
12m Total Return
A$
A$
%
1.01
1.29
32.3
RIC: NST.AX
Shares o/s
Free Float
Market Cap.
Net Debt (Cash)
Net Debt/Equity
3m Av. D. T’over
52wk High/Low
2yr adj. beta
m
%
A$m
A$m
%
A$m
A$
BBG: NST AU
592.3
78.7
595.2
-40.2
na
9.46
1.88/0.64
0.88
Valuation:
Methodology
Value per share
DCF
1.29
A$
Analyst:
Matthew Trivett
Phone:
(+61 7) 3737 8053
Email:
[email protected]
Exploration – NST has set out a $50m exploration campaign across
all five operations during FY15. The primary strategy will be to grow
the mine lives of each of the Company’s assets. In addition to this
primary strategy, there are a number of regional targets that will be
tested. We expect this will provide a good flow of assay results and
should provide confidence that our current mine life estimates are
easily achievable.
•
12 Month Share Price Performance
Performance %
Absolute
Rel. S&P/ASX 300
1mth
-13.4
-12.8
3mth
12mth
-36.2
-28.5
35.0
48.2
RESEARCH NOTE – PATERSONS SECURITIES LIMITED
All information and advice is confidential and for the private information of the person to whom it is provided and is provided without any responsibility
or liability on any account whatsoever on the part of this firm or any member or employee thereof.
1
4 November 2014
Northern Star Resources
The September Quarter was the first Quarter to incorporate all five of NST’s projects. The result
highlighted the benefits of a diversified portfolio of producing assets where the best and the worst
performers for the quarter offset each other. NST has also given us reasons to expect positive results
from the best performer, Kundana; improvements from the worst performer, Plutonic; and results to
be maintained at least from the remainder - Paulsens, Kanowna Belle and Jundee.
Plutonic – This was the poorest performing asset in the September Quarter with disappointing
metallurgical recoveries and relatively low grade ore from the mine. The low grades and recoveries go
hand in hand and, as the main focus since acquiring the mine has been on capital development, it is
expected this will turn around once access into the higher grade zones is established. Cost reductions
have continued with a reduction in labour costs and optimisation of mining and maintenance
materials. A new mining fleet at the end of the September quarter saw immediate improvement in
operational efficiencies and lower operating costs.
Kundana – this operation was the stand out in the last quarter with higher than expected throughput
which kept unit costs very low. Development of the Pegasus orebody is close to completion, with
production of this high-grade lode scheduled for the second-half of this financial year. The highly
prospective nature of the Kundana area was obvious at a site visit prior to Diggers and Dealers in
August, and we remain comfortable with our assumption of a 70% conversion rate of the currently
defined resources into ore reserves.
The Quarterly result confirmed that NST is successfully integrating the new assets. As shown in
Figure 1, production has grown from 24koz from one operation to 150koz from five operations while
maintaining cash costs around $800/oz and reversing a rising trend of increasing All-in Sustaining
Costs, which have been bought back under $1,050/oz.
The sustaining and development capital required is where we see potential weakness in NST as more
becomes known about the actual cost of running these operations. But, after looking at the Quarterly
Report, initial indications are that NST has control of these areas and it is likely further efficiencies
can be gained.
We are factoring in some of these gains in our steady state estimates of approximately $90m in total
capex across the portfolio per annum and $50/oz of gold produced in exploration costs. This equates
to ongoing AISC estimates of under $1,000/oz and implies that NST is in a very strong position to
weather the current volatile price environment. We also believe that NST will be the primary
investment if the gold price rebounds as it did in mid-December 2013 and early June 2014. From
December 2013 – March 2014 the gold price in Australian dollar terms increased by 14% and this was
matched by a 40% rebound in the gold equity index (refer to Figure 2).
Figure 1: Quarterly production and costs
Figure 2: Gold price and gold equity indices
1,600
180
160
140
Cash cost ($/oz)
AISC ($/oz)
0.25
PSL Gold Stock Index
Production (koz)
1,400
0.20
Gold Price Index (US$)
0.15
1,200
Gold Price Index (A$)
0.10
120
1,000
100
800
80
0.05
(0.05)
600
60
400
40
200
20
(0.10)
(0.15)
(0.20)
(0.25)
0
0
MarQ JunQ SepQ DecQ MarQ JunQ SepQ DecQ MarQ JunQ SepQ
2013 2013 2013 2013 2014 2014 2014 2014 2015 2015 2015
Source: Northern Star and Patersons Research
(0.30)
Source: Patersons Research
The final piece in NST’s strategy is expanding the resource and reserve base to support longer life-ofmine assumptions. NST has budgeted $50m to achieve this goal and it has yielded some early results
at Jundee outside the existing resource. Drilling at Kundana has focused on the Pegasus deposit and
a step-out program 160 metres north of the known extent of the Pegasus deposit. Drilling at
Paulsens focuses on the Voyager 2 and Titan areas. At Kanowna Belle exploration is focused on the
hangingwall and footwall structures near existing mine infrastructure. Results from these programs
will provide newsflow over coming months to help round out our view of the new NST.
RESEARCH NOTE – PATERSONS SECURITIES LIMITED
2
All information and advice is confidential and for the private information of the person to whom it is provided and is provided without any responsibility
or liability on any account whatsoever on the part of this firm or any member or employee thereof.
4 November 2014
Northern Star Resources
RESEARCH NOTE – PATERSONS SECURITIES LIMITED
3
All information and advice is confidential and for the private information of the person to whom it is provided and is provided without any responsibility
or liability on any account whatsoever on the part of this firm or any member or employee thereof.
4 November 2014
Northern Star Resources
Recommendation History
Stock recommendations: Investment ratings are a function of Patersons expectation of total return (forecast price appreciation
plus dividend yield) within the next 12 months. The investment ratings are Buy (expected total return of 10% or more), Hold (-10%
to +10% total return) and Sell (> 10% negative total return). In addition we have a Speculative Buy rating covering higher risk
stocks that may not be of investment grade due to low market capitalisation, high debt levels, or significant risks in the business
model. Investment ratings are determined at the time of initiation of coverage, or a change in target price. At other times the
expected total return may fall outside of these ranges because of price movements and/or volatility. Such interim deviations from
specified ranges will be permitted but will become subject to review by Research Management. This Document is not to be passed on
to any third party without our prior written consent.
RESEARCH NOTE – PATERSONS SECURITIES LIMITED
4
All information and advice is confidential and for the private information of the person to whom it is provided and is provided without any responsibility
or liability on any account whatsoever on the part of this firm or any member or employee thereof.
4 November 2014
Northern Star Resources
RESEARCH NOTE – PATERSONS SECURITIES LIMITED
5
All information and advice is confidential and for the private information of the person to whom it is provided and is provided without any responsibility
or liability on any account whatsoever on the part of this firm or any member or employee thereof.
© Copyright 2026 ExpyDoc