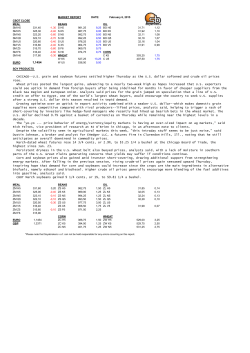
OUTLOOK FOR GRAINS
AND OILSEEDS—THE US
PERSPECTIVE
Joseph W. Glauber
Chief Economist
US Department of Agriculture
2 March 2014
Source: UN, 2011
growth rate
millions
World Population projections by region
Asian economic growth
Source: IMF, World Economic Outlook
Global consumption of grains and
oilseeds at record levels
MMT
Source: USDA PSD database
MMT
Global trade
million metric tons
250
Soybeans and products
200
150
Wheat
100
Coarse Grains
50
Source: USDA Agricultural Projections to 2023
2022
2020
2018
2016
2014
2012
2010
2008
2006
2004
2002
2000
1998
1996
1994
1992
1990
1988
1986
1984
1982
1980
0
US corn used in ethanol to grow modestly
Bil bu
6
5
Ethanol corn use
4
Ethanol share of corn
use (%)
3
Percent
40
35
30
25
20
15
10
5
0
2
1
2022/23f
2020/21f
2018/19f
2016/17f
2012/13
2010/11
2008/09
2014/15f
Source: USDA Agricultural Projections to 2023
2006/07
2004/05
2002/03
2000/01
1998/99
0
Short run outlook
for grains and
oilseeds
Global grain ending stocks remain tight
Crop
Wheat
Corn
Rice
Soybeans
Cotton
2000-03
Avg
120
89
115
74
193
Source: USDA, PSD database
2007/08
76
62
69
83
187
2008/09
96
69
77
71
208
2009/10
2010/11
Days of use
112
65
79
93
144
111
55
81
102
160
2011/12
105
56
83
76
261
2012/13
93
56
84
83
305
2013/14
96
61
81
99
322
Global wheat supply and use
Mil MT
February 10, 2014
World wheat supply and use
2012/13
estimate
2013/14
forecast
Million Tons
Beginning stocks
Production
Total Supply
Feed use
Total use
Trade
Ending Stocks
198.9
656.3
855.3
136.5
679.4
137.4
175.8
175.8
711.9
887.7
135.0
704.0
159.4
183.7
Change from
January
Change from
2012/13
Percent
Percent
-0.2
-0.1
-0.1
-1.0
0.1
0.5
-0.9
-11.6
8.5
3.8
-1.1
3.6
16.0
4.5
Projected wheat exports
MMT
Global rice supply and use
Mil MT
February 10, 2014
World rice supply and use
2012/13
estimate
2013/14
forecast
Million Tons, milled
Beginning stocks
Production
Total Supply
Total use
Trade
Ending Stocks
104.4
469.5
573.9
467.1
38.7
106.8
106.8
471.5
578.4
473.3
40.4
105.0
Change from
January
Change from
2012/13
Percent
Percent
-0.3
0.1
0.0
0.1
0.6
-0.1
2.3
0.4
0.8
1.3
4.5
-1.7
Projected global rice exports
MMT
Global corn supply and use
Mil MT
February 10, 2014
World Corn Supply and Use
2012/13
estimate
2013/14
forecast
Million Tons
Beginning stocks
Production
Total Supply
Feed use
Total use
Trade
Ending Stocks
132.8
862.8
995.6
515.7
861.6
94.5
134.0
134.0
966.6
1,100.6
573.5
943.3
114.4
157.3
Change from
January
Change from
2012/13
Percent
Percent
0.8
0.0
0.1
0.7
0.4
2.8
-1.8
0.9
12.0
10.5
11.2
9.5
21.1
17.4
Global industrial use of corn
MMT
Annual increase in corn industrial use
2000-10 2010-13
US
12.5%
--China
6.3%
4.9%
ROW
2.7%
2.1%
Projected global coarse grain trade
MMT
Growth in corn imports
Selected countries where imports are projected to grow
MMT
1/ excludes Japan, S. Korea, Taiwan, China, Indonesia, and Malaysia.
Growth in corn exports
Global soybean supply and use
Mil MT
Global soybean supply and use
2012/13
Beginning stocks
2013/14
Percent change
53.42
58.65
9.8%
Production
268.27
287.69
7.2%
Domestic crush
228.94
240.36
5.0%
Domestic total
258.48
270.92
4.8%
Ending stocks
58.65
72.33
23.3%
Growth of South America soybean exports
MMT
Projected growth in soybean imports
MMT
Projected growth in soy exports
MMT
Projected US plantings for 2014
Crop
2008
2009
2010
2011
2012
2013
Percent
change
2014F
Corn
34.8
35.0
35.7
37.2
39.3
38.6
34.8
-3.5%
Soybeans
30.6
31.4
31.3
30.4
31.2
31.0
30.6
3.9%
Wheat
25.6
24.0
21.7
22.0
22.5
22.7
25.6
-1.2%
All cotton
Minor feed
grains
3.8
3.7
4.5
5.9
5.0
4.2
3.8
10.5%
6.4
5.5
4.6
4.2
5.1
5.9
6.4
-14.8%
Rice
1.2
1.3
1.5
1.1
1.1
1.0
1.2
16.5%
102.4
100.7
99.2
100.9
104.3
103.4
102.4
-0.7%
14.0
13.6
12.7
12.6
11.9
10.8
14.0
-3.1%
116.4
114.4
111.9
113.5
116.2
114.2
116.4
-0.9%
Total 8 crops
CRP
8 crops +
CRP
Million hectares
Source: USDA-World Ag Outlook Board
Corn, wheat, and soybean prices
expected to fall from recent high levels
2008/09
2009/10
2010/11
2011/12
2012/13
2013/14
2014/15F
Wheat
249
179
209
266
285
250
195
Corn
160
140
204
245
271
177
154
Soybeans
366
352
415
459
529
467
355
Rice
370
317
280
320
328
353
351
Season average price paid to U.S. farmers; red denotes record levels.
Source: USDA-NASS, Feb 2014 WASDE, and USDA-World Ag Outlook Board
Implications
• Strong global production for grains and oilseeds has led to sharply lower
prices following years of relatively tight supplies.
• Long term growth in agricultural demand will continue to be driven
emerging developing markets
• Where will export growth occur?
• How vulnerable is world economy to downturn?
• Importance of resolving trade barriers and distortions
• After rapid growth, biofuel sector facing challenges
• E10 blendwall and declining motor fuel consumption
• Long run relationship of biofuels to fossil fuels
• Implications for price volatility
• Stocks remain tight
• Wheat—more dependent on FSU
• Soybeans—more balance between N. and S. Hemispheres
© Copyright 2026 ExpyDoc