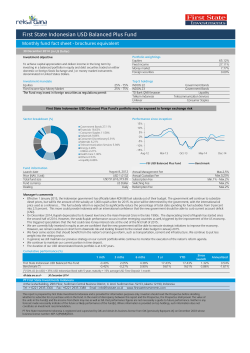
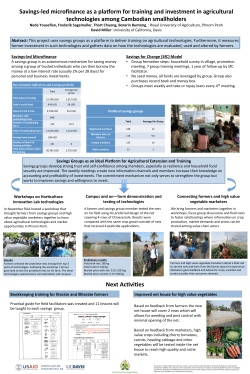
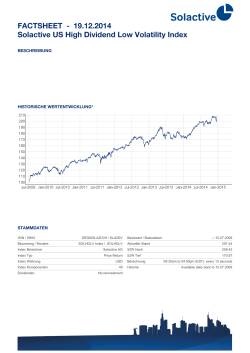
We know how energy works
Natural Gas Market Review and Outlook
For the week ended January 30, ’15
Week-to-Week Natural Gas Price Activity ⇓
Main factors driving natural gas prices: Natural gas prices on NYMEX continued to fall
throughout the week with forecasts still showing milder conditions in the eastern USA starting midFebruary. Prices were pushed further down after the EIA reported the latest weekly withdrawal from
storage which was smaller than expected. Despite the likely the arrival of milder weather in the eastern
USA as the month progresses, there remains a slight risk of unusually cold weather occurring in the
northeastern USA between February 10 and 16, 2015.
NYMEX prices for week starting Feb. 2, ’15 (USD / MMBtu): Prices for Mar. ’15 and Summer ’15
(Apr. - Oct.) are not likely to exceed $2.98. Price for rest of ’15 (Mar. - Dec.) is not likely to exceed $3.01
(all projections are at 90% confidence and based on closing prices and volatilities for Jan. 30, ’15).
AECO prices for week starting Feb. 2, ’15 (CAD / GJ): Price for Mar. ’15 is not likely to exceed
$2.78. Price for Summer ’15 (Apr. - Oct.) is not likely to exceed $2.71. Price for rest of ’15 (Mar. - Dec.) is
not likely to exceed $2.79 (all projections are at 90% confidence and based on closing prices and
volatilities for Jan. 30, ’15) (N.B. Contract for delivery in Feb. ’15 expires on Jan. 31, ’15).
NYMEX Prices
USD/MMBtu
01/30/15
01/23/15
% Change
AECO Prices
CAD/GJ
01/30/15
01/23/15
% Change
Prompt-Month
(Mar. '15)
$2.69
$2.96
-9%
Prompt-Month
(Feb. '15)
$2.52
$2.71
-7%
Summer '15
(Apr. - Oct.)
$2.78
$3.01
-8%
Winter '14-'15
(Feb. - Mar.)
$2.52
$2.70
-7%
Winter '15-’16
(Nov. - Mar.)
$3.13
$3.32
-6%
Summer '15
(Apr. - Oct.)
$2.53
$2.68
-5%
Gas Year '15-'16
(Nov. - Oct.)
$3.20
$3.35
-5%
Gas Year '15-'16
(Nov. - Oct.)
$2.98
$3.07
-3%
Gas Year '16-'17
(Nov. - Oct.)
$3.52
$3.59
-2%
Gas Year '16-'17
(Nov. - Oct.)
$3.34
$3.33
0%
All prices are settlement prices
Settlement Prices at NYMEX
Settlement Prices at AECO
USD/MMBtu
CAD/GJ
3.75
3.75
3.50
3.50
3.25
3.25
3.00
3.00
2.75
2.75
2.50
2.50
2.25
01/23/15
01/26/15
01/27/15
Prompt-Month (Mar. '15)
Sources: Aegent, NYMEX
01/28/15
Gas-Year '15-'16
01/29/15
01/30/15
Gas-Year '16-'17
2.25
01/23/15
01/26/15
01/27/15
Prompt-Month (Feb. '15)
01/28/15
Gas-Year '15-'16
01/29/15
01/30/15
Gas-Year '16-'17
Sources: Aegent, NGX
This report is based on interpretation by Aegent Energy Advisors Inc. of publicly available data and is provided for informational purposes only. Aegent Energy Advisors Inc. is
not acting as a fiduciary or financial advisor to clients or recipients. The information does not constitute advice, assurance, guarantee or representation whatsoever as to the
outcome of any course of action.
Aegent Energy Advisors Inc. makes no representation or warranties, express or implied, regarding the accuracy, reasonability or completeness of the information, assumptions or analysis contained in this report and its attachments. Aegent Energy Advisors Inc. accepts no liability in connection therewith, and nothing contained herein should be
considered financial or other advice.
© 2015 Aegent Energy Advisors Inc.
We know how energy works
Working Natural Gas in Underground Storage (USA)
Bcf
Fundamentals
4,000
Natural gas: The EIA reported a net withdrawal
from storage of 94 Bcf for the week ended Jan. 23, ’15,
decreasing total storage to 2,543 Bcf which is 14.6%
above last year’s level and 3% below the 5-year
average. This change was below the market’s
expectations for a net withdrawal of 113 Bcf. BakerHughes reported that the weekly US natural gas rig
count as of Jan. 30, ’15 was 319 compared to 316 as of
Jan. 23, ’15.
3,000
3,500
Crude oil: The price of the prompt-month contract
climbed from $45.59 US / bbl as of Jan. 23, ’15 to
$48.24 US / bbl as of Jan. 30, ’15. Crude oil prices
recovered somewhat at week’s end. A strong rally
occurred on Jan. 30, ’15 on news that ISIS had
attacked the Iraqi city of Kirkuk which is an important
center for the country’s oil production.
2,500
2,000
1,500
1,000
500
Nov '14
Jan '15
Sources:
Aegent, EIA
Mar '15
May '15
Jul '15
Sep '15
Max. / Min. (Past 5 years)
Average (Past 5 years)
Actual
Projected
Storage Surplus / (Deficit) from 5 Yr. Avg. vs.
Weekly Avg. NYMEX Near-Month Price (USA)
Bcf
USD/MMBtu
1,200
8
900
7
600
6
300
5
0
4
-300
3
-600
2
-900
1
-1,200
01/23/13
05/23/13
09/23/13
01/23/14
05/23/14
09/23/14
0
01/23/15
Current Surplus (Deficit) vs. 5-yr. Avg.
Sources: Aegent,
EIA, NYMEX
Weekly Avg. NYMEX N-M Price
Rigs Drilling for Natural Gas in USA
500
450
400
350
300
US Natural Gas in Storage (Bcf) (Source: EIA)
250
.
200
150
Week ended
01/23/15
This
year
Year
ago
5-year
average
100
50
0
01/30/13
05/30/13
09/30/13
01/31/14
05/31/14
09/30/14
Source: Baker Hughes
Net change
Gas in storage
-94
-219
-168
2,543
2,219
2,622
US Petroleum Stockpiles (MMbbl) (Source: EIA)
Energy Equivalent Price
Natural Gas vs. Crude Oil
USD/MMBtu
20
16
12
Week ended
01/23/15
Crude oil
Distillate (incl. heating oil)
This
year
Week
ago
Year
ago
406.7
397.9
357.6
132.7
136.6
116.2
8
4
0
01/30/13
05/30/13
09/30/13
01/31/14
NYMEX Near-Month Natural Gas
05/31/14
09/30/14
NYMEX Near-Month Crude Oil
Sources: Aegent, NYMEX
This report is based on interpretation by Aegent Energy Advisors Inc. of publicly available data and is provided for informational purposes only. Aegent Energy Advisors Inc. is
not acting as a fiduciary or financial advisor to clients or recipients. The information does not constitute advice, assurance, guarantee or representation whatsoever as to the
outcome of any course of action.
Aegent Energy Advisors Inc. makes no representation or warranties, express or implied, regarding the accuracy, reasonability or completeness of the information, assumptions or analysis contained in this report and its attachments. Aegent Energy Advisors Inc. accepts no liability in connection therewith, and nothing contained herein should be
considered financial or other advice.
© 2015 Aegent Energy Advisors Inc.
We know how energy works
Prompt-Month Closing Prices and Moving Averages
Technicals
5.00
4.50
Indicators are neutral to bearish for the short-run.
The latest closing price of the prompt-month contract
($2.691 US / MMBtu) is below the 5–, 10– and 20–
day EMAs (Exponential Moving Average). Moving
Average Convergence-Divergence is set to give signal
to sell by next week if current descent continues.
Relative Strength Indicator (RSI) is slightly bearish
while Fast Stochastic is strongly bearish but also
suggests overselling. Resistance for the coming week
may be near 20-day EMA ($2.97 US / MMBtu as of
Jan. 30, ’15). Prompt-month contract has broken
previous support near previous lowest closing price
of 2015 to date ($2.87 US / MMBtu). New support
may occur at weekly support level near $2.50 US /
MMBtu.
4.00
3.50
3.00
2.50
Sources:
Aegent,
NYMEX
NYMEX Prompt-Month Closing Price (USD/MMBtu)
5-day EMA (USD/MMBtu)
10-day EMA (USD/MMBtu)
20-day EMA (USD/MMBtu)
Moving Average Convergence-Divergence
0.30
0.20
0.10
0.00
-0.10
-0.20
-0.30
Source:
Aegent
NYMEX Natural Gas Total Speculative Positions
(FUTURES ONLY)
# of Contracts
Differential
MACD (12,26)
Signal (MACD (9))
Relative Strength Indicator
100.00
USD/MMBtu
25,000
9.00
90.00
0
8.00
80.00
(25,000)
7.00
70.00
(50,000)
6.00
60.00
(75,000)
5.00
(100,000)
4.00
(125,000)
3.00
(150,000)
2.00
(175,000)
1.00
(200,000)
Jan-13 Apr-13
50.00
40.00
30.00
20.00
10.00
0.00
0.00
Jul-13
Oct-13 Jan-14 Apr-14
Total Speculative Positions
Jul-14
Oct-14
NYMEX Prompt-Month Price
RSI (14)
Source: Aegent
Sources: CFTC, NYMEX
Speculative Positions on NYMEX
Natural Gas Futures (Source: CFTC)
Fast Stochastic
100.00
As of
01/27/15
This
Week
Week
ago
Total Open Interest
1,000,469
1,019,571
40.00
Net Position - Total
(197,878)
(182,234)
20.00
Net Position - Large
Speculators
(228,854)
(209,501)
Note: Brackets denote net short position
80.00
60.00
0.00
Source: Aegent
%K (14)
%D (3)
This report is based on interpretation by Aegent Energy Advisors Inc. of publicly available data and is provided for informational purposes only. Aegent Energy Advisors Inc. is
not acting as a fiduciary or financial advisor to clients or recipients. The information does not constitute advice, assurance, guarantee or representation whatsoever as to the
outcome of any course of action.
Aegent Energy Advisors Inc. makes no representation or warranties, express or implied, regarding the accuracy, reasonability or completeness of the information, assumptions or analysis contained in this report and its attachments. Aegent Energy Advisors Inc. accepts no liability in connection therewith, and nothing contained herein should be
considered financial or other advice.
© 2015 Aegent Energy Advisors Inc.
We know how energy works
Temperature Outlooks: Feb. 8 - 16, ’15
Weather (maps courtesy of NOAA)
NOAA reports that total Gas Home Heating Degree
Days in the US for the week ended Jan. 31, ’15 was
200. The norm for this time of year is 220. For the
period Oct. 5, ’14 — Jan. 31, ’15, cumulative total
Gas Home Heating Degree Days stand at 2,624.
The 30-year cumulative average (1971-2000) for
the same period is 2,749.
For the upcoming week, NOAA forecasts Gas Home
Heating Degree Days to be 225. The norm for this
period is 214.
For the week ended Jan. 30, ’15, Heating Degree
Days in Ontario are estimated to be 185. The 5-year
average for this period is 174. For the period Oct. 4,
’14 — Jan. 30, ’15, estimated cumulative total
Heating Degree Days is 2,159. The average
cumulative total of the past 5 years for the same
period is 2,053.
About Aegent
Aegent Energy Advisors Inc. provides
independent advice and support services to buyers
of natural gas and electricity to help them reduce
energy costs, manage energy cost risk, and resolve
the complexity of the energy marketplace. Aegent’s
processes for energy procurement and advisory
services operate within a Quality Management
System that is registered to ISO 9001:2008. Visit
us on the web: www.aegent.ca
Gas Home Heating Degree Days (GHHDD) in USA
(total per week, customer-weighted)
GHHDD
300
250
200
150
100
50
John Voss, President
416-622-9449 x 102
[email protected]
Frank Brennan, Senior Consultant
416-622-9449 x 109
[email protected]
0
10/11/14
11/11/14
12/11/14
01/11/15
02/11/15 03/11/15
04/11/15
05/11/15
Max. / Min. of last 5 years
Norm (Hist. Avg. 1971-2000)
Current
Year Ago
Sources: Aegent, NOAA
Estimated Heating Degree Days (HDD) in Ontario
(total per week - population-weighted)
HDD
250
200
Mike Risavy, Consultant
416-622-9449 x 111
[email protected]
Peter Chong, Energy Markets Analyst
416-622-9449 x 115
[email protected]
150
100
50
0
10/10/14
11/10/14
Sources: Aegent,
Environment Canada,
Ontario Ministry of
Finance
12/10/14
01/10/15
02/10/15 03/10/15
04/10/15
05/10/15
Max. / Min. of last 5 years
Avg. of last 5 years
Current
Year Ago
This report is based on interpretation by Aegent Energy Advisors Inc. of publicly available data and is provided for informational purposes only. Aegent Energy Advisors Inc. is
not acting as a fiduciary or financial advisor to clients or recipients. The information does not constitute advice, assurance, guarantee or representation whatsoever as to the
outcome of any course of action.
Aegent Energy Advisors Inc. makes no representation or warranties, express or implied, regarding the accuracy, reasonability or completeness of the information, assumptions or analysis contained in this report and its attachments. Aegent Energy Advisors Inc. accepts no liability in connection therewith, and nothing contained herein should be
considered financial or other advice.
© 2015 Aegent Energy Advisors Inc.
© Copyright 2026 ExpyDoc