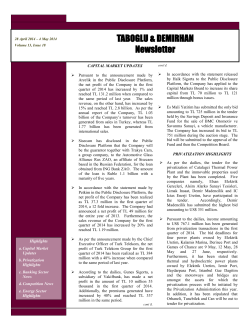
REPORT First quarter 2014 Yara International ASA – quarterly report • Strong result • Record deliveries with early spring in Europe • Lower commodity margins but robust value-added premiums • Record underlying Industrial result EARNINGS PER SHARE NOK 6.40 Yara reports a strong first-quarter result reflecting record deliveries. EBITDA (NOK millions) Earnings per share (NOK) 6,000 15 4,000 10 Debt/equity ratio 0.3 0.2 0.1 5 2,000 0.0 0 3Q12 4Q12 1Q13 2Q13 3Q13 4Q13 1Q14 0 3Q12 4Q12 1Q13 2Q13 3Q13 4Q13 1Q14 -0.1 3Q12 4Q12 1Q13 2Q13 3Q13 4Q13 1Q14 2 YARA FIRST QUARTER 2014 First quarter 2014 FINANCIAL HIGHLIGHTS 1Q 2014 1Q 2013 2013 21,709 2,268 191 3,591 3,830 1,773 6.40 6.25 7.03 277.1 11.8 % 11.4 % 20,697 2,817 439 4,184 4,149 2,257 8.04 8.61 8.52 280.6 17.0 % 18.8 % 85,092 8,074 1,076 13,399 13,834 5,759 20.67 23.20 24.80 278.6 12.6 % 12.6 % 1Q 2014 1Q 2013 2013 USD per ton USD per ton USD per ton USD per ton USD per ton 338 345 438 475 114 400 351 562 489 161 341 315 477 443 143 USD per MMBtu USD per MMBtu USD per MMBtu USD per MMBtu 9.7 5.2 8.1 11.3 6.09 11.1 3.5 8.3 11.5 5.63 10.6 3.7 8.0 11.4 5.87 Production (Thousand tons) 1) Ammonia Finished fertilizer and industrial products, excl. bulk blends Total 1,721 4,660 6,381 1,826 4,610 6,436 7,360 18,648 26,009 Sales (Thousand tons) Ammonia trade Fertilizer Industrial products 2) Total 447 6,405 1,537 8,390 651 5,297 1,463 7,412 2,203 23,668 6,255 32,126 NOK millions, except where indicated otherwise Revenue and other income Operating income Share net income equity-accounted investees EBITDA EBITDA excl. special items Net income after non-controlling interests Earnings per share 1) Earnings per share excl. currency 1) Earnings per share excl. currency and special items 1) Average number of shares outstanding (millions) CROGI (12-month rolling average) 2) ROCE (12-month rolling average) 1) NOK per share. Yara currently has no share-based compensation programs that result in a dilutive effect on EPS. 2) First-quarter 2014 CROGI excl. special items annualized 13.5%. KEY STATISTICS Average prices Urea prilled (fob Black Sea) CAN (cif Germany) Ammonia (fob Black Sea) DAP (fob US Gulf) Phosphate rock (fob Morocco) European gas (Zeebrugge) US gas (Henry Hub) Yara's gas & oil cost (weighted average) 1) Yara's European gas & oil cost (weighted average) 1) USD/NOK currency rate 1) Including Yara’s share in equity-accounted investees. 2) Including feed phosphates and CO2 as from 2014 reporting (2013 restated). Yara’s first-quarter net income after non-controlling interests was NOK 1,773 million, compared with NOK 2,257 million last year. Excluding net foreign exchange gain/loss and special items, the result was NOK 1,946 million, compared with NOK 2,391 million in first quarter 2013. The corresponding earnings per share were NOK 7.03 compared with NOK 8.52 last year. “Yara reports a strong first-quarter result reflecting record deliveries,” said Jørgen Ole Haslestad, President and Chief Executive Officer of Yara. “While global commodity nitrogen markets have been impacted by increased export supply from China, healthy demand in both Europe and Latin America has supported value-added premiums and generated a strong Yara performance,” said Jørgen Ole Haslestad. FERTILIZER MARKET CONDITIONS Fertilizer demand remains strong. Following declining food prices during 2013, particularly for grains, they have rebounded during the first quarter. The Food and Agriculture Organization of the United Nations (FAO) food price index for March was 5% up on January (6% higher than the five year average), while its cereal price index increased by 9% from January to March (March 4% lower than the five year average). Positive development in the dairy and meat sectors are explaining the relatively stronger food price index. The record projected production level for 2013/14 will bring ending stocks to a level corresponding to 74 days of consumption, the second lowest level over the last six seasons, and adding only 2 days of consumption to stocks. But the main driver for the grain price increase so far in 2014 is initial concerns about the size of the 2014/15 crop, with the cold winter and late spring in North America a major contributor. YARA FIRST QUARTER 2014 Although grain farmer margins are lower than a year ago, they are still supportive for fertilizer use, as commodity fertilizer prices also have declined. Demand for higher quality fertilizers like nitrates and NPKs remains strong, particularly for the cash crop, meat and dairy sectors where prices have seen a more positive development than for grains. A seasonal pickup in demand from major Northern Hemisphere markets pulled urea prices up from the pricing of second half of 2013. However, global urea prices were lower, mainly due to lower tax on Chinese urea exports and lower urea pricing in China than first quarter last year. During the quarter, China exported 2.0 million tons, up from 0.8 million tons same period last year. The average price at USD 338 per ton fob Black Sea compares to USD 314 per ton the previous quarter, and USD 400 per ton first quarter last year. As farmers in North America and Europe prefer granular urea, late and strong demand for spring application tends to expand the granular premiums. So also during the first quarter, when the key Egyptian benchmark averaged USD 414 per ton, 22% higher than the fob Black Sea price reference. The ammonia market has been supply-driven since mid-2013, making production curtailments necessary to balance the market. Reduced import demand from USA is the main factor causing the excess availability, and Ukraine has been the most important balancing player on the supply side. However, the balance improved sharply end February and prices were quickly driven up to the ceiling set by urea prices, around USD 500 per ton fob Black Sea at the end of the quarter. Phosphate fertilizer demand improved sharply compared to the previous quarter, and the average DAP price fob US Gulf for the quarter exceeded the previous quarter by 30%, almost matching first quarter 2013. Demand improved as buyers were reluctant to buy early for the main spring application on the Northern Hemisphere. Prices were also supported by the 15% tax on Chinese exports during the quarter. Higher DAP prices did not result in any significant increases in the prices of phosphate rock and phosphoric acid for the quarter, although some modest gains were achieved through the quarter. So upgrading margins from rock to DAP have increased significantly. REGIONAL MARKET DEVELOPMENTS First-quarter nitrogen fertilizer deliveries in Western Europe were up 11% on last year, with stable imports. Season-to-date deliveries are up 5% on last season, with imports up 4%. The increase in deliveries is likely a phasing effect, rather than an increase in underlying demand. A significant share of the early deliveries were consumed last summer due to the late spring last season, while spring this year has arrived early. First-quarter US nitrogen deliveries were down an estimated 16% from a year earlier, due to lower imports of both ammonia and urea. Season to date, deliveries are estimated to be 13% lower than last season. Despite some more nitrogen in inventories at the start of the season, and the expected drop in corn acreage this year, the nitrogen markets in North America are and have been very tight, resulting in strong relative urea pricing for the quarter. In India, urea sales increased by 1% for the 2013/14 agricultural year, with a similar increase in domestic production. Imports were lower as stocks were drawn down, resulting in low urea stocks in India at the end of first quarter. During the quarter, urea production in China was 4% higher than last year. Despite capacity growth significantly exceeding this, poor margins for the highest cost producers resulted in production curtailments. The average domestic urea price for first quarter was 22% lower than last year. In Brazil, total fertilizer deliveries for the first quarter were 6.0 million tons, up 11% on last year, supported by improved agricultural commodity prices. Urea imports were 0.9 million tons, same as last year. VARIANCE ANALYSIS FIRST QUARTER NOK millions EBITDA 2014 EBITDA 2013 Variance EBITDA Volume & mix Price/margin Oil & gas costs in Europe Special items Other Translation NOK vs. USD 1) Total variance explained 1Q 2014 3,591 4,184 (593) 610 (978) 36 (274) (327) 340 (593) 1) Based on average NOK per USD for the quarter 2014: 6.09 (2013: 5.63) Yara delivered strong first-quarter results, but EBITDA excluding special items decreased by 8% as strong deliveries were more than offset by lower commodity fertilizer margins. The volume, margin and other variances presented in the Yara variance table include effects generated by performance in equity-accounted investees. Net income from equity-accounted investees decreased by NOK 249 million compared with first quarter 2013, primarily due to lower results in Lifeco due to production stop and in Qafco mainly as a result of lower sales volumes. Volume development Yara’s global fertilizer deliveries were up 21% on first quarter last year, with strong demand for most products in all markets in addition to the effect of the acquisition of Bunge. Excluding volumes to Brazil, global Yara fertilizer deliveries were up 11% compared with first quarter 2013. An early spring has contributed to strong demand in Europe, resulting in 8% higher deliveries compared to same quarter last year. Deliveries outside Europe excluding Brazil were up 17% with growth in North America and Africa while Asia saw profitable growth in NPK offset by reduced commodity product deliveries. Sales outside Europe were limited by supply constraints on nitrates. In general there has been a tight supply/demand balance on all own-produced products. Brazil volumes are progressing well, supported by higher market growth than anticipated. Yara deliveries to Brazil were 1.3 million tons vs. 0.7 million tons in first quarter 2013. Global Yara nitrate deliveries were up 8% compared to first quarter 2013. This growth was primarily driven by the early spring in Europe with an increase in deliveries of 12%. Compound NPK deliveries increased 14%, with growth across all regions. In Europe the increased deliveries followed the same pattern as for nitrates, but in addition there was a catchup of a 3 4 YARA FIRST QUARTER 2014 slow start in the beginning of the season. Urea deliveries were down 3% compared to first quarter 2013 due to low import availability for Europe and reduced deliveries to Asia and Africa partially offset by strong deliveries in North America and Brazil. Calcium nitrate deliveries increased by 7% compared with first quarter 2013 driven by growth in most Yara markets, despite reduction in North America. Margin development Yara stocks are up 11% compared with the end of first quarter 2013 including the effect of Bunge. Excluding Brazil, stocks are down 12%, mainly driven by the strong deliveries to Europe, but also inventory reductions in North America. The stocks are particularly low on nitrates, with significantly lower inventory levels than at the same time last year. Compared to year-end 2013, total Yara stocks are down 4%. Industrial margins generally benefited from lower raw material sourcing costs compared with first quarter 2013, contributing to a record underlying result. Chemicals margins increased compared with last year due to reallocation of products toward higher paying segments. Air1 margins increased both in Europe and North America due to higher demand and lower logistics costs. Industrial sales volumes increased by 5% compared with first quarter 2013. Sales of NOx abatement products for automotive, Air1, were 29% ahead due to rapid market development in the US and steady growth in Europe. Stationary NOx abatement products sales were 9% below last year due to lower operating rates at coal-fired power plants in Europe. Sales of technical urea, nitric acid and ammonia to the process industry were up 8% as the demand for process intermediaries continued to develop positively in Europe. CO2 sales were 4% above last year. Sales of Technical ammonium nitrate (TAN) and industrial nitrates products were in line with last year. Yara’s average European gas and oil cost was 1% below first quarter 2013 on a USD per MMBtu basis, and slightly better than Yara’s guidance. There were no significant changes in average spot gas prices and oil-linked prices compared with last year, using a one month time lag in the pricing. Yara also benefitted from the conversion from oil to gas in Brunsbuttel and the renegotiated gas contract in Ferrara. Yara’s global average oil and gas cost decreased 2% on a USD per MMBtu basis as ammonia-linked gas cost decreased, partly offset by increased North American gas prices. Yara’s ammonia production faced a challenging first quarter and volumes decreased by 6% compared with last year. The Tertre ammonia plant went out of operation mid-January due to a fire. To minimize production losses a planned turnaround was moved forward and production was first resumed mid-April. At the Lifeco plant in Libya a controlled shut-down was carried out mid-January due to a local militia blocking the site. The blockade lasted until beginning of April and the ammonia production has resumed. Qafco production was also lower than last year due to a scheduled turnaround. The lower ammonia volumes from the mentioned plants were partly offset by increased production from plants that saw maintenance stops last year. Finished fertilizer production was 1% above first quarter 2013, mainly as a result of increased production in Brazil. Urea production was impacted by the outages in the ammonia plants and saw a 2% decrease. Nitrates were in line with last year as production losses in Tertre were offset by increased volumes from Ince, with maintenance stop last year, and change in product portfolio for other plants. Other product groups saw smaller volume increases, with the exception of an almost 70% increase in Brazilian SSP production. Ammonia market prices decreased by 22%, while Yara’s average realized urea prices were 13% lower than in first quarter 2013. Realized nitrate and NPK compound prices reduced less, decreasing by 12% and 10%, respectively, keeping premiums over urea and other commodity fertilizers stable overall, while NPK blend margins in Brazil were higher than last year. Other items Total special items were a net negative NOK 239 million, primarily related to the negative result in Libya where the production has been suspended since mid-January after local militia blocked access to the site. There were also integration and acquisition costs in connection to the acquisitions of Bunge’s fertilizer business in Brazil and OFD in Latin America, in addition to a partner settlement provision and negative effects from contract derivatives. Integration costs related to Bunge were USD 5 million in first quarter, which was lower than expected, with a further USD 8 million expected in the next two quarters. First-quarter 2013 special items were a net positive NOK 35 million, reflecting contract derivatives. For further details on special items see pages 9 and 10. The major part of the “Other” variance is related to increased fixed costs, primarily due to the inclusion of Bunge’s fertilizer business in Brazil and other growth related activities. The US dollar was approximately 8% stronger versus the Norwegian krone compared with first quarter 2013, resulting in a positive translation effect in Yara’s results. YARA FIRST QUARTER 2014 PRODUCTION VOLUMES 1) Thousand tons 1Q 2014 Ammonia of which equity-accounted investees 1,721 308 Urea of which equity-accounted investees 1,168 of which equity-accounted investees 1,191 1,520 NPK 1,520 1,248 CN UAN SSP-based fertilizer Total production 1) 4,840 1,616 68 63 7,360 1,488 426 100 2013 1,826 373 332 Nitrate of which equity-accounted investees 1Q 2013 6,224 361 1,244 11 330 258 137 6,381 4,646 181 326 248 81 6,436 1,199 1,081 659 26,009 1) Including Yara share of production in equity-accounted investees. Tringen is from 2014 classified as “Joint operations” in line with IFRS 11, and is not any longer included as equity-accounted investee. 2013 has been restated accordingly. SALES VOLUMES Thousand tons 1Q 2014 Ammonia of which industrial products 1) 650 171 Urea of which fertilizer 1Q 2013 869 169 1,553 1,248 2013 3,050 669 1,611 1,282 6,741 5,494 of which Yara-produced fertilizer 539 448 1,923 of which Yara-produced industrial products 2) 265 287 1,123 of which equity-accounted investees 574 Nitrate 698 1,742 3,100 1,650 6,489 of which fertilizer 1,569 1,454 5,699 of which Yara-produced fertilizer 1,458 1,356 5,243 136 167 of which Yara-produced industrial products NPK of which Yara-produced compounds of which Yara-produced blends 2,330 1,351 1,199 867 CN 649 1,611 326 353 8,190 4,411 3,532 332 1,323 of which fertilizer 279 261 986 of which Yara-produced fertilizer 277 257 971 67 65 of which Yara-produced industrial products UAN of which Yara-produced fertilizer 418 393 DAP/MAP MOP/SOP Other products of which industrial products 3) Total sales 309 316 296 149 125 1,070 815 1,290 1,196 70 81 873 698 377 596 4,071 3,213 8,390 7,412 32,126 1Q 2014 1Q 2013 2013 3,110 1,583 929 482 300 6,405 2,892 923 800 484 198 5,297 10,199 6,900 3,265 2,279 1,026 23,668 1) 82% ammonia equivalents. 2) 46% urea equivalents. 3) Including feed phosphates and CO2 as from 2014 reporting (2013 restated). FERTILIZER VOLUMES BY REGION Thousand tons Europe Latin America North America Asia Africa Total For a description of the key global fertilizer products, see the Yara Fertilizer Industry Handbook: http://www.yara.com/investor relations/report presentations/index.aspx 5 6 YARA FIRST QUARTER 2014 FINANCIAL ITEMS NOK millions Interest income from customers Interest income, other Interest income and other financial income Interest expense Net interest expense on net pension liability Net foreign exchange gain/(loss) Other Interest expense and foreign exchange gain/(loss) Net financial income/(expense) First-quarter net financial expense was NOK 52 million compared with NOK 293 million in 2013. The variance primarily reflects a net foreign exchange gain this quarter of NOK 78 million compared with a loss of NOK 218 million in the same quarter last year. Interest income from customers increased with NOK 43 million compared with first quarter 2013, mainly due to the expansion in Brazil. Other interest income decreased by NOK 18 million as average cash deposits were NOK 4.5 billion lower than last year. The cash has mainly been kept as bank deposits in Norwegian kroner. Interest expense was NOK 29 million above first quarter 2013 amid somewhat higher average interest rates and an average USD/NOK rate around 8% higher. Average gross debt was at almost the same level as in first quarter 2013. 1Q 2014 1Q 2013 73 37 110 30 55 86 (191) (17) 78 (31) (161) (162) (21) (218) 23 (378) (52) (293) Net foreign exchange gain was NOK 78 million as the US dollar depreciated against most of Yara’s main currencies. Yara’s US dollar debt generating currency effects in the income statement was approximately USD 1,000 million at the end of the quarter, with the exposure mainly towards the euro and the Brazilian real. TAX First-quarter provisions for current and deferred taxes were NOK 524 million, approximately 22% of income before tax. The tax rate was higher than for first quarter 2013 (approximately 20%) mainly due to lower share of earnings from equity-accounted investees. YARA FIRST QUARTER 2014 NET INTEREST-BEARING DEBT 1Q 2014 NOK millions Net interest-bearing debt at beginning of period Cash earnings 1) Dividends received from equity-accounted investees Net operating capital change Other investments (net) Foreign exchange gain/(loss) Other Net interest-bearing debt at end of period (3,333) 2,473 552 (506) (1,772) 78 (83) (2,591) 1) Operating income plus depreciation and amortization, minus tax paid, net gain/(loss) on disposals, net interest expense and bank charges. As a supplement to the consolidated statement of cash flows (page 16), this table highlights the key factors behind the development in net interest-bearing debt. Net interest-bearing debt ended at NOK 2,591 million in the first quarter, compared with NOK 3,333 million at the end of 2013. Strong cash earnings and dividends from equity-accounted investees exceeded capital expenditure. Yara received dividend from equity-accounted investees of NOK 552 million in first quarter, of which dividend from Qafco amounted to NOK 547 million. Net operating capital increased by NOK 506 million due to higher receivables reflecting strong deliveries. The investment activity for the quarter mainly reflects planned maintenance programmes and growth investments, including NOK 158 million in the Yara Pilbara Nitrates joint venture TAN plant construction. Yara completed three small acquisitions in the quarter totalling NOK 293 million. The debt/equity ratio at the end of first quarter 2014, calculated as net interest-bearing debt divided by shareholders’ equity plus noncontrolling interests, was 0.05 compared with 0.06 at the end of fourth quarter 2013. 7 8 YARA FIRST QUARTER 2014 Outlook The global farm margin outlook and incentives for fertilizer application have improved in recent months, as both current and forward food prices have increased. The FAO food price index is up during the quarter, with increases for all main product groups except meat which is stable at record levels. Grassland for meat and dairy production represents Yara’s secondlargest fertilizer sector in Europe, after cereals. The US Department of Agriculture estimates that global grain stocksto-use will increase to 74 days during the 2013/14 season, as improved weather conditions and strong fertilizer application increase agricultural productivity. However, apart from last year, the estimated 74 days global grain supply represents the lowest level since 2008. Global nitrogen demand was strong during the first quarter, reflecting seasonally strong northern hemisphere demand, including an early spring in Europe. However, urea prices declined from mid-February, reflecting continued strong supply from China. The Chinese urea export tax is according to official information at RMB 40 per ton plus 15% until 1 July, after which it reduces to RMB 40 per ton until 1 November when it returns to RMB 40 per ton plus 15%. Exports are taking place below USD 300 per ton fob China, indicating lower production costs than in 2013, and perhaps also temporary effects as port stocks are liquidated. It is also possible that export taxes are not being fully applied, as seen also in first half 2013. Going forward, urea exports for second-half delivery will provide a better indication of underlying production costs, as the export tax uncertainty is removed. Lower anthracite coal prices in China remain a negative risk element for global commodity nitrogen prices longer term, however for other domestic cost elements such as labour and freight the risks are arguably more on the upside. Furthermore, port loading capacity can represent a bottleneck during peak export months. Apart from two projects in Algeria with uncertain timing, there are limited greenfield capacity additions outside China scheduled for completion in the next 2 years. In Ukraine, it is so far unclear to what extent recently announced gas price increases will impact local nitrogen producers. The urea curtailments seen so far appear to be in response to relatively stronger ammonia prices and production margins. Nitrogen fertilizer industry deliveries in Western Europe have recovered from a slow start to the new season, with first-quarter deliveries 11% higher than a year ago and season-to-date deliveries up 5% from a year ago. Although the early spring has pulled ahead some demand from second to first quarter, strong farm margins and tight supply in particular for nitrates indicate a positive European nitrogen market situation also for the second quarter. Yara has a strong European order book for the remainder of the season. Yara’s value-added nitrate and NPK products continue to deliver strong and stable volumes and margins, which are relatively less exposed to swings in commodity nitrogen, phosphate and potash markets. However, the recent improvement in phosphate demand and prices has a positive impact also on NPK margins. At the Lifeco plant in Marsa el Brega, Libya, a controlled shut-down was carried out in January due to a local militia blocking the site. The blockade was lifted in early April, allowing Yara to re-start production at the plant. Growth in Latin America remains a key focus area for Yara in 2014. The integration of the former Bunge fertilizer business in Brazil is complete, with minium USD 50 million annual synergies expected to be realized in 2014. Yara’s acquisition of OFD (Colombia) is expected to be completed in third quarter 2014, with integration preparations underway using resources and experience from the Bunge integration project. Yara’s increased presence in Latin America strengthens its positioning for future growth, and further reduces the seasonality in its global business. Lower prices and margins saw some of Yara’s commodity nitrogen plants come close to curtailment in the fourth quarter. Lower European natural gas prices have recently improved the relative competitiveness of European ammonia/urea plants, but Yara will continue to evaluate the need for temporary or permanent capacity curtailments on an on-going basis, linked to both market price developments and investment decisions. Improving cost efficiency throughout the business is another key focus area for Yara in 2014. Based on current forward markets for oil products and natural gas (22 April) Yara’s second-quarter European energy costs are expected to be NOK 600 million lower than last year. Third-quarter 2014 European energy costs are expected to be NOK 450 million lower than a year earlier. The estimates may change considerably depending on future energy prices. Yara’s European oil and gas exposure is approximately 90% spot gas and 10% spot oil products. The Board of Directors and Chief Executive Officer Yara International ASA Oslo, 29 April 2014 Bernt Reitan Chairperson Hilde Merete Aasheim Board member Elisabeth Harstad Board member Geir Isaksen Board member Juha Rantanen Board member Rune Bratteberg Board member Guro Mauset Board member Geir O.Sundbø Board member Jørgen Ole Haslestad President and CEO YARA FIRST QUARTER 2014 Definitions and variance analysis The fertilizer season in West Europe referred to in this discussion starts 1 July and ends 30 June. Several of Yara’s purchase and sales contracts for commodities are, or have embedded terms and conditions which under IFRS are, accounted for as derivatives. The derivative elements of these contracts are presented under “Commodity-based derivatives gain/(loss)” in the condensed consolidated interim statement of income, and are referenced in the variance analysis (see below) as “Special items”. “Other and eliminations” consists mainly of cross-segment eliminations, in addition to Yara’s headquarter costs. Profits on sales from Upstream to Downstream and Industrial are not recognized in the consolidated Yara condensed consolidated interim statement of income before the products are sold to external customers. These internal profits are eliminated in “Other and eliminations”. Changes in “Other and eliminations” EBITDA therefore usually reflect changes in Upstream-sourced stock (volumes) held by Downstream and Industrial, but can also be affected by changes in Upstream margins on products sold to Downstream and Industrial, as transfer prices move in line with arms-length market prices. With all other variables held constant, higher stocks would result in a higher (negative) elimination effect in Yara’s results, as would higher Upstream margins. Over time these effects tend to even out, to the extent that stock levels and margins normalize. In the discussion of operating results, Yara refers to certain non-GAAP financial measures including EBITDA and CROGI. Yara’s management makes regular use of these measures to evaluate the performance, both in absolute terms and comparatively from period to period. These measures are viewed by management as providing a better understanding - both for management and for investors – of the underlying operating results of the business segments for the period under evaluation. Yara manages long-term debt and taxes on a group basis. Therefore, net income is discussed only for the Group as a whole. Yara’s management model, referred to as Value Based Management, reflects management’s focus on cash flow-based performance indicators. EBITDA, which Yara defines as income/(loss) before tax, interest expense, foreign exchange gains/losses, depreciation, amortization and write-downs, is an approximation of cash flow from operating activities before tax and net operating capital changes. EBITDA is a measure that in addition to operating income, also includes interest income, other financial income, and results from equity-accounted investees. It excludes depreciation, write-downs and amortization, as well as impairment and amortization of excess values in equity-accounted investees. Yara’s definition of EBITDA may differ from that of other companies. EBITDA should not be considered as an alternative to operating income and income before tax as an indicator of the company’s operations in accordance with generally accepted accounting principles. Nor is EBITDA an alternative to cash flow from operating activities in accordance with generally accepted accounting principles. Yara management uses CROGI (Cash Return On Gross Investment) to measure performance. CROGI is defined as gross cash flow, divided by average gross investment and is calculated on a 12-month rolling basis. “Gross cash flow” is defined as EBITDA less total tax expense, excluding tax on net foreign exchange gains/ losses. On Yara level, actual tax expense is used for the calculation while a standardized tax rate of 25% is used on segment level. “Gross Investment” is defined as total assets (exclusive of deferred tax assets, cash and cash equivalents, other liquid assets and fair value adjustment recognized in equity) plus accumulated depreciation and amortization, less all short-term interest-free liabilities, except deferred tax liabilities. On segment level, cash and other liquid assets are not excluded from “Gross Investment”. ROCE (Return on capital employed) has been included as an additional performance measure to CROGI to simplify benchmarking with other companies. ROCE is defined as EBIT minus tax divided by average capital employed and is calculated on a 12-month rolling average basis. Capital employed is defined as total assets adjusted for deferred tax assets minus other current liabilities. In order to track underlying business developments from period to period, Yara’s management also uses a variance analysis methodology, developed within the Company (“Variance Analysis”), that involves the extraction of financial information from the accounting system, as well as statistical and other data from internal management information systems. Management considers the estimates produced by the Variance Analysis, and the identification of trends based on such analysis, sufficiently precise to provide useful data to monitor our business. However, these estimates should be understood to be less than an exact quantification of the changes and trends indicated by such analysis. The variance analysis presented in Yara quarterly and annual financial reports is prepared on a Yara EBITDA basis including net income from equity-accounted investees. The volume, margin and other variances presented therefore include effects generated by performance in nonconsolidated investees. Yara defines “special items” as material items in the results which are not regarded as part of underlying business performance for the period. These fall into 2 categories, namely “non-recurring items” and “contract derivatives”. “Non-recurring items” comprise restructuring-related items and other gains or losses which are not primarily related to the period in which they are recognized, subject to a minimum value of NOK 20 million per item within a 12-month period. “Contract derivatives” are commodity-based derivatives gains or losses (see above) which are not the result of active exposure or position management by Yara. Due to it being impractical to obtain financial reports at the same reporting dates as Yara uses, the results for some of Yara’s equity-accounted investees are included in Yara results with a one-month time lag. 9 10 YARA FIRST QUARTER 2014 Special items EBITDA effect NOK millions Bunge integration costs Partner settlement provision OFD acquisition and integration costs Total Downstream Total Industrial Libya costs Contract derivatives Total Upstream Total Other and eliminations Total Yara 1Q 2014 (30) (48) (18) (96) (90) (53) (143) (239) Operating income effect 1Q 2013 - 1Q 2014 (30) (48) (18) (96) 1Q 2013 - - - - 35 35 (53) (53) 35 35 35 (148) 35 YARA FIRST QUARTER 2014 Condensed consolidated interim statement of income NOK millions, except share information Revenue Other income Commodity based derivatives gain/(loss) Revenue and other income Notes 3 3 3 Raw materials, energy costs and freight expenses Payroll and related costs Depreciation, amortization and impairment loss Other operating expenses Operating costs and expenses 1Q 2013 Restated 3) 2013 Restated 3) 21,763 4 (59) 21,709 20,617 41 39 20,697 84,668 119 305 85,092 (16,213) (1,518) (1,022) (688) (19,441) (15,284) (1,270) (842) (484) (17,879) (64,786) (5,454) (3,743) (3,036) (77,018) 1Q 2014 Operating income 3 2,268 2,817 8,074 Share of net income in equity-accounted investees Interest income and other financial income Earnings before interest expense and tax (EBIT) 3 3 3 191 110 2,568 439 86 3,342 1,076 414 9,563 3 78 (239) 2,407 (218) (160) 2,964 (949) (904) 7,711 Income tax expense Net income (524) 1,882 (605) 2,359 (1,602) 6,108 Net income attributable to Shareholders of the parent Non-controlling interests Net income 1,773 109 1,882 2,257 103 2,359 5,759 350 6,108 6.40 277,050,910 8.04 280,567,264 20.67 278,647,345 Foreign exchange gain/(loss) Interest expense and other financial items Income before tax Earnings per share 1) Weighted average number of shares outstanding 2) 1) Yara currently has no share-based compensation that results in a dilutive effect on earnings per share. 2) Weighted average number of shares outstanding was reduced in second, third and fourth quarter 2013 due to the share buy-back program. 3) See note 8 for more information. 11 12 YARA FIRST QUARTER 2014 Condensed consolidated interim statement of comprehensive income NOK millions 1Q 2014 1Q 2013 Restated 1) 2013 Restated 1) Net income 1,882 2,359 6,108 (919) (31) 49 9 (892) 1,527 30 (156) 2 1,403 4,851 26 (292) 70 4,655 (5) (5) (6) (6) 399 (90) 309 3 3 3 3 15 15 (894) 1,401 4,979 Total comprehensive income 989 3,760 11,087 Total comprehensive income attributable to Shareholders of the parent Non-controlling interests Total 912 77 989 3,576 184 3,760 10,572 514 11,086 Other comprehensive income that may be reclassified to profit or loss in subsequent periods: Exchange differences on translation of foreign operations Available-for-sale financial assets - change in fair value Hedge of net investments Share of other comprehensive income of equity-accounted investees, excluding remeasurements Net other comprehensive income that may be reclassified to profit or loss in subsequent periods Other comprehensive income that will not be reclassified to profit or loss in subsequent periods: Remeasurements of the net defined benefit pension liability Remeasurements of the net defined benefit pension liability for equity-accounted investees Net other comprehensive income that will not be reclassified to profit or loss in subsequent periods Reclassification adjustments of the period: - cash flow hedges Net reclassification adjustment of the period: Total other comprehensive income, net of tax 1) See note 8 for more information. YARA FIRST QUARTER 2014 Condensed consolidated statement of changes in equity Cash flow hedges Hedge of net investments Total other reserves Retained earnings 5 (255) 169 (2,886) 50,538 Premium paid-in capital 477 117 - - 477 117 Net income - - - - - Other comprehensive income, net of tax Share of other comprehensive income of equity-accounted investees Total other comprehensive income, net of tax - - 1,446 30 3 - - - - 2 - - 1,446 30 4 477 117 (1,359) 35 Net income - - - Other comprehensive income, net of tax Share of other comprehensive income of equity-accounted investees Total other comprehensive income, net of tax - - 3,240 - - 6 - - NOK millions Balance at 31 December 2012 as reported 2013 Implementation of revised IAS 28, restatement effect 3) Balance at 1 January 2013 restated 3) Long term incentive plan Dividends distributed Balance at 31 March 2013 restated 3) Long term incentive plan Transactions with non-controlling interests Treasury shares Redeemed shares, Norwegian State 2) Dividends distributed Balance at 31 December 2013 restated 3) (2) (4) 471 (2,805) 5 - (255) (251) - 169 (156) - (2,886) 1,323 471 117 1,002 - (1) 2,359 - 1,323 81 1,405 3,748 3,112 399 3,511 84 3,595 (136) - - - 3 49 68 (865) 4 - 7 49 (861) (74) 757 (170) 103 246 - (31) 2,257 3,502 - 1 2,257 3,502 1,618 (885) 49,339 - - (122) - 1,745 2 (85) 53,017 (177) - 47,594 (85) 1,844 30 - 49,886 2 51,173 1,887 - (652) 2 52,140 117 Total other comprehensive income, net of tax - (1,561) 3,180 (31) (652) 13 (136) (886) 49,991 1,319 74 - 1,745 (5) (4) - 48,246 1,324 3,246 Other comprehensive income, net of tax Total equity (156) 62 Share of other comprehensive income of equity-accounted investees Noncontrolling interests (5) 12 - (652) Attributable to the shareholders of the parent 1 - - 1) Par value 1.70. 2) As approved by General Meeting 13 May 2013. 3) See note 8 for more information. (2,805) (4) Net income Long term incentive plan Balance at 31 March 2014 Translation of foreign operations Availablefor-sale financial assets Share capital 1) 5 (84) 315 (4) (16) 3,495 81 84 (4) 1,401 (16) 3,578 (8) 17 (375) (529) (3,647) 51,415 (8) 17 (377) (533) (3,647) 53,621 (6) (16) 2,152 (8) 11 (377) (533) (3,663) 55,773 1,773 1,773 109 1,882 (1) (1) 3 53,191 (865) 4 (861) 3 54,536 (32) (32) 2,229 (898) 4 (894) 3 56,765 13 14 YARA FIRST QUARTER 2014 Condensed consolidated statement of financial position NOK millions 31 Mar 2014 31 Mar 2013 Restated 1) 31 Dec 2013 Restated 1) 1 Jan 2013 Restated 1) 1,983 8,432 34,232 8,880 1,563 55,090 1,239 7,737 29,212 8,676 1,425 48,289 1,984 8,419 34,611 9,361 1,549 55,923 1,409 7,512 28,594 9,069 1,437 48,022 6 13,089 10,923 3,435 6,770 8 34,224 12,848 9,858 2,622 12,285 3 37,616 13,129 9,339 3,378 6,824 8 32,679 12,003 8,086 2,635 10,015 11 32,750 3 89,314 85,905 88,602 80,772 Notes Assets Non-current assets Deferred tax assets Intangible assets Property, plant and equipment Equity-accounted investees Other non-current assets Total non-current assets Current assets Inventories Trade receivables Prepaid expenses and other current assets Cash and cash equivalents Non-current assets classified as held-for-sale Total current assets Total assets 1) See note 8 for more information. YARA FIRST QUARTER 2014 Condensed consolidated statement of financial position Notes NOK millions, except for number of shares 31 Mar 2014 31 Mar 2013 Restated 1) 31 Dec 2013 Restated 1) 1 Jan 2013 Restated 1) 471 117 588 477 117 594 471 117 588 477 117 594 Equity and liabilities Equity Share capital reduced for treasury stock Premium paid-in capital Total paid-in capital Other reserves Retained earnings Total equity attributable to shareholders of the parent 757 53,191 54,536 (1,561) 52,140 51,173 1,618 51,415 53,621 (2,886) 49,886 47,594 Non-controlling interests Total equity 2,229 56,765 1,844 53,017 2,152 55,773 1,745 49,339 Non-current liabilities Employee benefits Deferred tax liabilities Other long-term liabilities Long-term provisions Long-term interest-bearing debt Total non-current liabilities 2,280 4,326 579 397 5,784 13,366 2,374 4,362 681 426 8,933 16,776 2,339 4,423 569 398 5,833 13,562 2,427 4,444 659 407 9,287 17,224 Current liabilities Trade and other payables Current tax liabilities Short-term provisions Other short-term liabilities Bank loans and other interest-bearing short-term debt Current portion of long-term debt Total current liabilities 13,088 1,329 434 754 445 3,134 19,183 12,000 1,797 237 819 523 736 16,112 11,961 1,407 458 1,114 500 3,826 19,266 9,838 1,932 230 686 520 1,004 14,209 Total equity and liabilities 89,314 85,905 88,602 80,772 277,050,910 280,567,264 277,050,910 280,567,264 7 Number of shares outstanding 2) 2 1) See note 8 for more information. 2) Weighted average number of shares outstanding was reduced in second, third and forth quarter 2013 due to the share buy-back program.. The Board of Directors and Chief Executive Officer Yara International ASA Oslo, 29 April 2014 Bernt Reitan Chairperson Hilde Merete Aasheim Board member Elisabeth Harstad Board member Geir Isaksen Board member Juha Rantanen Board member Rune Bratteberg Board member Guro Mauset Board member Geir O. Sundbø Board member Jørgen Ole Haslestad President and CEO 15 16 YARA FIRST QUARTER 2014 Condensed consolidated statement of cash flows NOK millions Operating activities Operating income Notes 1Q 2014 1Q 2013 Restated 2) 2013 Restated 2) 3 2,268 2,817 8,074 1,022 16 (817) 552 (522) (123) 2,396 842 (27) (872) 1,119 (181) 319 4,017 (1,423) (293) (59) 3 1 (1,772) (899) (102) 12 202 (787) (672) (672) (931) (85) (1,016) 3,743 5 (3,881) 1,862 2,187 310 12,300 (5,420) (4,319) (434) (1) 38 623 (9,514) (1,286) (377) (533) (3,647) (100) (5,944) (33) (3,191) 10,015 6,824 Adjustments to reconcile operating income to net cash provided by operating activities Depreciation, amortization and impairment loss Write-down and reversals, net Tax paid Dividend from equity-accounted investees Change in net operating capital 1) Other Net cash from operating activities Investing activities Purchases of property, plant and equipment Purchases of subsidiaries Purchases of other long-term investments Net sales/(purchases) of short-term investments Proceeds from sales of property, plant and equipment Proceeds from sales of other long-term investments Net cash from/(used in) investing activities Financing activities Loan proceeds/(repayments), net Purchase of treasury shares Redeemed shares Norwegian State Dividend Net cash transfers (to)/from non-controlling interests Net cash from/(used in) in financing activities Foreign currency effects on cash flows Net increase (decrease) in cash and cash equivalents Cash and cash equivalents at beginning of period Cash and cash equivalents at end of period Bank deposits not available for the use of other group companies 1) Operating capital consists of trade receivable, inventories and trade payable. 2) See note 8 for more information. 3 5 3 2 2 (6) 56 (54) 6,824 6,770 2,270 10,015 12,285 532 501 383 YARA FIRST QUARTER 2014 Notes to the condensed consolidated interim financial statements GENERAL AND ACCOUNTING POLICIES Yara (the Group) consists of Yara International ASA (the Company) and its subsidiaries. Yara International ASA is a limited company incorporated in Norway. The condensed consolidated interim financial statements consist of the Group and the Group’s interests in equity-accounted investees. The consolidated financial statements of the Group as at and for the year ended 31 December 2013 are available upon request from the Company’s registered office at Bygdøy Allé 2, Oslo, Norway or at www.yara. com. These condensed consolidated interim financial statements have been prepared in accordance with International Financial Reporting Standard (IFRS) IAS 34 Interim Financial Reporting as approved by EU and additional requirements in the Norwegian Securities Trading Act. They do not include all of the information required for full annual consolidated financial statements, and should be read in conjunction with consolidated financial statements of the Group as at and for the year ended 31 December 2013. These condensed consolidated interim financial statements are unaudited. The accounting policies applied by the Group in these condensed consolidated interim financial statements are mainly the same as those applied by the Group in its consolidated financial statements as at and for the year ended 31 December 2013, except for IFRS 10, 11 and 12 and revised IAS 27 and 28 which Yara implemented 1 January 2014. See note 8 for further information. As a result of rounding differences numbers or percentages may not add up to the total. Note 1 Judgments, estimates and assumptions The preparation of condensed consolidated interim financial statements in accordance with IFRS and applying the chosen accounting policies requires management to make judgments, estimates and assumptions that affect the reported amounts of assets, liabilities, income and expenses. The estimates and associated assumptions are based on historical experience and various other factors that are believed to be reasonable under the circumstances. Actual results may differ from these estimates. The estimates and the underlying assumptions are reviewed on an ongoing basis. Revisions to accounting estimates are recognized in the period in which the estimate is revised if the revision affects only that period or in the period of the revision and future periods if the revision affects both current and future periods. When preparing these condensed consolidated interim financial statements, the significant judgments made by management in applying the Group’s accounting policies and the key sources of estimation uncertainty, were mainly the same as those that applied to the consolidated financial statements as of the period ended 31 December 2013. The implementation of the new standards IFRS 10 and 11 and the revised IAS 28 has however required management judgments, particularly when distinguishing between joint operations and joint ventures. See note 8 for more information. 17 18 YARA FIRST QUARTER 2014 Note 2 Shares, dividend and share buy-back program The Board of Directors proposed a dividend for 2013 of NOK 10 per share. If approved by the Annual General Meeting in May 2014, the total dividend payment will be NOK 2,771 million based on current outstanding shares. In May 2013 the Annual General Meeting authorized the Board of Directors to acquire up to 5% (13,925,045 shares) with a nominal value of up to NOK 23,672,577 in the equity market and from the Norwegian State. Within this frame, the Company has acquired 1,450,000 shares with a total nominal value of NOK 2,465,000. The Board proposed to the Annual General Meeting in May 2014, that these shares shall be cancelled by reduction of the Company’s share capital. The Norwegian State committed itself to participate on a pro-rata basis in the capital reduction. This means that the Norwegian State’s ownership interest of 36.21% remains unchanged. Total remuneration for the buy-back and redemption of the Norwegian State’s shares amounts to NOK 591 million. Yara has not purchased own shares during first quarter 2014. The Board has proposed to the Annual General Meeting in May 2014 that the existing buy-back program is replaced by a new program, authorizing the Board to acquire up to 5% (13,811,388 shares) of Yara’s shares before the next Annual General Meeting. Shares may be purchased within a price range of NOK 10 to NOK 1,000. The shares may either be used for cancellation or as payment in business transactions. The company will enter into a new agreement with the Norwegian State to redeem shares on a pro-rata basis so that the State’s ownership is unchanged in the event of a cancellation of the shares bought back. Ordinary shares Total at 31 December 2012 284,207,264 (2,066,354) (3,640,000) Own shares (3,640,000) Redeemed shares Norwegian State 1) Shares cancelled 1) Treasury shares - share buy-back program 1) Total at 31 December 2013 278,500,910 3,640,000 (1,450,000) (1,450,000) Total at 31 March 2014 278,500,910 (1,450,000) 1) As approved by General Meeting 13 May 2013. YARA FIRST QUARTER 2014 Note 3 Operating segment information 1Q 2014 1Q 2013 Restated 3) 2013 Restated 3) External revenue and other income Downstream Industrial Upstream Other and eliminations Total 16,748 3,405 1,544 12 21,709 14,557 3,392 2,693 55 20,697 62,268 13,693 9,008 123 85,092 Internal revenue and other income Downstream Industrial Upstream Other and eliminations Total 418 37 7,659 (8,115) - 401 56 8,340 (8,797) - 1,592 170 30,487 (32,249) - Revenue and other income Downstream Industrial Upstream Other and eliminations Total 17,167 3,442 9,203 (8,103) 21,709 14,958 3,449 11,033 (8,742) 20,697 63,860 13,864 39,495 (32,127) 85,092 Operating income Downstream Industrial Upstream Other and eliminations Total 1,515 287 717 (252) 2,268 838 168 1,630 181 2,817 3,078 841 4,135 20 8,074 EBITDA Downstream Industrial Upstream Other and eliminations Total 1,792 365 1,646 (213) 3,591 1,004 228 2,711 240 4,184 4,013 1,144 8,004 238 13,399 Investments 1) Downstream Industrial Upstream Other and eliminations Total 442 218 748 41 1,449 148 43 558 47 795 3,515 321 3,941 206 7,984 Total Assets 2) Downstream Industrial Upstream Other and eliminations Total 28,890 5,381 48,486 6,556 89,314 23,538 4,962 45,802 11,602 85,904 26,884 5,125 49,479 7,113 88,602 NOK millions 1) Investments in property, plant and equipment, intangible assets, equity-accounted investees and other equity investments. 2) Assets exclude internal cash accounts and accounts receivables related to group relief. 3) See note 8 for more information. 19 20 YARA FIRST QUARTER 2014 1Q 2014 1Q 2013 Restated 3) 2013 Restated 3) CROGI (12-month rolling average) Yara 1) Downstream Industrial Upstream 11.8% 16.6% 16.9% 9.3% 17.0% 15.3% 11.5% 17.0% 12.6% 14.5% 15.4% 10.8% ROCE (12-month rolling average) Yara Downstream Industrial Upstream 11.4% 17.8% 21.9% 7.3% 18.8% 16.2% 12.8% 18.5% 12.6% 15.2% 19.5% 9.7% Reconciliation of EBITDA to Income before tax EBITDA Depreciation, amortization and impairment loss 2) Foreign exchange gain/(loss) Interest expense and other financial items Income before tax 3,591 (1,023) 78 (239) 2,407 4,184 (842) (218) (160) 2,964 13,399 (3,836) (949) (904) 7,711 NOK millions, except percentages RECONCILIATION OF OPERATING INCOME TO EBITDA Interest income and other financial income Depreciation, amortization and impairment loss 1) Operating income Equity-accounted investees Downstream Industrial Upstream Other and eliminations Total 1,515 287 717 (252) 2,268 (1) 21 170 191 90 2 2 16 110 1,605 310 889 (236) 2,568 1Q 2013 2) Downstream Industrial Upstream Other and eliminations Total 838 168 1,630 181 2,817 (5) 13 432 439 39 1 45 86 872 181 2,063 226 3,342 132 47 649 14 842 1,004 228 2,711 240 4,184 2013 2) Downstream Industrial Upstream Other and eliminations Total 3,078 841 4,135 20 8,074 259 5 7 143 414 3,376 929 5,096 162 9,563 637 215 2,908 76 3,836 4,013 1,144 8,004 238 13,399 NOK millions EBIT EBITDA 1Q 2014 1) Including amortization of excess value in equity-accounted investees. 2) See note 8 for more information. 40 83 954 1,076 188 56 757 23 1,023 1,792 365 1,646 (213) 3,591 YARA FIRST QUARTER 2014 21 Note 4 Business initiatives Yara has acquired the German water sensor company ZIM Plant Technology GmbH. The company has developed technology to monitor the water status of the crop. Closing of the deal was 2 January 2014. The transaction value is EUR 3.5 million and the company is included in the Downstream segment. On 29 January 2014, Yara acquired H+H Umwelt- und Industrietechnik GmbH. H+H specializes in Selective Catalytic Reduction (SCR) systems for NOx abatement in ships and power plants. The company provides SCR systems to the shipping and industrial markets, with over 1,200 installed SCR units around the world. The transaction value is EUR 15.4 million and the company is included in the Industrial segment. Yara has consolidated H+H, ZIM Plant Technology GmbH and Kynoch business from the acquisition dates. See note 5 for further information. Yara signed an agreement to acquire a majority 63.33% stake in Green Tech Marine (GTM), a sulphur oxide (SOx) scrubber supplier to the marine industry on 22 March 2014. Closing of the deal took place in second quarter 2014. The transaction value is NOK 47.5 million and the company will be included in the Industrial segment. In November 2013, Yara entered into an agreement to acquire OFD Holding Inc. from Ominex Resources Inc., for an enterprise value of USD 425 million. The share purchase agreement was signed in first quarter 2014, and closing is expected to take place in third quarter 2014. Yara acquired the Kynoch business in the Cape regions of South Africa on 1 March 2014. The business represents 140 kiloton of fertilizer sales, with a differentiated product portfolio offering crop nutrition solutions. The transaction value is USD 31 million and the unit is included in the Downstream segment. Note 5 Business combinations During first quarter 2014, Yara closed its acquisitions of ZIM Plant Technology GmbH, H+H Umwelt- und Industrietechnik GmbH and the southern part of Kynoch’s business in South Africa. The acquisition of ZIM Plant Technology GmbH marks a strategic move to engage in agricultural water use efficiency. The company has developed technology to monitor the water status of the crop. Yara strengthens its position in the area of Nitrogen Oxide (NOx) Emissions Control systems in a strategic move acquiring H+H Umwelt- und Industrietechnik GmbH. H+H specializes in Selective Catalytic Reduction (SCR) systems for NOx abatement in ships and power plants. Through this acquisition, Yara continues to develop into a global Emission-to-Air abatement company, building a comprehensive portfolio of NOx reduction systems. Kynoch South (Cape) will operate in the premium offerings segment in South Africa reaching the Western, Eastern and Northern Cape regions. The acquisitions above are presented combined in the column “Total 2014”. It is not recognized any non-controlling interests on any of the business combinations. CONSIDERATIONS NOK millions Cash transferred Debt settled as part of the transaction 1) Deferred consideration 1) Total considerations 1) Related to the business combination of Cape. Total 2014 299 19 30 348 22 YARA FIRST QUARTER 2014 IDENTIFIABLE ASSETS ACQUIRED AND LIABILITIES RECOGNIZED AT THE DATE OF ACQUISITIONS (FAIR VALUE) NOK millions Total 2014 Assets Patents, part of intangible assets Customer relationships, part of intangible assets Property, plant and equipment Other non-current assets Inventories Trade receivables Prepaid expenses and other current assets Cash and cash equivalents Total assets 25 68 17 1 107 29 4 6 257 Liabilities Long-term provisions Deferred tax liabilities Trade and other payables Bank loans and other interest-bearing short term debt Other short-term liabilities Total liabilities 3 26 30 8 3 70 Total identifiable net assets at fair value 187 The receivables acquired in all business combinations have a gross contractual amount equal to their fair value. The initial accounting for the acquisitions has only been provisionally determined at the end of the reporting period. The tax values of Cape are impacted by the transaction. GOODWILL ARISING ON ACQUISITIONS NOK millions Total 2014 Total consideration Less: Fair value of net identifiable assets acquired Goodwill arising on acquisition 348 (187) 161 1) Deferred consideration related to Cape of NOK 30 million is dependent on guarantees to be established. Expected settlement in 2Q 2014. Goodwill arose on the acquisitions due to future economic benefits from the assembled workforce. For Cape it also reflects a willingness to pay for operational benefits in raw material sourcing and increased sale of premium offerings. None of the goodwill arising on acquisitions is deductible for tax purposes. NET CASH OUTFLOW ON BUSINESS COMBINATIONS NOK millions Total 2014 Consideration paid in cash at date of acquisition Less: Cash and cash equivalent balances acquired Net cash outflow on business combinations 299 (6) 293 Net cash outflow is presented as a part of “purchases of other long-term investments” in the condensed consolidated interim statement of cash flows. “Pro-forma” figures have not been prepared as the business combination would have limited impact to the year-to-date figures of the Group. YARA FIRST QUARTER 2014 Note 6 Inventory NOK millions Finished goods Work in progress Raw materials Total 31 Mar 2014 31 Mar 2013 31 Dec 2013 6,382 506 6,201 13,089 7,591 550 4,707 12,848 7,164 633 5,332 13,129 Write-down Balance at 1 January Reversal/(write-down), net Foreign currency translation Closing balance (103) 5 2 (95) (96) 19 (2) (78) (96) 2 (9) (103) Note 7 Long-term debt An updated overview of the contractual payments on long-term debt is provided in the table below: NOK millions 2015 2016 2017 2018 Thereafter Total Debentures Bank Loans Capital lease and other long-term loans Total 1,039 2,971 4,010 98 98 99 98 449 843 23 628 26 27 228 931 121 1,765 124 125 3,648 5,784 Yara International ASA has repaid NOK 625 million of its bond debt upon maturity in March. 23 24 YARA FIRST QUARTER 2014 Note 8 Restatement effects Effective 1 January 2014 Yara adopted the new standards IFRS 10, 11, 12 and revised IAS 27 and 28 with retrospective application. IMPACT OF IMPLEMENTATION OF IFRS 10 CONSOLIDATED FINANCIAL STATEMENTS AND REVISED IAS 27 SEPARATE FINANCIAL STATEMENTS The Group adopted IFRS 10 in the current year. IFRS 10 changes the definition of control and Yara has assessed whether or not the Group has control over some of the associates or joint ventures (under the previously existing IAS 28 and the old IAS 31). At the date of initial application of IFRS 10, the Group assessed that it did not control any of the equity-accounted investees. IMPACT OF IMPLEMENTATION OF IFRS 11 JOINT ARRANGEMENTS IFRS 11 replaces IAS 31 Interests in Joint Ventures. IFRS 11 deals with how a joint arrangement, of which two or more parties have joint control, should be classified and accounted for. The classification should be joint operation or joint venture. Investments in joint ventures are accounted for using the equity method, and joint operations are accounted for by each joint operator accounting for its share of assets, liabilities, revenues and expenses. Yara’s management assessed the classification of the Group’s investments in joint arrangements in accordance with IFRS 11. Management concluded that two joint arrangements should be classified as joint operations and thus changing the accounting from equity method to the Group’s share of assets, liabilities, revenues and expenses. The companies are Trinidad Nitrogen Company Ltd., where Yara owns 49%, and Yara Pilbara Nitrates, where Yara consolidates 55% (owned directly 35% by Yara and 20% through Yara Pilbara Holding where Yara has a ownership of 51%). The main reason why Tringen is classified as a joint operation is that Yara buys all products produced by the plant. Yara Pilbara Nitrates is classified as a joint operation as the products produced by the plant will be sold solely to the parties of the joint operation. IMPACT OF IMPLEMENTATION OF IFRS 12 DISCLOSURE OF INTERESTS IN OTHER ENTITIES More extensive disclosures are required by IFRS 12 for entities having interests in subsidiaries, joint arrangements and associates. These requirements are not included in the interim consolidated financial statements, but will be assessed for the annual report 2014. IMPACT OF IMPLEMENTATION OF REVISED IAS 28 INVESTMENTS IN ASSOCIATES AND JOINT VENTURES Yara sold 16% in Yara Praxair Holding AS in 2011, and joint control ceased over this entity. This transaction gave a remeasurement gain of remaining 34% ownership in the associate of NOK 661 million. Under the revised IAS 28, remeasurement of remaining ownership is not required. The effect has been restated. The restatement reduces the carrying value of the investment and Yara’s equity. Also, the restatement gave a NOK 7 million positive impact on operating income due to reversal of amortization of excess values. YARA FIRST QUARTER 2014 1 JANUARY 2013 - IMPLEMENTATION EFFECTS 1 Jan 2013 NOK millions As reported IFRS 11 Derecognized IAS 28 Recognized 1 Jan 2013 Change Restated Assets Non-current assets Deferred tax assets Intangible assets Property, plant and equipment Equity-accounted investees Other non-current assets Total non-current assets 1,376 7,512 27,893 10,501 1,437 48,719 Current assets Inventories Trade receivables Prepaid expenses and other current assets Cash and cash equivalents Non-current assets classified as held-for-sale Total current assets 11,927 8,045 2,607 9,941 11 32,530 Total assets 81,249 (784) (784) (784) 37 701 738 76 41 28 74 220 957 (4) (648) (652) (652) 1,409 7,512 28,594 9,069 1,437 48,022 12,003 8,086 2,635 10,015 11 32,750 80,772 Equity and liabilities Equity Share capital reduced for treasury stock Premium paid-in capital Total paid-in capital 477 117 594 - - - 477 117 594 Other reserves Retained earnings Total equity attributable to shareholders of the parent (2,886) 50,538 48,246 (784) (784) 784 784 (652) (652) (2,886) 49,886 47,594 Non-controlling interests Total equity 1,745 49,991 (784) 784 (652) 1,745 49,339 Non-current liabilities Employee benefits Deferred tax liabilities Other long-term liabilities Long-term provisions Long-term interest-bearing debt Total non-current liabilities 2,350 4,442 658 407 9,287 17,144 - 78 1 80 - 2,427 4,444 659 407 9,287 17,224 Current liabilities Trade and other payables Current tax liabilities Short-term provisions Other short-term liabilities Bank loans and other interest-bearing short-term debt Current portion of long-term debt Total current liabilities 9,665 1,932 230 680 604 1,004 14,115 - 172 6 (84) 94 - 9,838 1,932 230 686 520 1,004 14,209 Total equity and liabilities 81,249 (784) 957 (652) 80,772 25 26 YARA FIRST QUARTER 2014 2013 - IFRS 11 AND IAS 28 RESTATEMENTS 1Q 2013 NOK millions, except percentages and per share information As reported 2013 Restatement Effects Restated As reported Restatement Effects Restated YARA Condensed consolidated statement of income Revenue and other income Operating income Share of net income equity-accounted investees Income taxes Net Income Earnings per share Condensed consolidated statement of comprehensive income Exchange differences on translation of foreign operations Remeasurements of the net defined benefit pension liability Remeasurements of the net defined benefit pension liability for equity-accounted investees Total other comprehensive income, net of tax Total comprehensive income Total comprehensive income attributable to: Shareholders of the parent 20,690 2,682 525 (558) 2,357 8.04 1,528 (6) 7 136 (86) (47) 2 0.01 - 20,697 2,817 439 (605) 2,359 8.04 85,052 7,791 1,250 (1,506) 6,097 20.63 40 283 (174) (97) 11 0.04 85,092 8,074 1,076 (1,602) 6,108 20.67 1,527 - 4,856 409 (5) (10) 4,851 399 (6) (101) 10 (90) 1,401 3,758 2 1,401 3,760 4,984 11,081 (5) 6 4,979 11,087 3,574 2 3,576 10,567 6 10,572 Condensed consolidated statement of financial position Total non-current assets Total current assets 48,973 37,467 (684) 148 48,289 37,616 56,459 32,521 (536) 158 55,923 32,679 Total equity Total non-current liabilities Total current liabilities 53,667 16,694 16,080 (650) 81 33 53,017 16,776 16,112 56,419 13,444 19,118 (646) 119 149 55,773 13,562 19,266 4,017 (787) (1,016) 56 12,174 (9,259) (5,989) (48) 126 (254) 45 14 12,300 (9,514) (5,944) (33) 2,337 9,941 12,278 49 (105) (18) 7 (68) 75 7 2,270 10,015 12,285 (3,122) 9,941 6,819 (69) 75 5 (3,191) 10,015 6,824 4,129 55 4,184 13,266 12.6% 12.4% 133 13,399 12.6% 12.6% Condensed consolidated statement of cash flows Net cash from operating activities Net cash from/ (used in) investing activities Net cash from/ (used in) financing activities Foreign currency effects on cash flows Net increase (decrease) in cash and cash equivalents Cash and cash equivalents at beginning of period Cash and cash equivalents at end of period Other key figures EBITDA CROGI ROCE 3,968 (682) (998) 48 YARA FIRST QUARTER 2014 2013 - SEGMENT RESTATEMENTS The restatements following the new and revised standards presented above impacted the Upstream and Industrial segments. In addition, Yara made changes to the segment structure effective from 1 January 2014. Comparative figures for 2013 are restated . The segment changes are: • Transfer of business unit Feed Phosphates from Upstream to Industrial • Transfer of unit Yara Pilbara Nitrates, which is currently constructing a TAN plant in Australia, from Industrial to Upstream The table below provides the restatement effects on segment level, both for the changes in accounting standards and for the changes to the segment structure: 1Q 2013 NOK millions, except percentages Upstream segment Revenue and other income Operating income EBITDA Total Assets 1) CROGI ROCE Industrial segment Revenue and other income Operating income EBITDA Total Assets 1) CROGI ROCE Other and eliminations Revenue and other income Total Assets 1) As reported Effects of new and revised standards 11,221 1,485 2,649 45,405 7 136 53 167 3,078 178 235 5,772 (8,567) 11,725 1)Assets exclude cash accounts and accounts receivable related to group relief. 2013 Effects of change in segment structure Effects of new and revised standards Effects of change in segment structure Restated As reported (196) 9 9 231 11,033 1,630 2,711 45,802 40,267 3,886 7,919 48,246 11.0% 9.8% 40 283 133 1,019 (812) (34) (48) 214 39,495 4,135 8,004 49,479 10.8% 9.7% 2 (634) 371 (9) (9) (176) 3,449 168 228 4,962 12,397 807 1,096 6,692 12.2% 13.7% (1,397) 1,466 34 48 (169) 13,864 841 1,144 5,125 15.4% 19.5% (68) (175) (54) (8,742) 11,602 (31,472) 7,159 (655) (45) (32,127) 7,113 - Restated 27 28 YARA FIRST QUARTER 2014 Quarterly historical information EBITDA NOK millions Downstream Industrial Upstream Other and eliminations Total 1Q 2014 1,792 365 1,646 (213) 3,591 4Q 2013 2) 718 306 1,002 (168) 1,858 3Q 2013 2) 1,094 304 1,797 123 3,318 2Q 2013 2) 1,196 306 2,493 44 4,039 1Q 2013 2) 1,004 228 2,711 240 4,184 RESULTS NOK millions, except per share information Revenue and other income Operating income EBITDA Net income after non-controlling interests Earnings per share (NOK) USD 1) millions, except per share information Revenue and other income Operating income EBITDA Net income after non-controlling interests Earnings per share (USD) 1) USD numbers are calculated monthly based on average NOK/USD per month. 2) 2013 figures have been restated, see note 8 for more information. 1Q 2014 21,709 2,268 3,591 1,773 6.40 1Q 2014 3,565 373 590 292 1.05 4Q 2013 2) 20,573 583 1,858 63 0.23 4Q 2013 2) 3,400 98 308 5 0.02 3Q 2013 2) 20,613 2,022 3,318 1,571 5.66 3Q 2013 2) 3,457 339 556 263 0.95 2Q 2013 2) 23,209 2,651 4,039 1,867 6.69 2Q 2013 2) 3,985 455 694 321 1.15 1Q 2013 2) 20,697 2,817 4,184 2,257 8.04 1Q 2013 2) 3,678 501 744 401 1.43 E LU VA NCE ESE PR N AI CH SCALE ADVANTAGES Upstream Downstream Yara International ASA Bygdøy allé 2 P. O. Box 2464, Solli NO–0202 Oslo Norway Tel: +47 24 15 70 00 UNIQUE FLEXIBILITY Fax: +47 24 15 70 01 Industrial SUPPLY & TRADE E NC SE RE P KET MAR www.yara.com YARA HAS A STRONG platform building on its global presence, its vast knowledge base and unique business model. With a presence from sourcing of resources to dissemination of knowledge in the field, Yara is positioned to yield margins throughout the value chain. VALUE CHAIN PRESENCE Downstream UNIQUE FLEXIBILITY SCALE ADVANTAGES Upstream Industrial SUPPLY & TRADE YARA ACTIVELY RESPONDS to global challenges – and is positioned to make a difference. We succeed by pursuing a strategy that creates value for owners, customers and society at large – Creating Impact by using economic success as a lever for change, positioning the company. MARKET PRESENCE PILLARS OF STRENGTH Global #1 Global #1 Global #1 LEADERSHIP position in the ammonia value chain, producing ammonia/urea at scales from base in low-cost natural gas regions. LEADERSHIP position in nitrate markets, enefiting from a favorable cost position b in the European market. LEADING position in production and application of NPK, adding value to farmers through balanced fertilization. Global #1 European #1 Global #1 LEADING position in specialty fertilizers, LEADING position in nitrogen applications, targeting high-margin cash crop segments in fast growing markets. eveloping higher margin industrial applications d from existing production base. LEADING position in global marketing and istribution, delivering expertise on all continents d through network offering economies of scale. in ammonia in specialty fertilizers in nitrates in nitrogen applications in NPK in marketing and distribution
© Copyright 2026 ExpyDoc