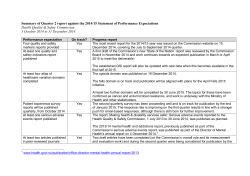
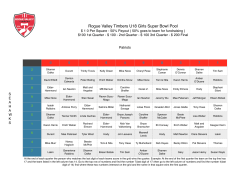
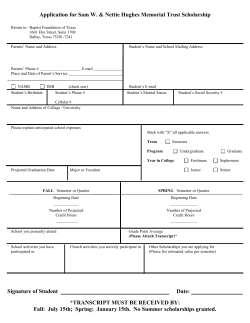
Private Health Insurance
Australia
Quarterly Statistics
March 2014
Contents
Snapshot of the industry.…….…….………………..………
3
Membership and coverage…….……….……………..……
4
Benefits paid…..…….…….……………….…………………
6
Service utilisation………..…….……………………………
9
Out-of-pocket payments…….………………………………
10
Financial information…………………………………………
11
Notes on statistics……………………………………………
13
Definitions……………...………………………………………
14
Related publications…………….……………………………
15
Use of this publication
This publication is available for your use under a Creative Commons Attribution 3.0 Australia licence, with the
exception of the Commonwealth Coat of Arms, photographs, images, signatures and where otherwise stated.
The full licence terms are available from <http://creativecommons.org/licenses/by/3.0/au/legalcode>
Use of PHIAC material under a Creative Commons Attribution 3.0 Australia licence requires you to attribute
the work (but not in a way that suggests that PHIAC endorses you or your use of the work).
Disclaimer
While PHIAC endeavours to ensure the quality of this publication, PHIAC does not accept any responsibility
for the accuracy, completeness or currency of the material included in this publication, and will not be liable
for any loss or damage arising out of any use, or reliance on, this publication.
Revisions
Significant revisions to this publication, if any, are identified and quantified in the 'Notes' section. This
publication will include revisions to previously published statistics if amendments become available or
if compilation errors are uncovered. PHIAC regularly analyses past revisions to identify potential
improvements to the source data and statistical compilation techniques, in order to minimise the frequency
and scale of any future revisions.
Suggested citation
Private Health Insurance Administration Council, Quarterly Statistics March 2014, Canberra, 2013
Contact information
Paul Collins
Director, Information and Statistics
PO Box 4549
Kingston ACT 2604
T 02 6215 7955
F 02 6215 7977
E [email protected]
Key metrics
Hospital treatment membership
5,331,323
5,208,093
Policies
47.0% of population at 31 March 2014
0.0% no change from December 2013
↑ 45,845 insured persons over the quarter
11,004,273
10,763,182
Insured persons
31 March 2014
31 March 2013
General treatment membership
6,220,688
6,047,526
Policies
55.0% of population at 31 March 2014
↑ 0.1% percentage points from 31 Dec 2013
↑ 67,732 insured persons over the quarter
12,892,622
12,561,188
Insured persons
31 March 2014
31 March 2013
Hospital treatment episodes
4,027,967
↑ 7.7% over the 12 months to March 2014
↓ -6.1% over the quarter
3,739,683
12 months to 31 March 2014
12 months to 31 March 2013
General treatment services (ancillary)
↑ 8.9% over the 12 months to March 2014
↑ 3.9% over the quarter
82,566,554
75,819,571
12 months to 31 March 2014
Benefits
(millions)
Hospital treatment
(Including HST)
General treatment
(CDMP)
12 months to 31 March 2013
↑ 8.8% over the 12 months to March 2014
↓ -6.8% over the quarter
$12,119
$11,141
$51
$57
General treatment
(ancillary)
↑ 12.4% over the 12 months to March 2014
↑ 8.1% over the quarter
$4,236
$3,768
12 months to 31 March 2014
12 months to 31 March 2013
Out-of-pocket per episode/service
$307.39
$296.89
↑ 3.4% over the 12 months to March 2014
Hospital treatment
↓ -2.9% over the 12 months to March 2014
General treatment
(ancillary)
$45.02
$46.34
31 March 2014
31 March 2013
Financial
(millions)
$18,962
Premium
revenue
$17,633
$16,526
$14,997
Benefits
Profit before tax
$1,135
$1,463
↑ 7.5% over the 12 months to March 2014
↑ 10.2% over the 12 months to March 2014
↓ -22.4% over the 12 months to March 2014
12 months to 31 March 2014
12 months to 31 March 2013
Private Health Insurance Administration Council
3
Membership and coverage
as at 31 March 2014
Hospital Treatment
At 31 March 2014, 11,004,273 people, or
47.0% of the population, were covered by
hospital treatment cover. There was no change
in the percent of population covered compared
to the December 2013 quarter.
Net quarterly change in insured persons
40,000
35,000
There was an increase in coverage of 45,845
insured people in the March 2014 quarter.
Single policies rose by 7,875 and family
policies by 14,090 during the quarter. This
resulted in an overall increase of 21,695
hospital policies. For the 12 months to 31
March 2014, the number of insured people with
hospital treatment cover has increased by
241,091 and 123,230 policies.
30,000
Actual change
25,000
Net Change
20,000
15,000
10,000
5,000
0
95+
90–94
85–89
80–84
75–79
70–74
65–69
60–64
55–59
50–54
45–49
40–44
35–39
30–34
25–29
20–24
15–19
5–9
10–14
-10,000
The largest increase in coverage during the
quarter was 13,996 for people aged between
30 and 34.
0–4
-5,000
Number of persons insured by age
Lifetime health cover
90–94
The majority of adults with hospital cover
(85.6%) have a certified age of entry of 30,
with no penalty loading. The proportion of
adults with hospital cover who pay a loading
has remained steady at 14.4% over the last
three quarters, stopping the trend for this
proportion to increase each quarter since the
introduction of Lifetime Health Cover.
80–84
70–74
60–64
50–54
40–44
30–34
At the end of theMarch 2014 quarter, there
were 1,144,564 people with a certified age of
entry of more than 30 and subject to a Lifetime
Health Cover loading; a net increase in people
paying a penalty over the preceding 12 months
of 53,419. There was a net increase in people
with a certified age of entry of 30 (with no
penalty) over the year of 123,105. This
includes 61,564 people who had their loading
removed during the year, after ten years of
paying a loading.
20–24
10–14
0–4
600
400
Persons '000
200
0
Female
200
400
600
Male
Hospital treatment tables
Aust.
47.0%
53.0%
Aust.
5,341,469
5,662,804
Aust.
48.0%
52.0%
NSW
47.7%
52.3%
NSW
1,735,523
1,836,936
NSW
47.9%
52.1%
Vic.
44.7%
55.3%
Vic.
1,255,232
1,349,117
Vic.
51.0%
49.0%
Qld
45.2%
54.8%
Qld
1,033,861
1,098,116
Qld
45.3%
54.7%
SA
45.9%
54.1%
SA
371,994
400,470
SA
47.9%
52.1%
WA
682,034
694,483
WA
46.5%
53.5%
Tas.
110,154
120,531
Tas.
47.9%
52.1%
ACT
106,431
115,304
ACT
49.7%
50.3%
NT
46,240
47,847
NT
46.0%
54.0%
WA
Tas.
ACT
NT
53.5%
44.9%
57.5%
38.5%
Insured persons
4
46.5%
55.1%
42.5%
61.5%
Non insured persons
Private Health Insurance Administration Council
Male
Female
Single policies
Family policies
General Treatment
At 31 March 2014, 12,892,622 people or
55.0% of the population had some form of
general treatment cover. There was an
increase of 67,732 people when compared to
the December 2013 quarter, an increase of 0.1
percentage points in population covered.
Net quarterly change in insured persons
(ancillary)
40,000
35,000
30,000
25,000
20,000
15,000
10,000
5,000
0
95+
90–94
85–89
80–84
75–79
70–74
65–69
60–64
55–59
50–54
45–49
40–44
35–39
30–34
25–29
20–24
15–19
5–9
-10,000
The general treatment (ancillary) by age charts
and data in this report show data for those
people that have general treatment policies
covering ancillary services, regardless of other
treatment included in the product. This
excludes those general treatment policies that
do not cover ancillary treatment.
10–14
-5,000
0–4
The increase in single policies was 15,681 and
family policies increased by 18,438 during the
quarter. The overall increase was 34,119
general treatment policies. For the 12 months
to 31 March 2104, the number of insured
persons with general treatment cover has
increased by 331,434 and general treatment
policies increased by 173,162.
Number of persons insured by age (ancillary)
90–94
There was an increase of 75,283 people with
general treatment (ancillary) coverage in the
March 2014 quarter. The largest increase in
coverage was 15,283 for people in the 30 to 34
age group.
80–84
70–74
60–64
50–54
40–44
30–34
20–24
10–14
0–4
600
400
Persons '000
200
0
Female
200
Male
400
600
General treatment tables (ancillary)
Aust.
55.0%
45.0%
Aust.
5,707,364
6,064,271
Aust.
48.2%
51.8%
NSW
56.9%
43.1%
NSW
1,897,877
2,002,539
NSW
47.5%
52.5%
51.0%
49.0%
Vic.
50.6%
49.4%
Vic.
1,208,626
1,295,553
Vic.
Qld
50.0%
50.0%
Qld
1,059,638
1,135,899
Qld
46.1%
53.9%
SA
444,620
482,564
SA
48.2%
51.8%
WA
822,601
849,919
WA
47.8%
52.2%
Tas.
116,917
129,108
Tas.
48.7%
51.3%
ACT
110,225
119,638
ACT
49.8%
50.2%
NT
46,860
49,051
NT
46.8%
53.2%
SA
WA
Tas.
ACT
NT
58.4%
66.6%
51.2%
66.9%
41.3%
Insured persons
41.6%
33.4%
48.8%
33.1%
58.7%
Not insured persons
Male
Female
Single policies
Family policies
Private Health Insurance Administration Council
5
Benefits Paid
Hospital treatment
Benefits per episode/service
March 2014
Hospital treatment benefits paid by age
12 months to 31 March 2014
Change
from
December
2013
90–94
80–84
Hospital Treatment
Acute
$2,113.21
Medical
$58.89
Prostheses $751.29
Cardiac
$6,206.01
Hip
$2,062.96
Knee
$2,171.85
Total benefits and growth rate
$2,925,015,546
Hospital
$1,136,205,951
General
70–74
-0.2%
-0.9%
-4.0%
-2.9%
0.4%
0.8%
60–64
50–54
40–44
30–34
-6.8%
8.1%
20–24
10–14
0–4
750,000
$'000
◊ $2,055 million for hospital services such as
accommodation and nursing
◊ $465 million for medical services
◊ $404 million for prostheses items
500,000
250,000
0
Female
250,000
750,000
Male
Hospital treatment benefits per person and percentage of benefits
paid by age cohort
$6,000
14%
$5,000
12%
◊ $1.8 million for nursing home type patients.
$4,000
The age group for which most hospital benefits
are paid is between 60 and 79 (top chart). Total
benefits by age group is affected by the benefits
paid per person (displayed in the second chart)
and the number of people in each age group.
The older age groups have a higher claiming
rate. The rise in benefits in the 20–39 age
cohorts is due to increases in female benefits
associated with child bearing.
$3,000
10%
8%
6%
$2,000
4%
$1,000
2%
$0
0%
Benefits per person
For the 12 month period, hospital treatment
benefits per person increased from $1,035.40 to
$1,101.33. The largest amount of benefits per
person was spent on hospital accommodation
and nursing, followed by medical and prostheses
benefits.
500,000
0–4
5–9
10–14
15–19
20–24
25–29
30–34
35–39
40–44
45–49
50–54
55–59
60–64
65–69
70–74
75–79
80–84
85–89
90–94
95+
During the March 2014 quarter, insurers paid
$2,925 million in hospital treatment benefits, an
deccrease of 6.8% compared to the December
2014 quarter. Hospital treatment benefits were
comprised of:
% benefits
Hospital treatment benefits per person
12 months to Mar 2013
$1,035.40
Medical
$176.06
12 months to Mar 2014
Hospital
$770.57
Prostheses
$154.70
6
Private Health Insurance Administration Council
General treatment
Benefits per service
March 2014
Dental
Chiropractic
Physiotherapy
Optical
$65.17
$30.66
$35.61
$68.63
General treatment benefits paid by age
12 months to 31 March 2014 (ancillary)
Change
from
December
2013
90–94
4.8%
11.0%
9.0%
4.6%
80–84
70–74
60–64
50–54
40–44
During the March 2014 quarter, insurers paid
$1,136 million in general treatment (ancillary)
benefits. This was an increase of 8.1%
compared to the December 2013 quarter.
Ancillary benefits for the March 2014 quarter
included the major categories of:
◊ Dental $571 million
◊ Optical $214 million
30–34
20–24
10–14
0–4
250,000
150,000
$'000
50,000
50,000
Female
150,000
250,000
Male
◊ Physiotherapy $94 million
General treatment benefits per person and percentage
of benefits paid by age cohort (ancillary)
◊ Chiropractic $76 million.
General treatment (ancillary) benefits per
person during the year to March 2014 were
$359.89, increasing from $329.65 for the year to
March 2013. The largest component of ancillary
benefits is dental, for which $185.63 was paid
per insured.
$600
12%
$500
10%
$400
8%
$300
6%
$200
4%
$100
2%
$0
0%
0–4
5–9
10–14
15–19
20–24
25–29
30–34
35–39
40–44
45–49
50–54
55–59
60–64
65–69
70–74
75–79
80–84
85–89
90–94
95+
There is a marked difference between the
distribution of benefits over age groups between
hospital benefits and ancillary benefits. The
major difference is the higher claiming rate in
older age groups for hospital benefits while
benefits per person for ancillary benefits are
more evenly spread over the age groups.
Benefits per person
% benefits
General treatment benefits per person (ancillary)
12 months to Mar 2013
Physiotherapy
$0.00
$329.65
Optical
$61.99
12 months to Mar 2014
Chiropractic
$23.43
Other
$59.10
Dental
$185.63
Physiotherapy
$29.73
Private Health Insurance Administration Council
7
Medical benefits
Prostheses benefits
Total benefits for medical services decreased
6.6% during the quarter and the amount of
benefits paid per service decreased by 0.9%.
Total benefits paid for prostheses decreased
by 9.8% compared to the December 2013
quarter. Similar to medical services, the
change in benefits paid for prostheses was
calculated over a range of prosthetics (see
chart) and does not mean prostheses overall
changed in cost. The change in benefits paid
may reflect a change in the type of prosthetics
utilised, or a change in the overall utilisation of
prosthetics. The prosthetic group for which the
greatest amount of benefits were paid was
"cardiac", comprising 19% of all prosthetic
benefits and totalling $78 million.
The change in medical benefits per service
was calculated over a range of medical
services and does not mean medical services
overall decreased in cost. The change in
average benefits paid may reflect a change in
the type of medical services utilised during the
quarter. The medical service for which the
greatest amount of benefits was paid was
anaesthetics, comprising 23% of all medical
benefits and totalling $108 million.
Medical benefits by Speciality group
General Surgical
6%
Pathology
8%
Obstetrics
7%
Ophthalmology
5%
Orthopaedic
8%
ICU
2%
Neuro
surgical
2%
Diagnostic
5%
Colorectal
5%
Anaesthesia
23%
Vascular
1%
Benefits paid for prostheses
General
Miscellaneous
11%
Plastic/
ENT reconstructive
1%
1%
Other
11%
Cardiac
19%
Cardiothoracic
Urogenital 1%
2%
Ophthalmic
5%
8
Knee
14%
Neurosurgical
3%
Vascular
3%
Private Health Insurance Administration Council
Spinal
8%
Orthopaedic
10%
Assist
at operations
3%
Urology
3%
Other
Specialties
5%
Smaller Groups
39%
Specialist
9%
Cardiothoracic
5%
Hip
11%
Plastic/
reconstructive
2%
ENT
2%
Service utilisation
Episodes/Services by type
March 2014
Hospital Episodes
Hospital Days
Medical Services
Prostheses Items Specialist Orthopaedic
Ophthalmic
Spinal
General
Dental
Chiropractic
Physiotherapy
Optical
Change
from
December
972,249
2,552,314
7,898,092
537,080
104,614
62,807
44,698
21,178,440
8,756,653
2,489,130
2,645,290
3,113,962
Hospital utilisation is distributed over four
categories of hospital—public, private, day only
facilities and hospital-substitute. During the
March 2014 quarter, hospital episodes were
distributed as follows:
-6.1%
-4.5%
-5.7%
-6.1%
-6.6%
-11.9%
2.9%
3.9%
0.0%
17.7%
10.7%
2.0%
◊
◊
◊
◊
public hospitals 171,205 episodes
private hospitals 628,522 episodes
day hospital facilities 140,059 episodes
hospital substitute 32,463 episodes
For the March 2014 quarter, hospital utilisation
(measured in episodes) decreased by 6.1%.
Utilisation was up by 1.3% for public hospitals
but decreased for all other hospital settings. All
categories increased in utilisation over the year.
During the March 2014 quarter, insurers paid benefits
for 2.6 million days in hospital, arising from 972,249
hospital episodes of care.
Quarter
change
◊
◊
◊
◊
The average length of stay was 2.63 days; an increase
of 0.04 days compared to the December 2013 quarter.
public hospitals
private hospitals
day hospital facilities
hospital-substitute
↑
↓
↓
↓
Year
change
↑
↑
↑
↑
1.3%
-7.5%
-5.6%
-16.7%
11.0%
5.8%
7.6%
37.0%
Day-only episodes in the four categories of
hospital totalled 624,853, a decrease of 7.2%
compared to the December 2013 quarter.
Acute episodes
Acute days
Dental
Optical
Medical services
Prostheses items
Physiotherapy
Chiropractic
Mar-14
Dec-13
Sep-13
Jun-13
Mar-13
Dec-12
Sep-12
Jun-12
Mar-12
Dec-11
Sep-11
Mar-14
Dec-13
Sep-13
0
Jun-13
100
0
Mar-13
200
100
Dec-12
300
200
Sep-12
400
300
Jun-12
500
400
Mar-12
600
500
Dec-11
700
600
Sep-11
800
700
Jun-11
900
800
Mar-11
900
Jun-11
General treatment services (ancillary) per 1,000
insured persons
Mar-11
Hospital treatment services per 1,000 insured persons
Private Health Insurance Administration Council
9
Out-of-pocket payments
Average out-of-pocket per episode/service
March 2014
Hospital treatment
Hospital-substitute treatment
General treatment ancillary
Prostheses where gap was
paid
Medical gap where gap was
paid
The out-of-pocket payments for hospital
episodes increased by 3.5% compared to
the same quarter for the previous year.
Change Change
from from Mar
13
December
$307.40
$3.34
$45.02
6.9%
8.5%
-3.7%
3.5%
-15.7%
-2.8%
$275.95
-65.5%
68.1%
$203.79
2.6%
15.4%
Out-of-pocket payments for medical services
were $203.79 where an out-of-pocket
payment was payable. The amount of gap
for medical services varies depending on the
specialty group. The specialty group with the
largest out-of-pocket payment was
plastic/reconstructive with an average gap of
$378.27, followed by orthopaedic with an
average gap per service of $354.89. Gap
incurred for the various medical services is
displayed in the first chart. Medical gap also
varies by state and territory and these
differences are shown in the bottom chart.
The average out-of-pocket (gap) payment for a hospital
episode was $307.40 in the March quarter. This included out-ofpocket payments for medical services, some prostheses in
addition to any excess or co-payment amounts relating to
hospital accommodation.
Benefits % of charge
Proportion of services and average out-of-pocket payments
Aust.
NSW
Vic.
Qld
SA
ACT
NT
10
Aust.
89.5%
NSW
1.6%
93.0%
3.2%
89.5%
2.2%
93.8%
2.8%
83.8%
WA
Tas.
90.1%
3.2%
92.2%
78.6%
5.2%
81.9%
7.3%
Qld
SA
WA
11.4%
4.1%
Vic.
Tas.
ACT
NT
$203.86
$20.19
$26.85
$10.20
$254.55
$145.71
$227.99
$23.89
$96.26
$5.97
$133.83
$21.62
$11.57
$148.05
$321.10
$68.65
$44.99
$248.08
Proportion of services with no gap
Average gap payment where gap was paid
Proportion of services with known gap
Average gap payment across all services
Private Health Insurance Administration Council
9%
91%
Other
4%
96%
Pathology
10%
90%
Assist at operations
Diagnostic
19%
81%
28%
72%
Orthopaedic
38%
Plastic/reconstruct
62%
20%
80%
30%
70%
ENT
Cardiothoracic
Urology
Gap % of charge
Ophthalmology
26%
74%
Neurosurgical
4%
96%
28%
72%
12%
88%
Vascular
6%
94%
20%
80%
Colorectal
15%
85%
Anaesthesia
General surgical
11%
89%
3%
97%
ICU
Obstetrics
2%
98%
Specialist consultants
Medical benefits and out-of-pocket by specialty group
Related Publications
Quarterly publications
PHIAC produces a number of quarterly publicatons that are available from
www.phiac.gov.au/for-industry/industry-statistics/
These include:
Membership Statistics
A publication which details by State the number of insured persons for hospital treatment and general
treatment and the proportion of the population these persons represent. The tables are shown on both a
quarterly and an annual basis and include hospital treatment by age cohort.
Medical Gap Information
A publication on in-hospital medical services. The proportion of services for which there was no gap or
known gap and the average gap payment are shown for each state.
PHIAC A Report
A publication detailing by State, the membership and benefits paid by private health insurers for the
period. These State reports are available both in PDF format and Excel.
Prostheses Report
A report providing data on prosthetic benefits paid by private health insurers by major prosthetic category
Medical Services Report
A report providing data on services, benefits paid and gap payments by MBS Specialty Block Groupings
for medical services paid by private health insurers.
Statistical Trends - Quarterly Statistical trends in membership and benefits paid
These are two separate publications detailing trends since September 1997 in the number of insured
persons and benefits paid for hospital and general treatment.
Annual publications
PHIAC is also required to produce a Annual Report on the Operations of the Private Health
Insurance Industry. This report contains an industry overview and tables of statistics by
individual fund. Current and historical versions are available at:
http://phiac.gov.au/about/publications/
Private health Insurance Administration Council
11
Financial information
Financial Performance
All Figures $'000
Revenue
HIB premium revenue
Net HRB and other revenue
Total revenue
Benefits
Fund benefits
State ambulance levies
Total fund benefits
Expenses
HIB expenses
HIB claims handling
Other expenses
Total expenses
Profit
Profit/(loss) before tax
Taxation expense
Profit/(loss) of the industry
Margins
Gross margin
HIB expenses
Net margin
12 months to
March 2014
12 months to
March 2013
18,962,101
543,385
19,505,486
17,633,095
602,976
18,236,071
16,525,579
189,536
16,715,114
14,997,335
180,933
15,178,268
1,328,068
300,434
27,052
1,655,554
1,283,013
292,108
20,045
1,595,166
1,134,817
253,629
881,188
1,462,637
264,198
1,198,439
11.85%
8.59%
3.26%
13.92%
8.93%
4.99%
Gross and net margins were down for the
12 months to March 2014, with the industry
delivering an after-tax profit of $881 million.
Revenues were up 7.0% for the year while
total fund benefits increased by 10.1%,
reflecting the increasing cost of health
services and growing utilisation rates. The
net effect was a noticeable fall in gross
margin from 13.9% to 11.9%.
Whilst expenses as a percentage of
revenue decreased from 8.9% to 8.6%, it
was not sufficient to offset the growth in
fund benefits. The result was a drop in net
margin for the year from 5.0% to 3.3%.
Health Benefits Fund Profit After Tax Breakdown for 12 months to March 2014
$543
$16,715
$281
$881
Profit/(loss) after
tax
$1,328
Other admin
expenses
HIB claims
handling
Fund benefits
Net other
revenue
HIB premium
revenue
$300
Net other
expenses
(millions)
$18,962
Private Health Insurance Administration Council
12
Prudential Position
March
2014
December
2013
March
2013
1,289,005
831,577
694,489
1,054,128
6,339,575
478,967
1,034,113
6,302,924
504,117
866,765
6,979,111
495,802
100,508
98,734
89,130
24,316
76,743
396,581
28,930
1,259,053
11,047,806
15,459
77,032
360,042
32,127
1,164,597
10,420,721
20,032
80,663
336,543
29,094
1,140,639
10,732,268
2,346,090
1,883,951
2,263,856
1,558,210
1,439,730
1,438,396
158,432
3,136
151,180
30,881
140,507
29,868
All Figures $'000
Assets
Cash
Investments
Equities
Interest bearing assets
Property
Subsidiary and associated
entities
Loans
Receivables
Intangibles DAC and FITBS
Pre-paid expenses
Other*
Total assets
Liabilities
Unearned premium liabilities
Unpresented & outstanding
claims
Other fund liabilities
Interest bearing liabilities
Payables, provisions &
other liabilities
Total liabilities
Health benefits fund capital
Capital Adequacy Requirement**
Liability risk charges
Loss risk charges
Operational risk charges
Other capital charges
Total Capital Adequacy Requirement
Surplus Capital
658,367
797,259
772,108
4,724,235
6,323,572
4,303,001
6,143,738
4,644,736
6,112,532
432,776
651,375
139,435
0
5,917,821
5,129,986
6,584,678
3,836,043
6,727,450
4,004,817
On 31 March 2014 the first changes
to the Capital adequacy and
Solvency requirements applicable to
private health insurers had effect.
The changes introduced had the
effect of reducing minimum capital
adequacy requirements by more
than $1 billion across the industry.
The industry remains well capitalised
and in a strong prudential position
with total assets of over $11 billion –
over $5 billion in excess of new
minimum capital adequacy
requirements.
There was some movement between
asset classes in the 12 months to
March 2014, with cash increasing
strongly.
Total assets increased over the 12
months to March 2014, however this
was offset by a 9.8% rise in liabilities.
* includes health insurance equipment and other assets
** Changes to the new Capital Adequacy Standard had effect from 31 March 2014, and introduced different charges
Health Benefits Fund Assets vs Liabilities as at 31 March 2014
Cash
Equities
11%
Interest bearing assets
12%
Property
5%
1%
4%
10%
43%
Subsidiary and associated entities
Loans, premiums receivable, prepayments and intangibles
Other
Balance sheet liabilities
Liability risk charges
57%
1%
6%
Loss risk charges
4%
Operational risk charges
Other capital charges
13
Private Health Insurance Administration Council
Notes on statistics
The population figures used to calculate coverage are derived from:
Australian Bureau of Statistics, Australian Demographic Statistics,
ABS cat no. 3101.0, ABS, Canberra.
ACT data is collected and reported separately to NSW for the first time in the quarterly data
collection for December 2009.
Net change by five year age group is the actual change adjusted for the number of people of
people moving into the cohort and out of the cohort due to ageing. The calculation makes the
simplifying assumption that the number of people are evenly distributed over each year within
the five year age group.
Lifetime Health Cover is a financial loading (LHC loading) that can be payable in addition to the
premium for your private health insurance hospital cover (hospital cover). LHC loadings apply
only to hospital cover. The loading is 2% above the base rate for each year over the age of 30
in which the policy holder did not have private health insurance hospital cover. After ten years
of paying the loading the loading is removed.
Starting from 1 April 2007 general treatment policies replaced ancillary policies. General
treatment policies cover treatment similar to that previously known as ancillary (eg. dental) but
can also cover hospital-substitute treatment and Chronic Disease Management Programs.
Categories for the collection of prostheses data by PHIAC changed in the September 2012
quarter due to updates made to the Prostheses Item List. December 2011, March 2012 and
June 2012 quarters were also updated to reflect these new categories.
All monetary amounts are expressed in Australian dollars.
Private health Insurance Administration Council
14
© Copyright 2026 ExpyDoc