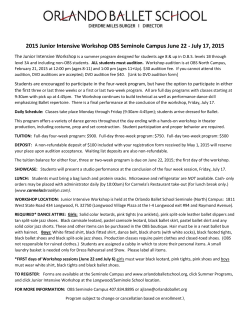
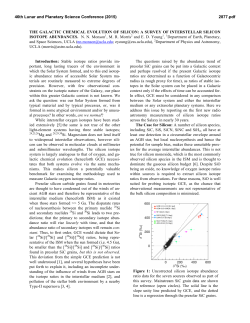
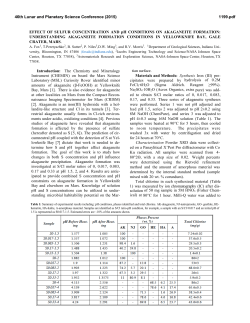
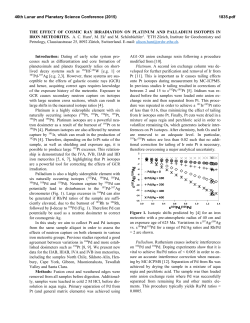
1st International Conference of Recent Trends in Information and Communication Technologies
Ensuring the Fairness among the Network Traffic Types over Optical
Burst Switching Networks
Mohammed Al-Shargabi1, Zaid Shamsan2,Abdulsamad Ismail3, Sevia M Idris3, Faisal Saeed3
1
College of Computer Science and Information Systems,NajranUniversity, Kingdom ofSaudi Arabia,
2
Al-Imam Muhammadibn SaudIslamicUniversity, Kingdom of Saudi Arabia,
3
Facultyof Computing, Universiti Teknologi Malaysia, Johor Bharu, Malaysia.
Abstract
Optical burst switching (OBS) networks have been attracting much consideration
as a promising approach to build the next generation optical Internet.Aggregating the
burst in the OBS networks from the high priority traffic only will increase the
average of the loss of its packets. However, the ratio of the high priority traffic (e.g.
real-time traffic) in the burst is a very important factor for reducing the data loss, and
ensuring the fairness between network traffic types. This paper introduces a
statistical study based on the significance difference between the traffics to find the
fairness ratio for the high priority traffic packets against the low priority traffic
packets inside the data burst with various network traffic loads. The results show an
improvement in the OBS quality of service (QoS) performance and the high priority
traffic packets fairness ratio inside the data burst is 50 to 60%, 30 to 40%, and 10 to
20% for high, normal, and low traffic loads, respectively.
Keywords: OBS, real time traffic, burst assembly schemes, fairness.
1. Introduction
Optical Burst Switching (OBS) [1, 2] network seems to be the next generation of the optical
Internet backbone infrastructure due to its attractive characteristics. Prioritized contention resolution
[3, 4, 5] is effective contention resolution schemes in which the edge node combines packets of
different traffic priority into the same burst, whereas lower priority traffic packets aggregate the tail
of the burst, or the head of the burst. Accordingly, a complete isolation of the highest priority traffic
can be achieved, which will provide much better quality of service (QoS) than the single traffic
burst. However, the proposed schemes have not considered the fairness factor among the traffic
types.
* Corresponding author: [email protected]
Mohammed Al-Shargabi et. al. /IRICT (2014) 221-227
222
Moreover, the best ratio of the high priority traffic in the burst has not been mentioned,
although this ratio is very significant for providing the QoS for this type of traffics. For example, if
the edge node aggregates 10% of the burst as a high priority traffic and 90% as a low priority traffic,
this ratio could reduce the loss of the high priority traffic; conversely, it will increase the overall loss
in the core node and then affect the performance of the network; this loss is due to the large number
of burst that will be aggregated in the edge node which will increase the overall loss at the core node.
Additionally, if the edge node aggregates 90% of the burst as high priority traffic and 10% as low
priority traffic, this ratio can reduce the loss in the core node due to the small number of burst that
will be aggregated but will also increase the loss of the high priority traffic. Thus, the ratio of the real
time traffic inside the burst is essential to reduce the real time traffic packets loss rate. In this paper, a
statistical study based on the significance difference between the trafficsto find the fairness ratio for
the high priority traffic packets against the low priority traffic packets inside the data burst with
various network traffic loads is introduced.
2. The Statistical Study
This statistical study is carried out to find the best ratio (fairness ratio) for the real time traffic
packets against the non real time traffic packets in various network traffic loads. The statistical
study is based on the Significant difference (Sd) factors between the network's Over all loss (Oloss)
and the Real time traffic loss (Rloss).The Sd factor indicates the fairness among the traffics, where
the high value of Sdmeans that no fairness is provided due to the high difference of the data loss
among the traffics. In the opposite, the Sdlow value means that there is a fairness in this ratio due
to the low difference among the data loss of both traffics (real time and non-real time). The
significant difference factors are found by using a simulation model which deals with two types
of real time traffic variable bit rate (VBR) and constant bit-rate (VBR), two values of burst size
(16000 Kbytes and 32000 Kbytes [6]), two different topologies (four nodes SOBS topology and
National Science Foundation Network (NSFNET)topology [7]), incremental load traffic rate, and
ten ratio values for real time traffic (10 to 100 %). As a result, ten Sd values are produced for each
case in the study as follows:
𝑓𝑜𝑟𝑥 = 10,20, 30, . . , 100
𝑠𝑑(𝑥) = ‖𝑂(𝑥)𝑑𝑟𝑜𝑝 − 𝑅(𝑥)𝑑𝑟𝑜𝑝 ‖
(1)
wherex determines the real time traffic ratio in the data burst. In equation(1), the value of x will be
replaced, ten times, with the real time ratios in the data burst and stored in the Sd group.
Consequently, based on these results, mathematical equations to find the range of the best ratio
for real time traffic in the burst that can guarantee the fairness between real time traffic and non
real time traffic are found. The mathematical equations aim to find the lowest two minimum
ratios in Sd; the Lowest ratio (Lowratio) and Second Lowest ratio (SLowratio). The Lowratio can be
derived by using the minimum Sd value,Lowvaluewhichis given by
𝐿𝑜𝑤𝑣𝑎𝑙𝑢𝑒 = min *𝑆𝑑+
(2)
Subsequently,Eq. (2) aims to find out the ratio of the value ofLowratio by searching in the
entireSd group ratio as follows:
Mohammed Al-Shargabi et. al. /IRICT (2014) 221-227
223
𝑓𝑜𝑟𝑖 = 10, 20, 30, . . , 100
𝐿𝑜𝑤𝑟𝑎𝑡𝑖𝑜 = 𝑖, 𝑖𝑓𝐿𝑜𝑤𝑣𝑎𝑙𝑢𝑒 = 𝑆𝑑(𝑖).
(3)
The second minimum Sd (SLowratio) can be found by using a temporary group of elements
Sdtemp that contains all Sd except Lowratio:
*𝑆𝑑𝑡𝑒𝑚𝑝 + = *𝑆𝑑+ ∕ 𝐿𝑜𝑤𝑟𝑎𝑡𝑖𝑜 .
(4)
Therefore, SLowvalue will be the minimum value of the new temporary group Sdtemp:
𝑆𝐿𝑜𝑤𝑣𝑎𝑙𝑢𝑒 = min*𝑆𝑑𝑡𝑒𝑚𝑝 +
(5)
Subsequently, this value of SLowvaluecan be used to find SLowratio by searching in the entireSdtemp
group ratio
𝑓𝑜𝑟𝑖 = 10, 20, 30, . . , 100
𝑆𝐿𝑜𝑤𝑟𝑎𝑡𝑖𝑜 = {𝑖, 𝑖𝑓𝑆𝐿𝑜𝑤𝑣𝑎𝑙𝑢𝑒 = 𝑆𝑑𝑡𝑒𝑚𝑝 (𝑖)(6)
Thus, after getting the values of Lowratio and SLowratio, the average ratio of the real time traffic in
the burst (Avgratio) will be in the range between Lowratio and SLowratio based on the network traffic
load according to (7):
𝐴𝑣𝑔𝑟𝑎𝑡𝑖𝑜 ≬ 𝐿𝑜𝑤𝑟𝑎𝑡𝑖𝑜 ⋀𝑆𝐿𝑜𝑤𝑟𝑎𝑡𝑖𝑜
(7)
This equation will identify the range of best ratios of real time traffic inside the data burst, which
will reduce the real time traffic packets loss, at the same time guarantee the fairness for non real
time traffic packets.
Generally, the objective of this method is to demonstrate the exact ratio that can reduceboth the
real time traffic loss and the ensure fairness for the non real time traffic loss requirements.
Moreover, this study aims to make sure that the accuracy of fairness ratio is capable to work
under various conditions such as different types of real time traffic, various values of burst size, or
various designs of the topology.
3. The Simulation Results and Discussions
Depending on the aforementioned equations in the previous section, the simulation model is
build using NCTUns simulator [6]to obtain the fairness ratio. The configuration of the simulation
models is divided into two parts: the OBS network configuration and the real time traffic
configuration. In the real time traffic configuration, CBR traffic and VBR traffic trace files are
created with incremental load.
The results show that the aggregation process can be categorized based on the traffic load into
three categories, which are the low, normal, and high loads. In the high load, the results show that
the best ratio for real time traffic in the burst that can guarantee the fairness between real time
traffic and non real time traffic is between 50 % and 60 %. Figures 1 and 2 show the Sd factor in
the high traffic load for CBR and VBR traffic. The Sd has been studied, as shown in the figures,
with several factors that are the traffic type (CBR, and VBR), burst size (16000 Kbyte, 32000
Mohammed Al-Shargabi et. al. /IRICT (2014) 221-227
224
Kbyte [5]), network topology layout (four nodes OBS (SOBS), NSFNET [6]), and traffic load
(80%, 100%). The results show that the best ratio (which ranging from 50 % to 60 %) is based on
the network traffic load value.It is noted that the value of Sd gradually decreases from the ratio of
10% to 50%. This is because of the numerous numbers of data burst that are created and sent to
the core network due to the small ratio of real time traffic in each burst. This leads to an increase
in the number of data burst needed to send all the real time traffic available in a certain period,
and this in turn increases the rate of burst loss in the core node which creates a discrepancy
between the value of the network overall loss and the real time traffic packets loss.Thus, it can be
noted that the Sd value goes high in the case of ratio of 10% and reduces with the increase of the
ratio of real time traffic in the burst which reduces the rate of burst loss until it reaches to the ratio
50%.
Significant difference (Sd)
9.0E+01
CBR (16000, SOBS, 80%)
CBR (32000, SOBS, 80%)
CBR (16000, NSFNET, 80%)
CBR (32000, NSFNET, 80%)
CBR (16000, SOBS, 100%)
CBR (32000, SOBS, 100%)
CBR (16000, NSFNET, 100%)
CBR (32000, NSFNET, 100%)
8.0E+01
7.0E+01
6.0E+01
5.0E+01
4.0E+01
3.0E+01
2.0E+01
1.0E+01
0.0E+00
10
20
30
40
50
60
70
80
90
100
Real Time Traffic Ratio
Fig.1. The significant difference (Sd) factor values in the high traffic load for CBR traffic.
9.0E+01
VBR (16000, SOBS, 80%)
VBR (32000, SOBS, 80%)
VBR (16000, NSFNET, 80%)
VBR (32000, NSFNET, 80%)
VBR (16000, SOBS, 100%)
VBR (32000, SOBS, 100%)
VBR (16000, NSFNET, 100%)
VBR (32000, NSFNET, 100%)
Significant difference (Sd)
8.0E+01
7.0E+01
6.0E+01
5.0E+01
4.0E+01
3.0E+01
2.0E+01
1.0E+01
0.0E+00
10
20
30
40
50
60
70
80
90
100
Real Time Traffic Ratio
Fig. 2The significant difference (Sd) factor values in the high traffic load for VBR traffic.
In contrast, it can be noted from Figs. 1 and 2 that the value of Sd gradually increases from 60%
up to 100%, due to the rise of the rate of real time traffic packets loss caused by its high ratio in
the burst and the low rate of overall loss which is created by the low number of bursts. Thus, it
can be noted that the Sd value is high at those ratios and getting a raise with the increase of the
ratio of real time traffic in the burst, which causes an increasing of the rate of real time traffic
Mohammed Al-Shargabi et. al. /IRICT (2014) 221-227
225
packets loss until it reaches to the ratio 100%.
In the normal load case, the results in Figs. 3 and 4 show that the best ratio for real time traffic
in the burst that can guarantee the fairness between real time traffic and non real time traffic. This
ratio is between 30 % and 40 %.
The Sd is also studied using same factors that used in the high traffic load mentioned above. It
can be noted in the normal load case that the value of Sd is low for the low ratios (10 to 50%) and
high for the higher ratios compared with the high load traffic case.
1.0E+02
CBR (16000, SOBS, 60%)
9.0E+01
CBR (32000, SOBS, 60%)
Significant difference (Sd)
8.0E+01
CBR (16000, NSFNET, 60%)
7.0E+01
CBR (32000, NSFNET, 60%)
6.0E+01
5.0E+01
4.0E+01
3.0E+01
2.0E+01
1.0E+01
0.0E+00
10
20
30
40
50
60
70
80
90
100
Real Time Traffic Ratio
Fig. 3The significant difference (Sd) factor values in the normal traffic load for CBR traffic.
9.0E+01
VBR (16000, SOBS, 60%)
Significant difference (Sd)
8.0E+01
VBR (32000, SOBS, 60%)
7.0E+01
VBR (16000, NSFNET, 60%)
6.0E+01
VBR (32000, NSFNET, 60%)
5.0E+01
4.0E+01
3.0E+01
2.0E+01
1.0E+01
0.0E+00
10
20
30
40
50
60
70
80
90
100
Real Time Traffic Ratio
Fig. 4The significant difference (Sd) factor values in the normal traffic load for VBR traffic.
This variation is due to the traffic load which increases the traffic load rate in the high load case;
while the rate of real time traffic packets loss is similar in both cases which make the Sd value
goes high in the high traffic load case.In contrast, for the high ratios from 50% up to 100%, it is
noted that the value of Sd is higher than that of the low ratios due to the decrease of overall rate
loss in this case; while the rate of real time traffic packets loss is similar in both normal and high
traffic load cases, which makes the Sd value higher in the normal traffic load case.
In the low traffic load, the findings showthat the best ratio for real time traffic in the burst that
can guarantee the fairness between real time and non real time traffic ranges between 10 and
20 %. Figures 5 and 6 show the significant difference factor in the low traffic load for CBR and
Mohammed Al-Shargabi et. al. /IRICT (2014) 221-227
226
VBR traffic. Similarly, same factors are used for the cases mentioned above.
1.2E+02
CBR (16000, SOBS, 40%)
CBR (32000, SOBS, 40%)
CBR (16000, NSFNET, 40%)
CBR (32000, NSFNET, 40%)
CBR (16000, SOBS, 20%)
CBR (32000, SOBS, 20%)
CBR (16000, NSFNET, 20%)
CBR (32000, NSFNET, 20%)
Significant difference (Sd)
1.0E+02
8.0E+01
6.0E+01
4.0E+01
2.0E+01
0.0E+00
10
20
30
40
50
60
70
80
90
100
Real Time Traffic Ratio
Fig. 5 The significant difference (Sd) factor values in the low traffic load for CBR traffic.
1.2E+02
VBR (16000, SOBS, 40%)
VBR (32000, SOBS, 40%)
VBR (16000, NSFNET, 40%)
VBR (32000, NSFNET, 40%)
VBR (16000, SOBS, 20%)
VBR (32000, SOBS, 20%)
VBR (16000, NSFNET, 20%)
VBR (32000, NSFNET, 20%)
Significant difference (Sd)
1.0E+02
8.0E+01
6.0E+01
4.0E+01
2.0E+01
0.0E+00
10
20
30
40
50
60
70
80
90
100
Real Time Traffic Ratio
Fig. 6 The significant difference (Sd) factor values in the low traffic load for VBR traffic.
It can be observed that the lowest Sd values are within the ratios 10% and 20%, which make
them the best ratios for the real time traffic in the burst to guarantee the fairness concept. This
finding is a result of the low traffic load which decreases the loss rate of overall traffic loads in
this case; similarly the rate of real time traffic packets loss is approximately same in all cases
which make the Sd value low in the low traffic load case.
Generally, it can be noted that there are some differences between the results of VBR traffic
and CBR traffic, these differences are dating back to the nature of VBR traffic which comes with
different size and bursty load traffic that leads to increase VBR traffic packets loss probability.
Mohammed Al-Shargabi et. al. /IRICT (2014) 221-227
227
4. Conclusion
In this paper, a statistical study based on the significance difference between the traffics has
been carried out to obtain the best ratio (fairness ratio) for the real time traffic packets against the
non real time traffic packets under various network traffic loads. It has been found that the real
time traffic packets fairness ratio inside the data burst is ranging from 50 to 60%, 30 to 40%, and
10 to 20% for high, normal, and low traffic loads, respectively. The results show that OBS data
burst using these ratios provides a better performance, reduces the high priority packet loss
probability and ensure the fairness for other traffic types.
References
[1] Qiao, C.M. and M.S. Yoo, Optical burst switching (OBS) - a new paradigm for an optical
Internet. Journal of High Speed Networks, 1999. 8(1): p. 69-84.
[2] Alvaro L. Barradas, and Maria do Carmo R. Medeiros, Edge-Node Deployed Routing
Strategies for Load Balancing in Optical Burst Switched Networks, ETRI Journal, vol.31, no.01,
Feb. 2009, pp 31-41.
[3] Vokkarane, V.M. and J.P. Jue, Prioritized burst segmentation and composite burst-assembly
techniques for QoS support in optical burst-switched networks. Selected Areas in
Communications, IEEE Journal on, 2003. 21(7): p. 1198-1209.
[4] Hongyun, Z., C. Changjia, and Z. Yongxiang. Delayed Burst Segmentation for Multi-hop
Optical Burst Switching Networks. in Communications and Mobile Computing, 2009. CMC
'09.WRI International Conference on. 2009.
[5] Sarwar, S., et al. Composite burst assembly with high-priority packets in the middle of burst.
in Broadband Communications, Networks and Systems, 2008. BROADNETS 2008.5th
International Conference on. 2008.
[6] Quaglio, J.V., T. Gunji, and C.M. Hirata, Extending NCTUns simulator to support mobile
networks, in Proceedings of the 2nd International Conference on Simulation Tools and
Techniques. 2009, ICST (Institute for Computer Sciences, Social-Informatics and
Telecommunications Engineering): Rome, Italy. p. 1-10.
[7]Mills, D.L. and H. Braun, The NSFNET backbone network. SIGCOMM
Comput.Commun.Rev., 1987. 17(5): p. 191-196.
© Copyright 2026 ExpyDoc